

Blog
How to Analyze GDP Reports and Their Impact on Forex Trading

Analyzing Gross Domestic Product (GDP) reports for forex trading involves comparing the actual released data against both the consensus forecast and the previous period’s figure to identify market surprises and economic trends. A GDP figure that beats expectations signals a strengthening economy, which is typically bullish for the country’s currency, while a figure that misses expectations indicates economic weakness, which is usually bearish. By understanding this core relationship, traders can anticipate potential shifts in monetary policy and market sentiment.
The Gross Domestic Product report serves as a comprehensive scorecard for a nation’s economic health, measuring the total value of all goods and services produced within its borders. This report is critical because a country’s economic performance is directly linked to the strength of its currency. Strong economic growth often leads to higher interest rates and increased foreign investment, boosting currency demand.
For traders, the importance of the GDP report lies in its profound influence on a central bank’s monetary policy. Central banks, like the U.S. Federal Reserve, use GDP data as a primary input when deciding whether to raise, lower, or hold interest rates. These interest rate decisions are among the most powerful drivers of currency valuation in the forex market.
A deep analysis goes beyond the headline number. Professional traders dissect the report’s components, assess the economic momentum from quarter to quarter, and, most importantly, gauge the market’s reaction to any “surprise” in the data. This guide will walk you through exactly how to interpret these reports to find potential trading opportunities.
What Is a Gross Domestic Product (GDP) Report?
Gross Domestic Product (GDP) is a key economic indicator that measures the total monetary value of all goods and services produced within a country’s borders during a specific period, typically a quarter or a year. In simple terms, it’s the most comprehensive measure of a country’s total economic output and a primary gauge of its economic health. For forex traders, it’s like a regular check-up on a country’s financial fitness. A healthy, growing GDP suggests a robust economy with increasing company profits and consumer spending. Conversely, a shrinking GDP indicates an economy in decline, potentially heading toward a recession. This single number encapsulates a vast amount of economic activity, making it one of the most-watched indicators on any economic calendar.
To understand this better, let’s explore the different versions of the report and the formula used to calculate the final number.
What Are the Different Types of GDP Reports?
There are three main types of GDP reports for each quarter: the Advance, Preliminary, and Final releases, each offering a progressively more accurate picture of economic activity. For a trader, knowing the difference is essential because their market impact varies greatly.
First is the Advance GDP report. This is the earliest estimate, typically released about one month after the quarter has ended. Because it’s the first look at the data, it tends to have the most significant impact on the forex market. Traders and investors are eager for this initial glimpse, and any major deviation from economists’ forecasts can cause substantial currency volatility. However, this report is based on incomplete data and is often subject to major revisions in subsequent releases.
Next comes the Preliminary GDP report, also known as the second estimate. It is released about two months after the quarter ends. This version incorporates more complete data that was unavailable for the advance report. While its market impact is generally less than the advance release, a significant revision from the first estimate can still trigger a strong market reaction. For instance, if the advance report showed strong growth but the preliminary report revises that figure sharply downward, it could reverse the initial positive sentiment for the currency.
Finally, we have the Final GDP report. As the name suggests, this is the last and most complete version, released about three months after the quarter’s close. By the time this report comes out, the market usually has a very clear picture of the economy’s performance during that period from the previous two releases. For this reason, the final report typically has the least market impact, unless there is a very unexpected and large revision from the preliminary figure. Traders primarily use it to confirm the established economic trend.
How Is GDP Calculated?
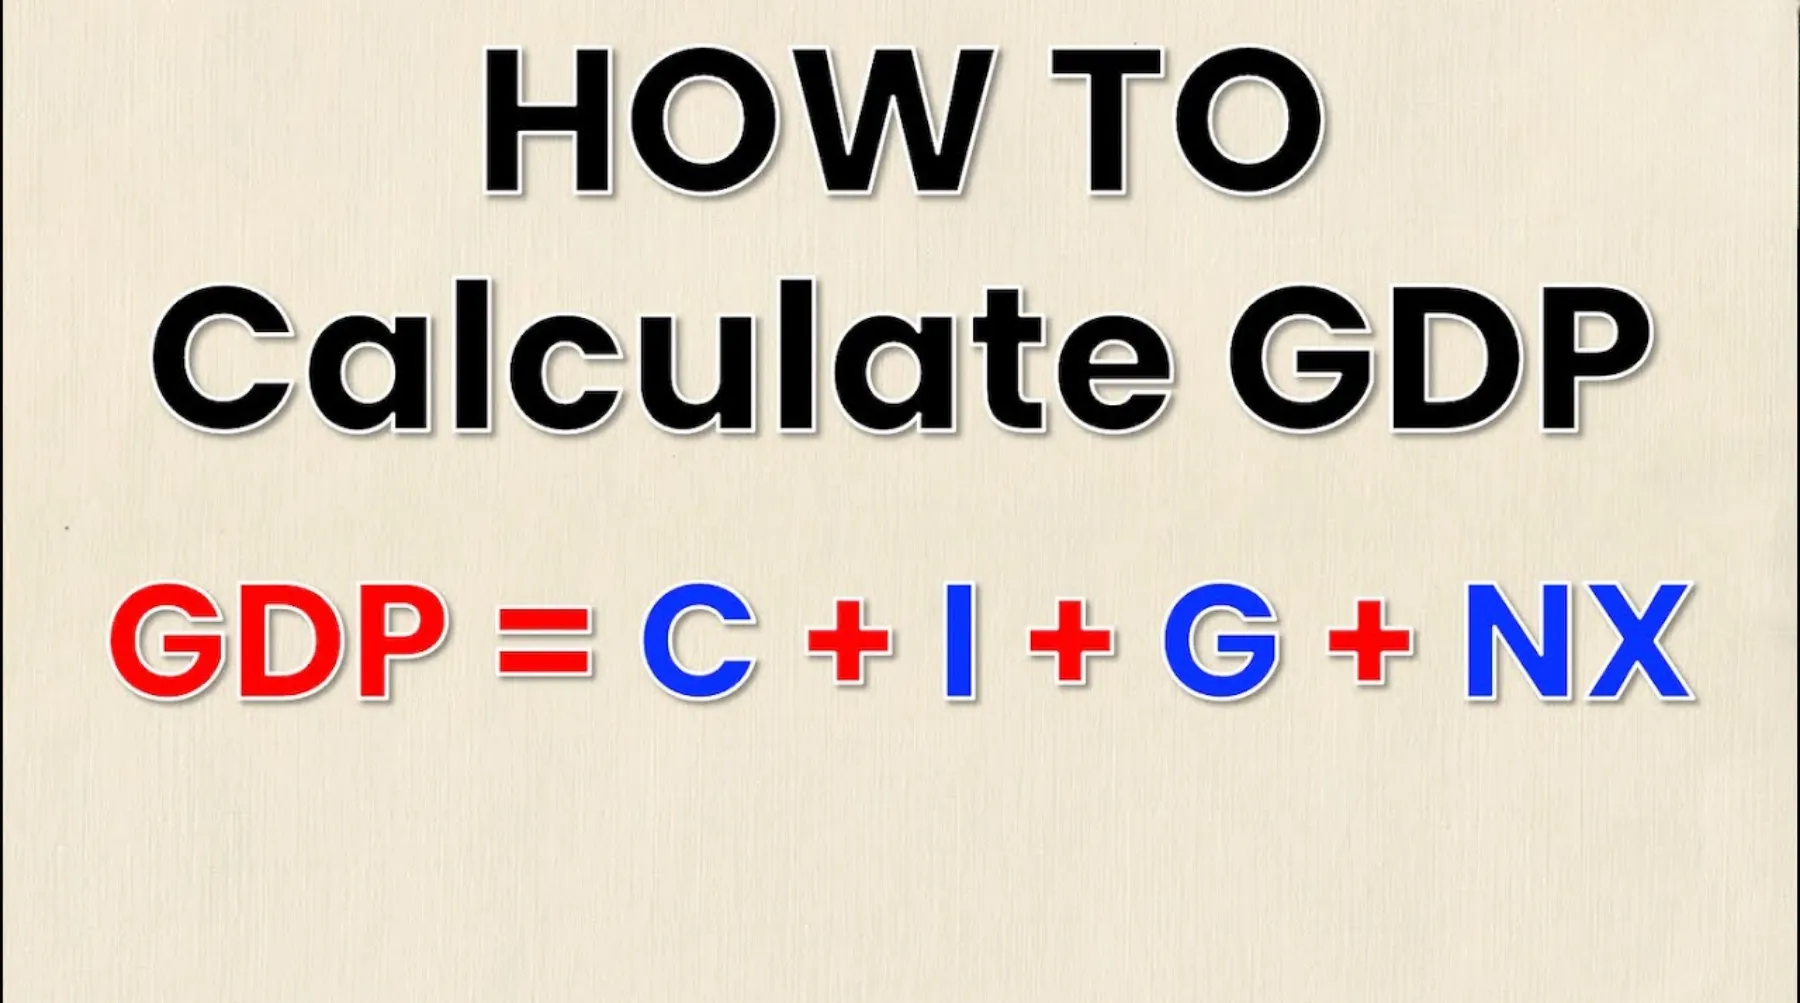
To properly interpret a GDP report, it helps to understand what components make up the final number. The most common method used is the expenditure approach, which can be summarized with a straightforward formula: GDP = C + I + G + (X – M). Each letter represents a critical source of spending in the economy.
- C stands for Consumption. This is personal consumption expenditure, or all the money spent by households on goods (like cars and clothes) and services (like haircuts and vacations). In most developed economies, including the United States, consumption is the largest component of GDP, often making up over two-thirds of the total. A strong consumer spending figure signals confidence in the economy.
- I stands for Investment. This category includes spending by businesses on new equipment, software, and buildings. It also covers residential construction and changes in business inventories. High investment levels suggest that companies are optimistic about the future and are expanding their operations, which is a positive sign for economic growth.
- G stands for Government Spending. This represents all spending by federal, state, and local governments on goods and services, such as military equipment, infrastructure projects like roads and bridges, and the salaries of public employees.
- (X – M) stands for Net Exports. This is the value of a country’s total exports (X) minus the value of its total imports (M). If a country exports more than it imports, it has a trade surplus, which adds to its GDP. If it imports more than it exports, it has a trade deficit, which subtracts from its GDP.
By breaking down the GDP figure into these four parts, a trader can see what is driving economic growth or contraction. For example, is growth being fueled by strong consumer spending, or is it being dragged down by a large trade deficit? This deeper insight provides valuable context beyond the headline number.
Why Is the GDP Report Important for Forex Traders?
The GDP report is important for forex traders because it provides a direct measure of a country’s economic health, which heavily influences central bank policy and investor sentiment toward its currency. A country with a strong, growing GDP is generally seen as a stable and profitable place to invest. This attracts foreign capital, which increases the demand for that country’s currency and, in turn, causes its value to appreciate. Conversely, a country with a weak or shrinking GDP may see investors pull their money out in search of better returns elsewhere, leading to a decrease in demand for its currency and a drop in its value. Think of it as a global competition for investment. Money flows to economies that demonstrate strength and stability, and the GDP report is the primary scorecard.
To understand this relationship better, let’s explore how GDP data shapes monetary policy and the nuances of currency strength.
How Does GDP Influence Monetary Policy?
Central banks around the world, such as the U.S. Federal Reserve (the Fed), the European Central Bank (ECB), and the Bank of England (BOE), have specific mandates, which almost always include maintaining price stability (controlling inflation) and promoting maximum employment. GDP data is one of the most critical pieces of information they use to make decisions that help them meet these goals. The main tool they use is adjusting interest rates.
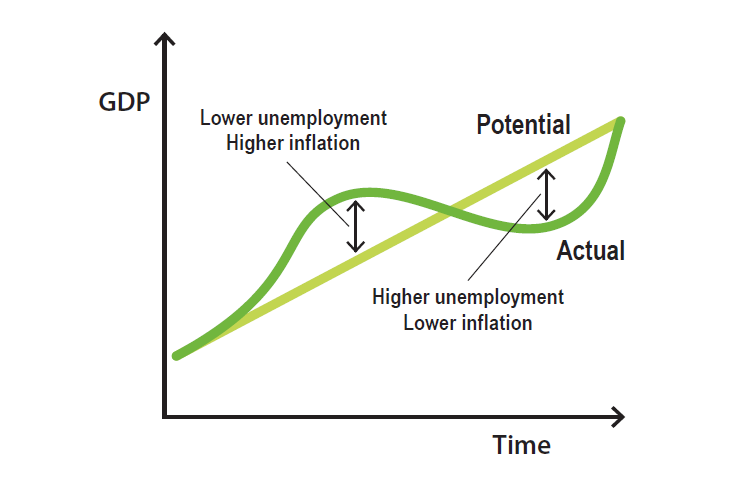
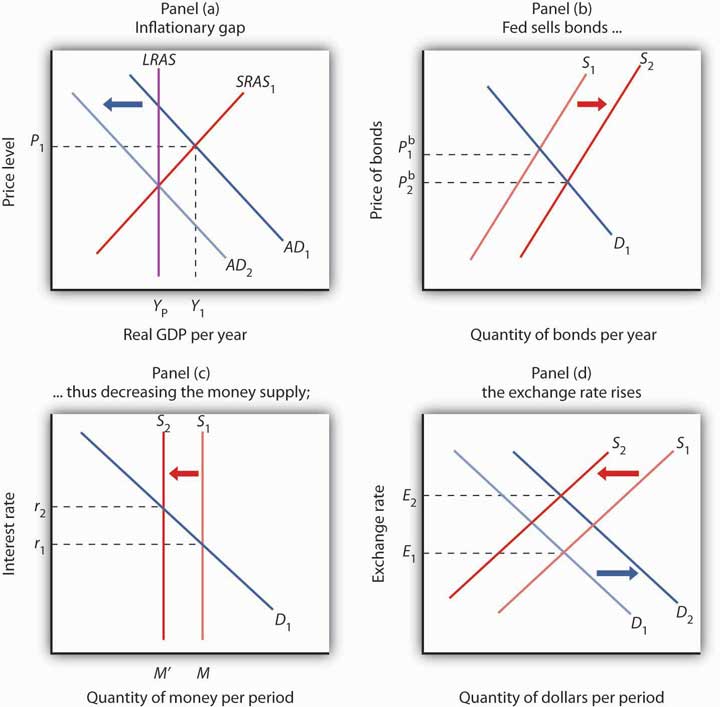
When a GDP report shows that the economy is growing rapidly, the central bank becomes watchful for signs of rising inflation. Strong growth means more jobs, higher wages, and more consumer spending, all of which can push prices up. To prevent the economy from “overheating” and keep inflation in check, the central bank may decide to raise interest rates. This is known as a hawkish policy stance. Higher interest rates make borrowing more expensive, which can cool down spending and investment. For forex traders, higher interest rates make holding that country’s currency more attractive because it offers a better return, thus strengthening the currency.
On the other hand, if a GDP report shows the economy is weak, slowing down, or contracting, the central bank may become concerned about a potential recession and rising unemployment. In this scenario, it is likely to lower interest rates to make borrowing cheaper, encouraging businesses to invest and consumers to spend. This is known as a dovish policy stance. Lower interest rates, however, reduce the return for foreign investors, making the currency less attractive and causing its value to fall. This direct link between GDP performance, central bank interest rate decisions, and currency valuation is the main reason why forex traders watch GDP releases so closely.
Does GDP Growth Always Strengthen a Currency?
No, strong GDP growth does not always strengthen a currency because factors like high inflation, unmet market expectations, and the global economic context can alter the typical relationship. While the general rule of “strong economy, strong currency” holds true most of the time, the forex market is complex, and traders must consider several nuances before making a decision.

One key factor is inflation. If GDP growth is accompanied by very high or accelerating inflation, it can be a negative for the currency. This condition, sometimes called an “overheating” economy, might force the central bank to raise interest rates aggressively. While this initially seems good for the currency, it could also create fears that these sharp rate hikes will eventually cause a recession. This uncertainty can make investors nervous and lead them to sell the currency. The worst-case scenario is stagflation, which is high inflation combined with low or negative growth, a situation that is very damaging for a currency’s value.
Another critical element is market expectations. Forex markets are constantly trying to predict the future. Before a GDP report is released, economists and analysts publish their forecasts. These forecasts create a market consensus. The actual impact on the currency often depends not on the absolute number but on how it compares to these expectations. For example, a solid 3% GDP growth might seem positive. But if the market was expecting 3.5% growth, the result is a disappointment and could actually cause the currency to weaken. The “surprise” factor is often what drives the most immediate and powerful market moves.
Finally, the global economic context matters. A currency’s value is always relative to another. If the U.S. economy grows by a modest 1%, but the Eurozone and UK are in a deep recession, that 1% growth looks very attractive by comparison. In this environment, the U.S. dollar would likely strengthen. Conversely, if a country’s GDP grows by 4%, but its major trading partners are all growing at 6%, its performance might be seen as lagging, potentially limiting its currency’s strength.
What Are the Key Components to Analyze in a GDP Report?
The key components to analyze in a GDP report are the headline growth figure’s deviation from the previous period and from the consensus forecast, which reveals economic trends and market surprises. While the main GDP percentage is the first thing everyone sees, savvy traders know that the real story is found by comparing this number to other data points. Simply seeing a positive number isn’t enough to make an informed trading decision. You need to understand its context. Is the economy picking up speed or slowing down? Did the result surprise the market, or was it already anticipated? Answering these questions is what separates a reactive trader from a proactive one.
Looking beyond the headline number requires comparing it to two other critical figures: the growth rate from the previous quarter and the number that economists were expecting.
What Is the Difference Between the Headline Figure and the Previous Figure?
Comparing the current GDP growth rate (the headline figure) with the previous quarter’s growth rate is essential for identifying the economic momentum. This comparison tells you whether a country’s economy is accelerating, decelerating, or maintaining a steady pace. This trend is often more important to long-term investors and central banks than a single quarter’s result.
Let’s look at an example. Suppose the latest Q2 GDP report shows an annualized growth of +2.5%. On its own, that seems like a decent number. However, you also need to look at the Q1 figure.
- Acceleration: If the Q1 GDP growth was +1.5%, then the jump to +2.5% in Q2 indicates that economic growth is accelerating. This is a very bullish sign for the currency, as it suggests underlying strength and may prompt the central bank to consider a more hawkish policy stance in the future.
- Deceleration: On the other hand, if the Q1 GDP growth was +3.5%, then the drop to +2.5% in Q2 shows that the economy is decelerating, or slowing down. Even though growth is still positive, the slowing momentum is a bearish sign. It might signal that the peak of the economic cycle has passed, potentially leading the central bank to adopt a more cautious or dovish tone.
By performing this simple quarter-over-quarter comparison, you gain a much clearer perspective on the health and direction of the economy, allowing you to anticipate future trends rather than just reacting to the latest headline.
What Is the Difference Between the Actual Figure and the Forecast Figure?
The difference between the actual released GDP figure and the consensus forecast from economists is arguably the most powerful driver of short-term volatility in the forex market. This is because financial markets are forward-looking and operate on expectations. Before any major economic data release, institutions and analysts survey economists to create a median forecast, which represents the market’s general expectation. This forecast gets “priced in” to the currency’s value in the days and hours leading up to the release.
The real market movement happens when the actual number is revealed. The difference between the actual number and the forecast is known as the “surprise” element.
- A Positive Surprise (Beat): If the actual GDP figure is higher than the forecast figure (e.g., actual +2.5% vs. forecast +2.0%), it’s a positive surprise. This new information was not priced in, so traders rush to buy the currency, causing its value to rise, often very quickly. The bigger the beat, the more dramatic the market reaction tends to be.
- A Negative Surprise (Miss): If the actual GDP figure is lower than the forecast figure (e.g., actual +1.5% vs. forecast +2.0%), it’s a negative surprise. This signals that the economy is weaker than everyone thought. Traders will quickly sell the currency, causing its value to fall.
- In Line with Expectations: If the actual figure matches the forecast exactly (e.g., actual +2.0% vs. forecast +2.0%), the market reaction is often muted. Since the news was already expected and priced in, there is no surprise to trade on, and the currency may not move much at all.
For this reason, when preparing to trade a GDP release, your analysis should always focus on the potential for a surprise. What is the market expecting, and what will happen if the actual number is significantly different?
How Do You Interpret GDP Data for Trading Signals?
You interpret GDP data for trading signals by analyzing the actual figure against the forecast and previous figures to determine if the result is bullish or bearish for the currency, then planning your trade accordingly. The process involves transforming the raw economic data into a clear directional bias for a currency pair. A positive GDP surprise generally creates a buying opportunity for the associated currency, while a negative surprise creates a selling opportunity. This interpretation forms the foundation of a fundamental trading strategy centered on major economic releases. Successful trading is about having a clear plan for each potential outcome before the data is released.
Here’s how to translate these data points into actionable trading ideas, depending on whether the news is better or worse than expected.
What Does a Higher-Than-Expected GDP Mean for a Currency?
A higher-than-expected GDP figure is almost always a bullish (positive) signal for a currency. When the actual growth number surpasses the consensus forecast, it tells the market that the economy is performing more strongly than previously thought. This positive surprise can trigger a chain reaction that benefits the currency.

First, it signals robust economic health. A thriving economy with strong consumer spending and business investment attracts foreign capital. International investors looking for better returns will be more inclined to invest in that country’s stock market and bonds, a process that requires them to buy the local currency, thereby increasing its demand and value.
Second, and more importantly, it directly influences the central bank’s outlook. A strong GDP report, especially if it’s accompanied by signs of inflation, increases the probability that the central bank will adopt a hawkish monetary policy. This means they might consider raising interest rates sooner or more aggressively than the market had anticipated. The prospect of higher interest rates is a powerful magnet for currency traders, as it means a higher yield on assets denominated in that currency. As a result, traders will quickly buy the currency in anticipation of these future rate hikes, leading to a sharp appreciation. For example, if U.S. GDP beats expectations, a trader might look to buy the USD against a currency with a weaker economic outlook, such as by buying USD/JPY or selling EUR/USD.
What Does a Lower-Than-Expected GDP Mean for a Currency?
Conversely, a lower-than-expected GDP figure is a bearish (negative) signal for a currency. When the actual number falls short of the market’s forecast, it indicates that the economy is weaker than anticipated. This negative surprise can send the currency’s value tumbling for several reasons.
First, it raises concerns about the country’s economic stability and future growth prospects. Foreign investors may become hesitant to commit capital, and some may even decide to pull their existing investments out, leading to a decrease in demand for the currency. This capital flight puts direct downward pressure on its value.
Second, a weak GDP reading forces the central bank to consider a more dovish monetary policy. Instead of thinking about raising rates, the central bank might now consider cutting them to stimulate the economy and prevent a recession. The possibility of lower interest rates makes holding the currency less attractive, as it offers a lower return compared to other currencies. In response to a GDP miss, traders will likely sell the currency in anticipation of potential rate cuts or a more pessimistic tone from policymakers. For instance, if the UK’s GDP report disappoints, a trader might look to sell the GBP against a currency with a stronger economic backdrop, such as by selling GBP/USD or selling GBP/JPY.
Which Currency Pairs Are Most Affected by GDP Releases?
The currency pairs most affected by GDP releases are the major pairs involving the US Dollar (USD), Euro (EUR), British Pound (GBP), Japanese Yen (JPY), and other G7 currencies. These currencies represent the world’s largest and most influential economies, so their economic health has a significant global impact. When these countries release their GDP data, the resulting volatility is most concentrated in currency pairs that include their native currency. For example, the U.S. GDP report will cause the most movement in pairs like EUR/USD, USD/JPY, and GBP/USD. The liquidity and high trading volume of these major pairs mean that they react quickly and efficiently to new fundamental information.
The impact is most pronounced when the GDP report comes from one of the world’s largest economies, especially the United States.
How Does the US GDP Report Affect Pairs like EUR/USD and USD/JPY?
Given that the United States is the world’s largest economy and the US dollar is the global reserve currency, the U.S. GDP report is the most important and most-watched economic release for forex traders everywhere. Its impact is felt across the entire market, but it is most direct on pairs involving the USD.
- EUR/USD: This is the most traded currency pair in the world. Its movements are heavily influenced by the relative economic strength of the Eurozone and the United States. A stronger-than-expected U.S. GDP report will almost always strengthen the USD. In the EUR/USD pair, this causes the rate to fall because it takes fewer dollars to buy one euro. Conversely, a weaker-than-expected U.S. GDP report weakens the USD, causing the EUR/USD rate to rise.
- USD/JPY: This pair is also highly sensitive to U.S. economic data. A strong U.S. GDP report boosts the USD, causing the USD/JPY rate to rise. This effect can be magnified because strong U.S. growth is often associated with a “risk-on” environment, where investors sell the safe-haven Japanese Yen to buy higher-yielding assets. A weak U.S. GDP report weakens the USD and can trigger “risk-off” sentiment, where investors flock to the safety of the JPY, causing the USD/JPY rate to fall, sometimes sharply.
How Do Other Major GDP Reports Affect Their Currency Pairs?
The same principles apply to other major economies and their currencies. Traders who focus on specific pairs must pay close attention to the GDP releases of the relevant countries.
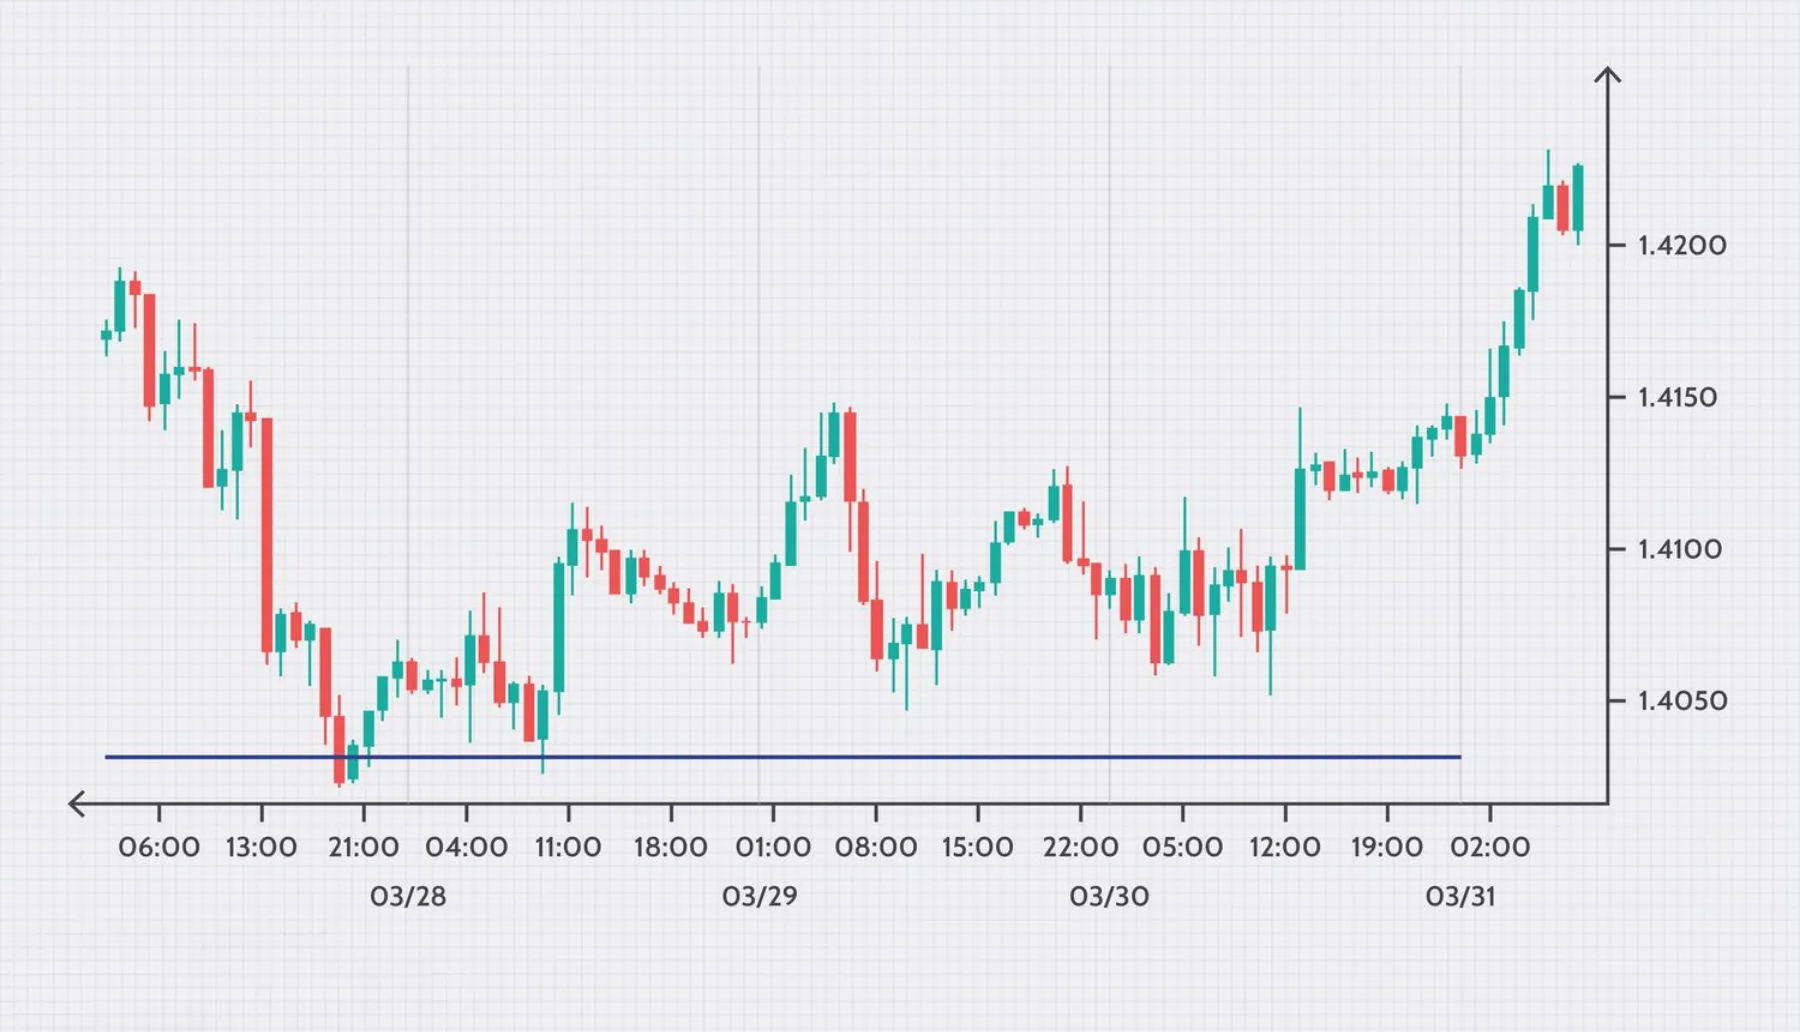
- Germany/Eurozone GDP (for EUR pairs): Germany is the economic powerhouse of the Eurozone. As a result, the German GDP report often has a significant impact on the Euro, sometimes even more than the report for the entire Eurozone. A positive surprise in German GDP data will typically strengthen the Euro, causing pairs like EUR/USD and EUR/JPY to rise. The broader Eurozone GDP report is also a major market mover for all EUR pairs.
- UK GDP (for GBP pairs): The United Kingdom’s GDP report is the primary health indicator for its economy and a key driver for the British Pound (GBP). A better-than-expected UK GDP figure will usually lead to a rally in the Pound, pushing pairs like GBP/USD and GBP/JPY higher. A disappointing report will have the opposite effect, causing those pairs to fall.
- Japan GDP (for JPY pairs): Japan’s GDP report directly affects the Japanese Yen. A strong report can strengthen the Yen, causing pairs like USD/JPY and EUR/JPY to fall. However, the market’s reaction can sometimes be more subdued compared to other countries. This is because the Bank of Japan has maintained an extremely dovish monetary policy for many years, so economic data has had less of an influence on interest rate expectations.
- Other Currencies: Traders should also watch GDP reports from other significant economies, such as Canada (for CAD pairs), Australia (for AUD pairs), and New Zealand (for NZD pairs). These commodity-linked currencies are highly sensitive to their domestic economic performance.
What Are Other Key Considerations for Trading GDP Reports?
Beyond the basic analysis, traders must consider specific trading strategies, key economic distinctions like Real versus Nominal GDP, and robust risk management protocols. Furthermore, understanding how Gross Domestic Product data compares to other indicators and how to use tools like an economic calendar is essential for navigating the market effectively.
What Are Common Trading Strategies for GDP News Releases?
Traders employ several strategies to capitalize on the volatility surrounding GDP releases, each with its own risk profile. One popular approach is trading the initial spike, where a position is opened in the direction of the price’s first major move immediately after the data is published. This strategy aims to capture the market’s knee-jerk reaction but is very risky due to widening spreads and potential for false moves. A second strategy is fading the initial move. This involves trading against the initial spike, based on the assumption that the first reaction is an overemotional one that will soon correct itself. A trader using this method waits for the initial momentum to slow and then enters a trade in the opposite direction. A third, more conservative approach is trading the established trend after the release. Instead of acting within the first few minutes of chaos, the trader waits for the market to digest the news and establish a clear, sustained direction, typically 30 to 60 minutes after the release. This strategy avoids the initial volatility and focuses on the more fundamentally driven trend that follows.
What Is the Difference Between Real GDP and Nominal GDP for Traders?
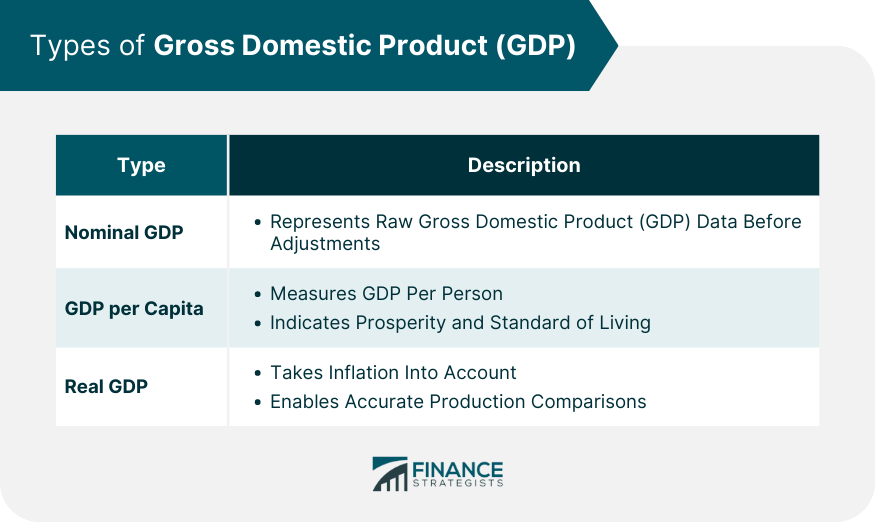
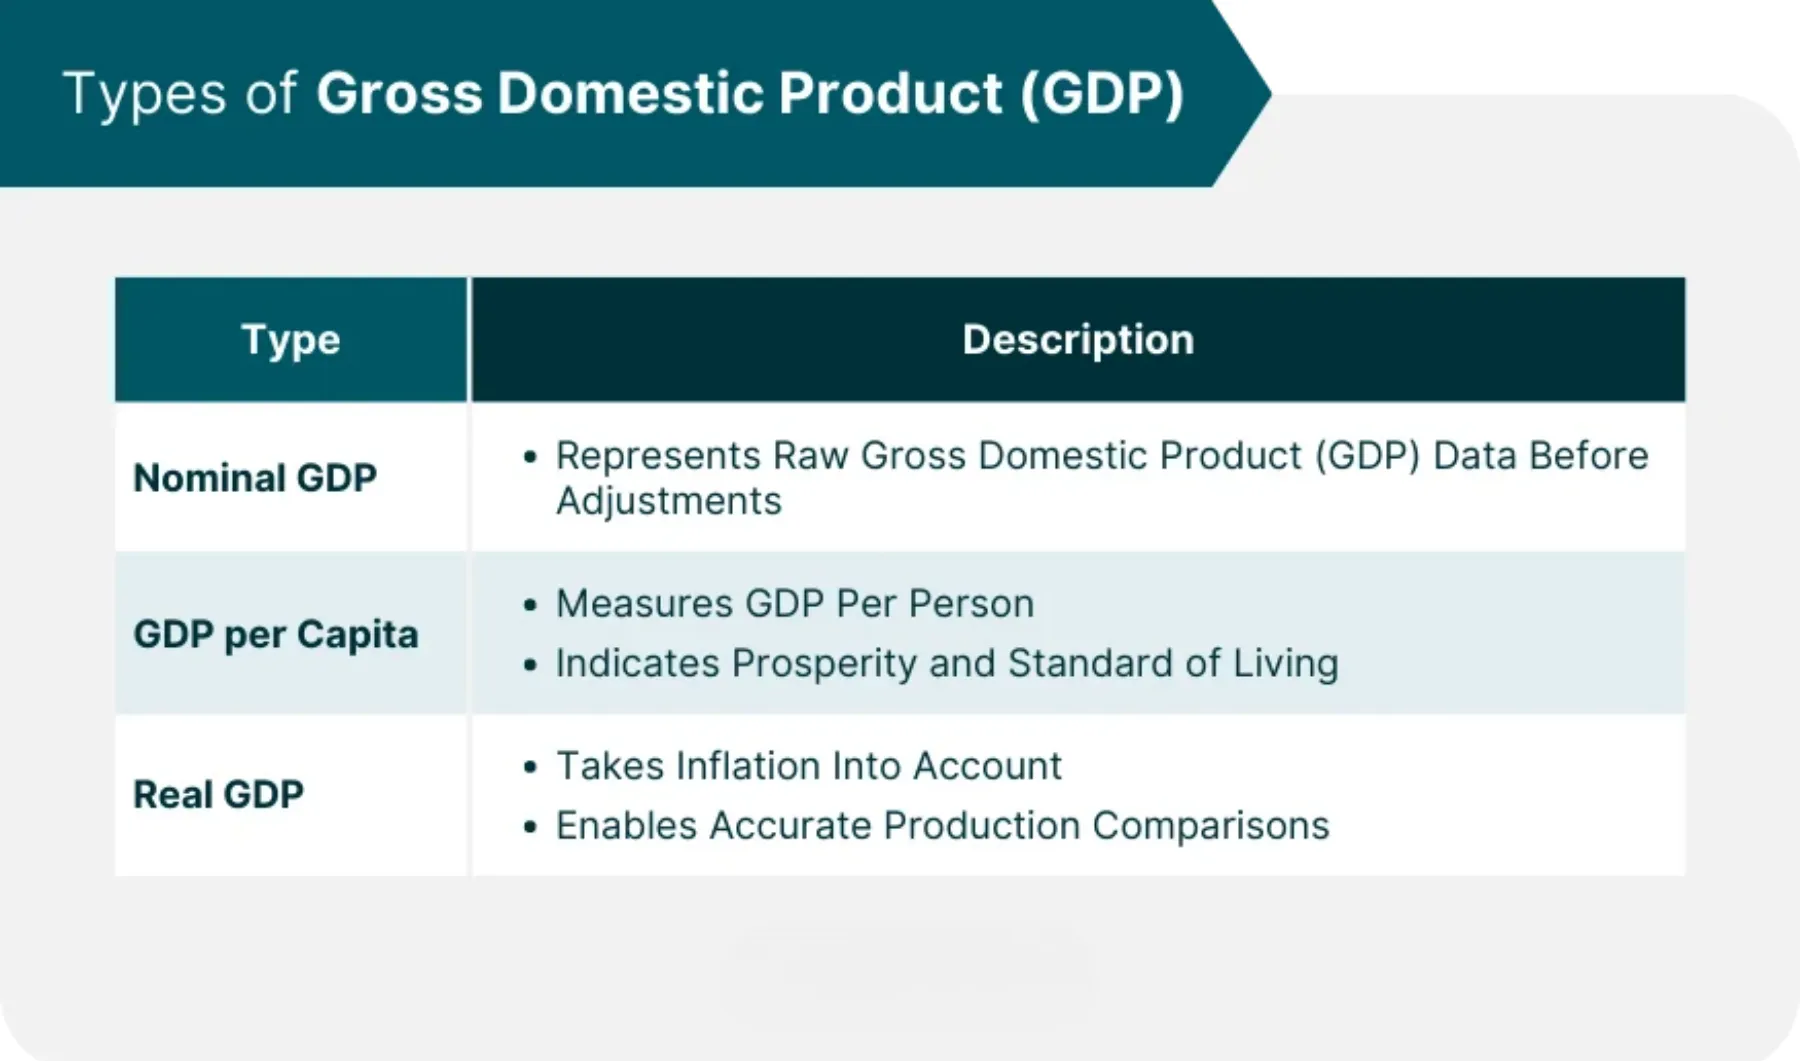
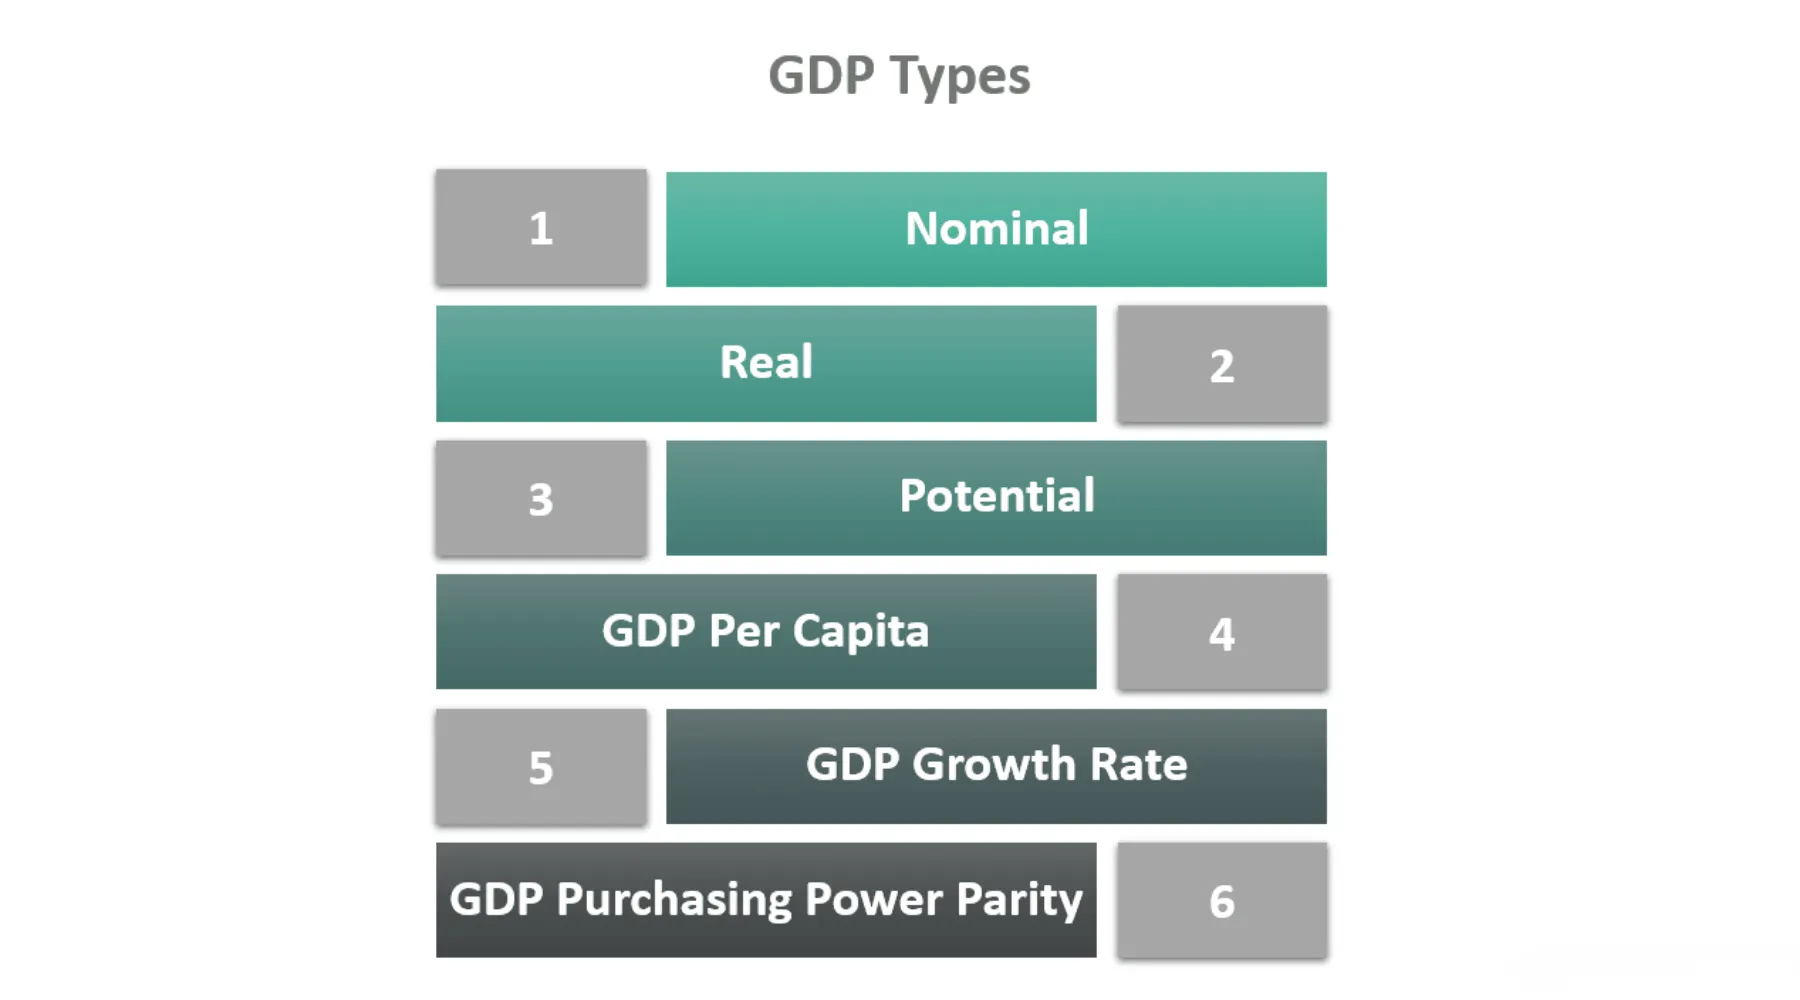
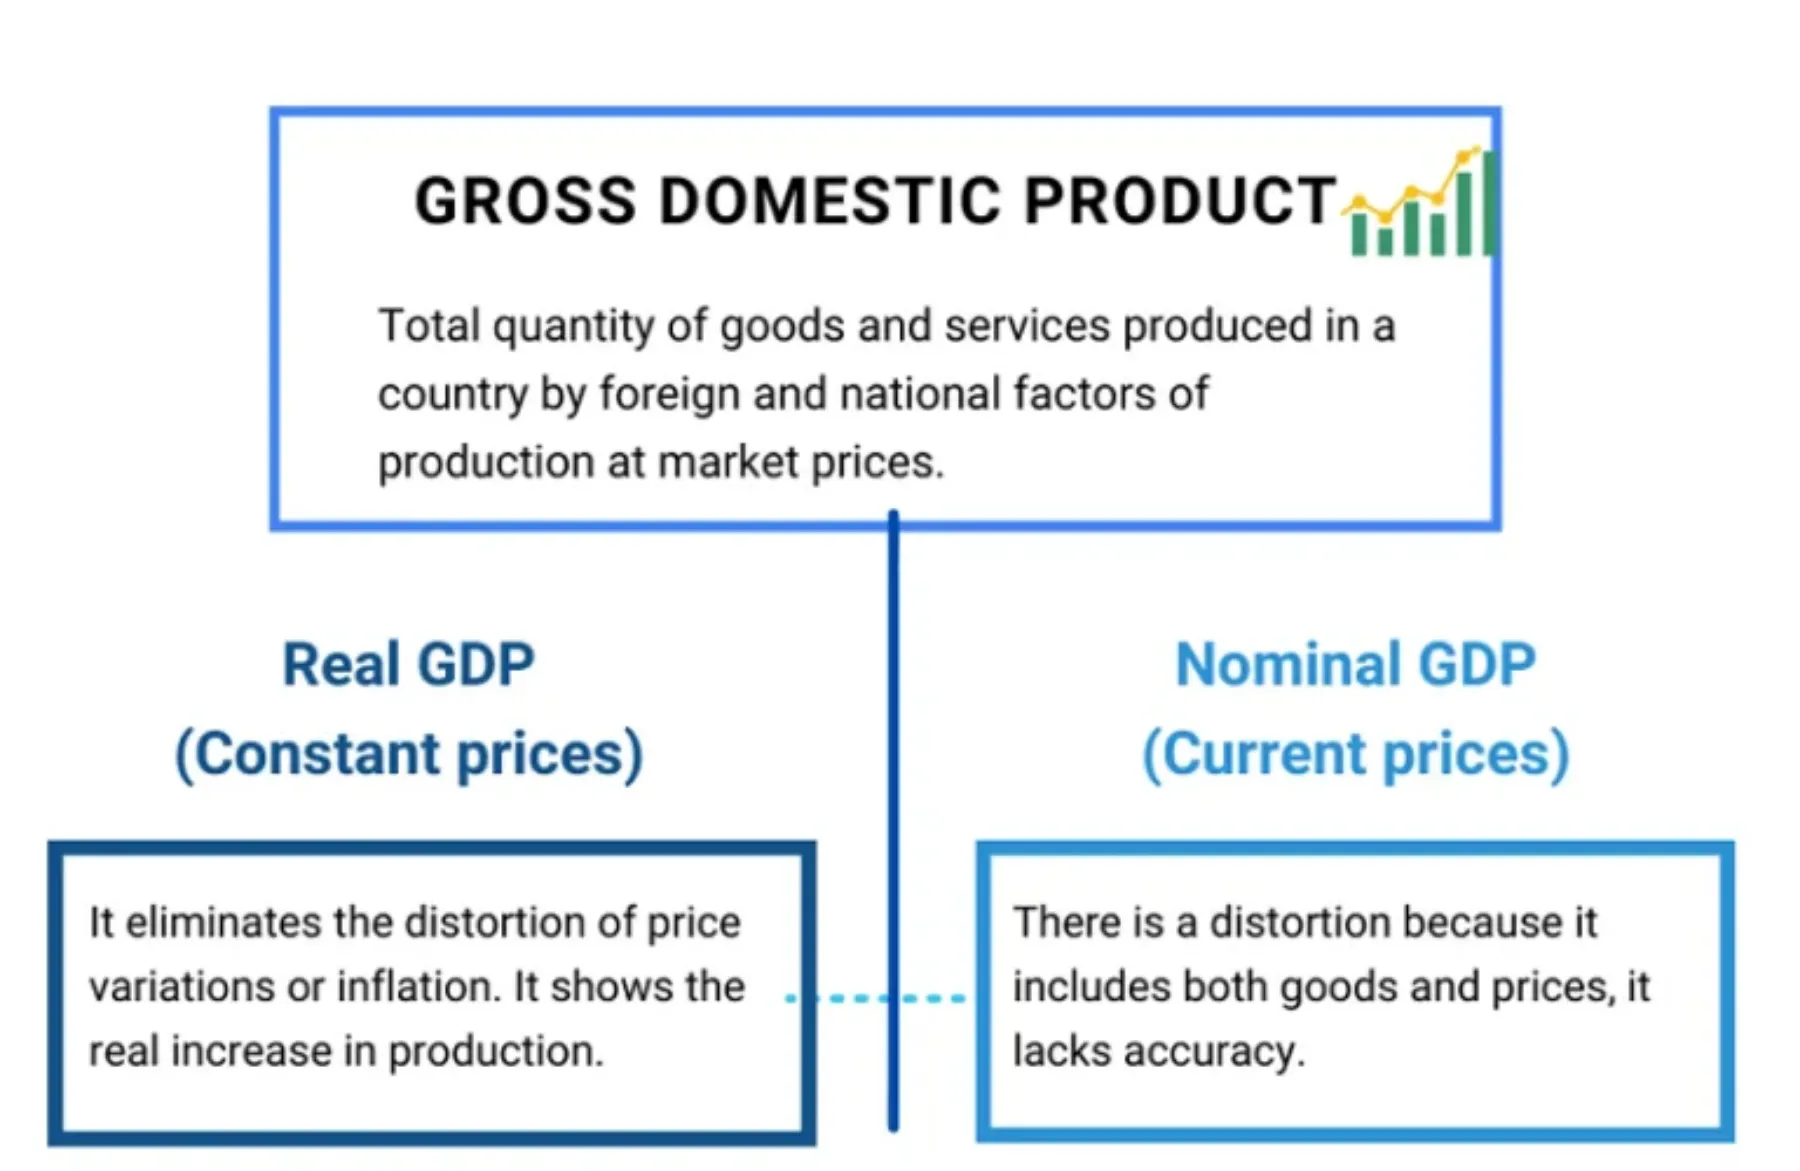
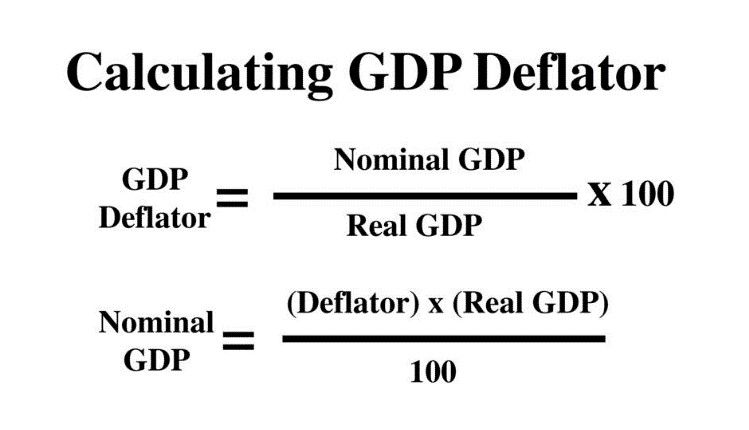
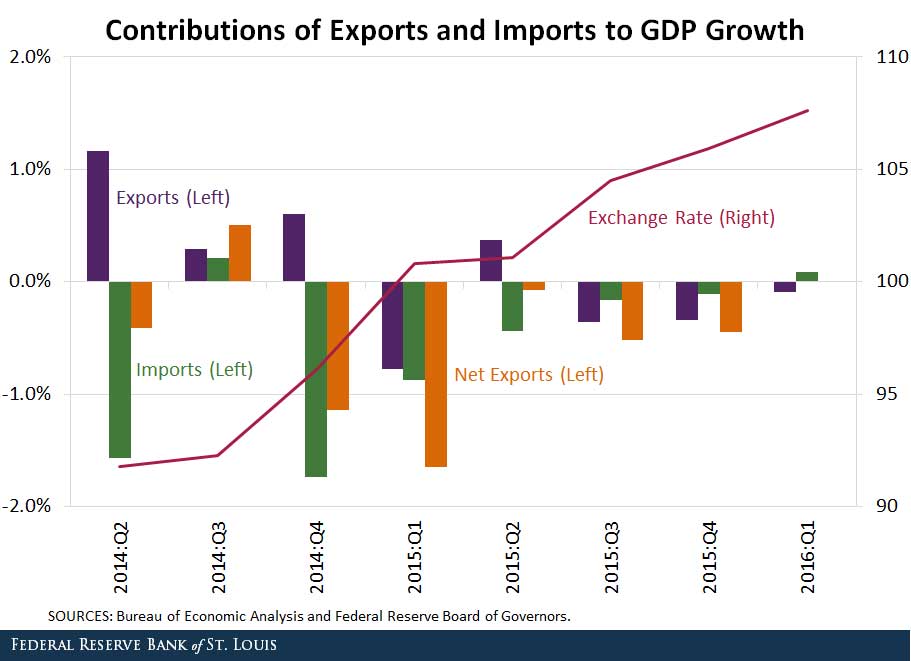
For forex traders, the distinction between Real GDP and Nominal GDP is fundamental, with Real GDP being the far more important figure. Nominal GDP measures a country’s economic output using current prices, without removing the effects of inflation. Because of this, Nominal GDP can increase simply because prices have risen, not because more goods and services were produced. In contrast, Real GDP is adjusted for inflation, providing a true measure of economic growth. It reflects the actual increase in the volume of goods and services produced. This distinction is critical because central banks, like the Federal Reserve, formulate monetary policy based on the health of the real economy. A strong Real GDP reading suggests a robust economy, which may lead a central bank to raise interest rates to prevent overheating, thereby strengthening the currency. A weak Real GDP figure signals economic slowdown, potentially leading to lower interest rates and a weaker currency. Therefore, traders focus almost exclusively on Real GDP for an accurate assessment of an economy’s performance and its implications for monetary policy.
How Does the GDP Report Compare to Other Major Economic Indicators?
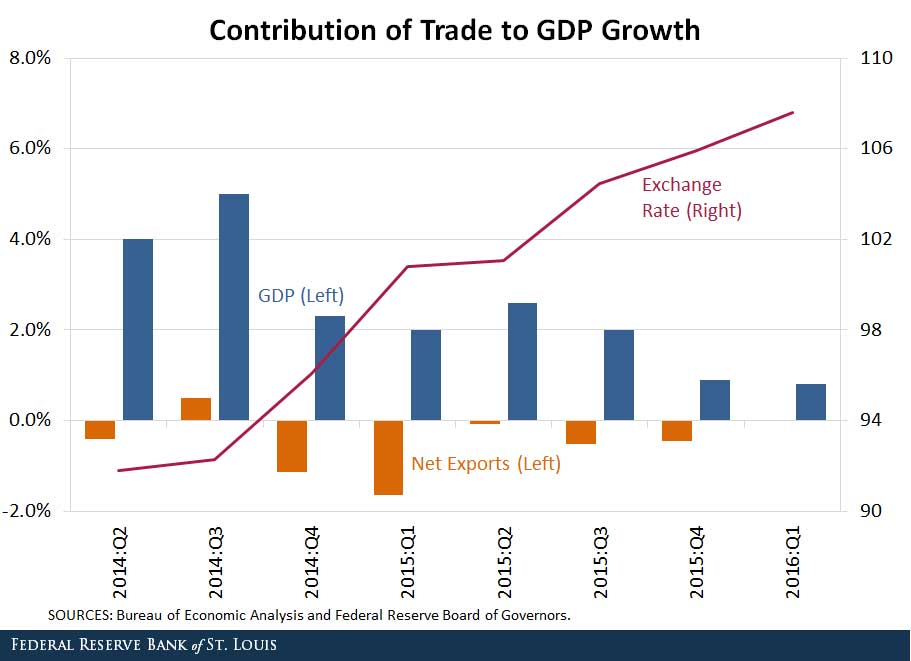
While the GDP report is a comprehensive measure of economic health, it differs from other key indicators in frequency, timing, and market impact. The Non-Farm Payrolls (NFP) report from the United States is released monthly and often causes more immediate and intense volatility than the quarterly GDP report. Because employment is a key mandate for the Federal Reserve, the NFP is watched extremely closely for its direct implications on interest rate policy. The Consumer Price Index (CPI) is another monthly report that measures inflation. In an environment where inflation is a primary concern for central banks, CPI releases can have a market impact equal to or even greater than GDP. It directly influences expectations for rate hikes or cuts. The Purchasing Managers’ Index (PMI) is a monthly survey that acts as a leading indicator of economic health. Traders watch PMI data closely because it often provides an early signal of where the economy is headed, helping them to forecast upcoming GDP figures. In short, while GDP provides the big picture, NFP, CPI, and PMI offer more frequent and forward-looking insights that often drive short-term market movements.
What Are the Main Risks of Trading Based on GDP Data?
Trading GDP data exposes traders to several significant risks that require careful management. The most immediate risk is extreme volatility, which occurs in the seconds and minutes following a release. This can lead to widened bid-ask spreads from brokers, making it more expensive to enter and exit trades. Another major risk is slippage, where an order is executed at a price different from the one requested due to rapid price changes. Slippage can turn a potentially profitable trade into a losing one. Furthermore, the initial GDP figure is an “advance” estimate and is subject to revisions in the following months. A positive initial report that boosts a currency could be revised lower later, causing a sharp reversal. Finally, a significant risk is that the market may have already priced in expectations. If the actual GDP figure comes in exactly as forecasted by analysts, there may be little to no market reaction, as the outcome was already reflected in the currency’s price. The largest price movements occur when there is a substantial surprise, either positive or negative, relative to the consensus forecast.
How Can You Use an Economic Calendar to Prepare for GDP Releases?
An economic calendar is an indispensable tool for preparing for GDP releases and managing risk. A trader can use a calendar from a source like Forex Factory or DailyFX to systematically plan their trading activity. First, you can filter the calendar to show only high-impact events for the currencies you are trading. This helps you identify the exact date and time of the upcoming GDP release, allowing you to avoid opening new positions right before the event or to prepare a specific news trading strategy. The calendar also provides crucial context by displaying three key figures: the Previous result, the Forecast (consensus estimate from economists), and the Actual number, which is populated the moment the data is released. The difference between the Actual and Forecast figures is what typically drives market volatility. For example, if the Actual GDP is much higher than the Forecast, the corresponding currency is likely to strengthen. By reviewing these figures and the historical data available on the calendar, you can build a clearer picture of potential market reactions and set your expectations accordingly.
