

Blog
What Essential Tools and Platforms Should Every Forex Trader Use in 2025?

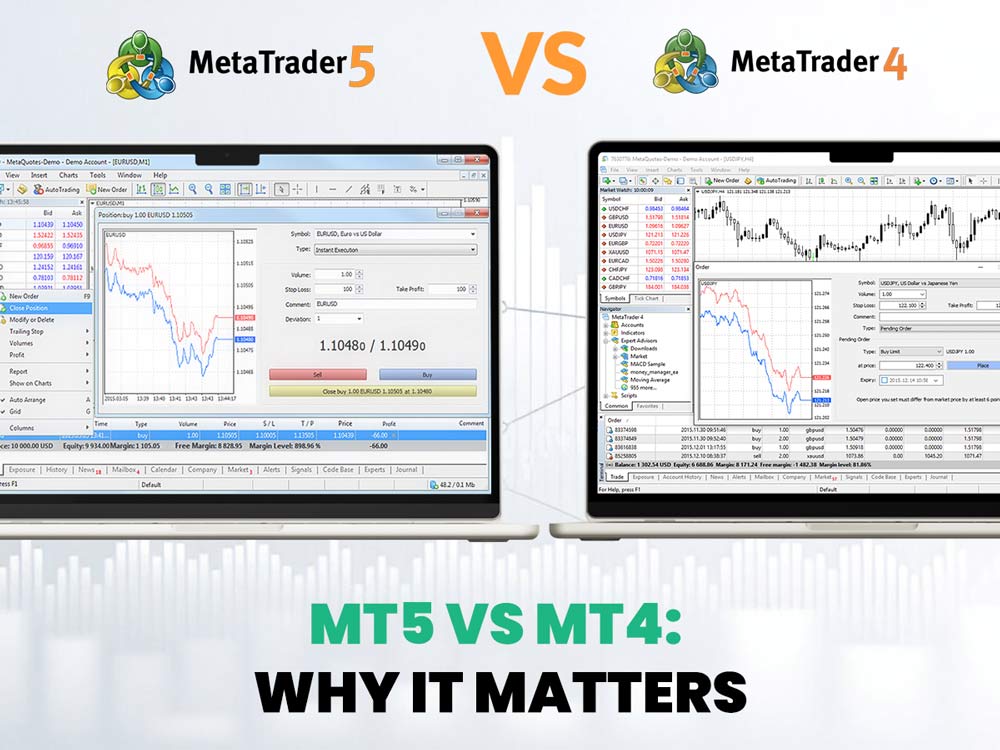
To trade forex effectively in 2025, every trader must use a combination of tools for analysis, execution, and management. The essential toolkit includes a charting platform like MetaTrader 5 or TradingView for technical analysis, a reliable economic calendar and news feed for fundamental analysis, a position size calculator for risk management, a trading journal like Myfxbook for performance tracking, and a well-regulated forex broker for trade execution. This collection of tools forms a complete ecosystem that supports every stage of the trading process, from finding opportunities to protecting capital and improving your strategy over time.
For most traders, the single most important tool is the charting and technical analysis platform. This is the primary interface where you will spend the majority of your time identifying patterns, analyzing price action, and making trading decisions. Platforms like TradingView or MetaTrader 5 provide the visual data and technical indicators necessary to build and test a trading strategy, making them the foundational layer upon which all other activities are built. Without a robust charting platform, a trader is essentially flying blind.
Many of these indispensable tools are available for free, while others offer premium features for a subscription. Most brokers provide the MetaTrader 4/5 platform at no cost, and high-quality economic calendars are also widely available for free. However, advanced charting capabilities on platforms like TradingView or access to institutional-grade, real-time news feeds typically require a monthly fee. A beginner can start effectively with free tools, but professional traders often invest in premium services for a competitive edge.
These tools do not operate in isolation; they form a cohesive system that supports a structured trading workflow. A trader uses an economic calendar to anticipate volatility, a charting platform to identify a specific trade setup, a position size calculator to determine the safe amount to risk, and a broker’s platform to execute the trade. Finally, every detail is logged in a trading journal to refine the process for the future.
What Are the Core Categories of Forex Trading Tools?
The core categories of forex trading tools are analysis, execution, and management, which cover market assessment, trade placement, and performance tracking. These three pillars represent the complete lifecycle of a trade, from initial idea generation to post-trade review. A successful trader understands that neglecting any one of these categories creates a significant weakness in their overall process. Each category serves a distinct purpose, yet they all work together to form a professional and disciplined approach to navigating the currency markets.
Let’s explore these categories in more detail.
First is analysis, which is the process of forecasting future price movements to identify trading opportunities. This category is further divided into two main sub-groups: technical analysis and fundamental analysis. Technical analysis tools are focused entirely on price charts. Traders use platforms like MetaTrader 5 or TradingView to study historical price action, identify chart patterns like head and shoulders or triangles, and apply mathematical indicators such as Moving Averages, the Relative Strength Index (RSI), or MACD. The goal is to find repeatable patterns and statistical edges based on how the market has behaved in the past. These platforms are the trader’s canvas, providing the visual information needed to formulate a hypothesis about where the price might go next.
Fundamental analysis, on the other hand, involves tools that track the underlying economic, social, and political forces that drive currency values. The most important tool here is an economic calendar, which schedules major data releases like interest rate decisions, inflation reports (CPI), and employment figures (NFP). These events cause significant market volatility, and the calendar helps traders prepare for it. Another critical tool is a real-time news feed, such as those from Reuters or Bloomberg. This provides instant updates on unscheduled events, like geopolitical tensions or surprise announcements from central bankers, which can cause sudden and dramatic price swings. By combining technical and fundamental analysis, traders gain a more holistic view of the market.
The second core category is execution. This refers to the actual act of placing a buy or sell order in the market. The primary tool for execution is your forex broker and the trading platform they provide. The broker serves as the gateway to the global forex market, providing the necessary liquidity to fill your orders. The quality of this tool is measured by factors like execution speed, spreads (the difference between the buy and sell price), and commissions. A slow or unreliable broker can lead to slippage, where your trade is executed at a worse price than intended, directly impacting your profitability. The trading platform itself, often MT4 or MT5, is the interface where you place orders, set stop-loss and take-profit levels, and monitor your open positions.
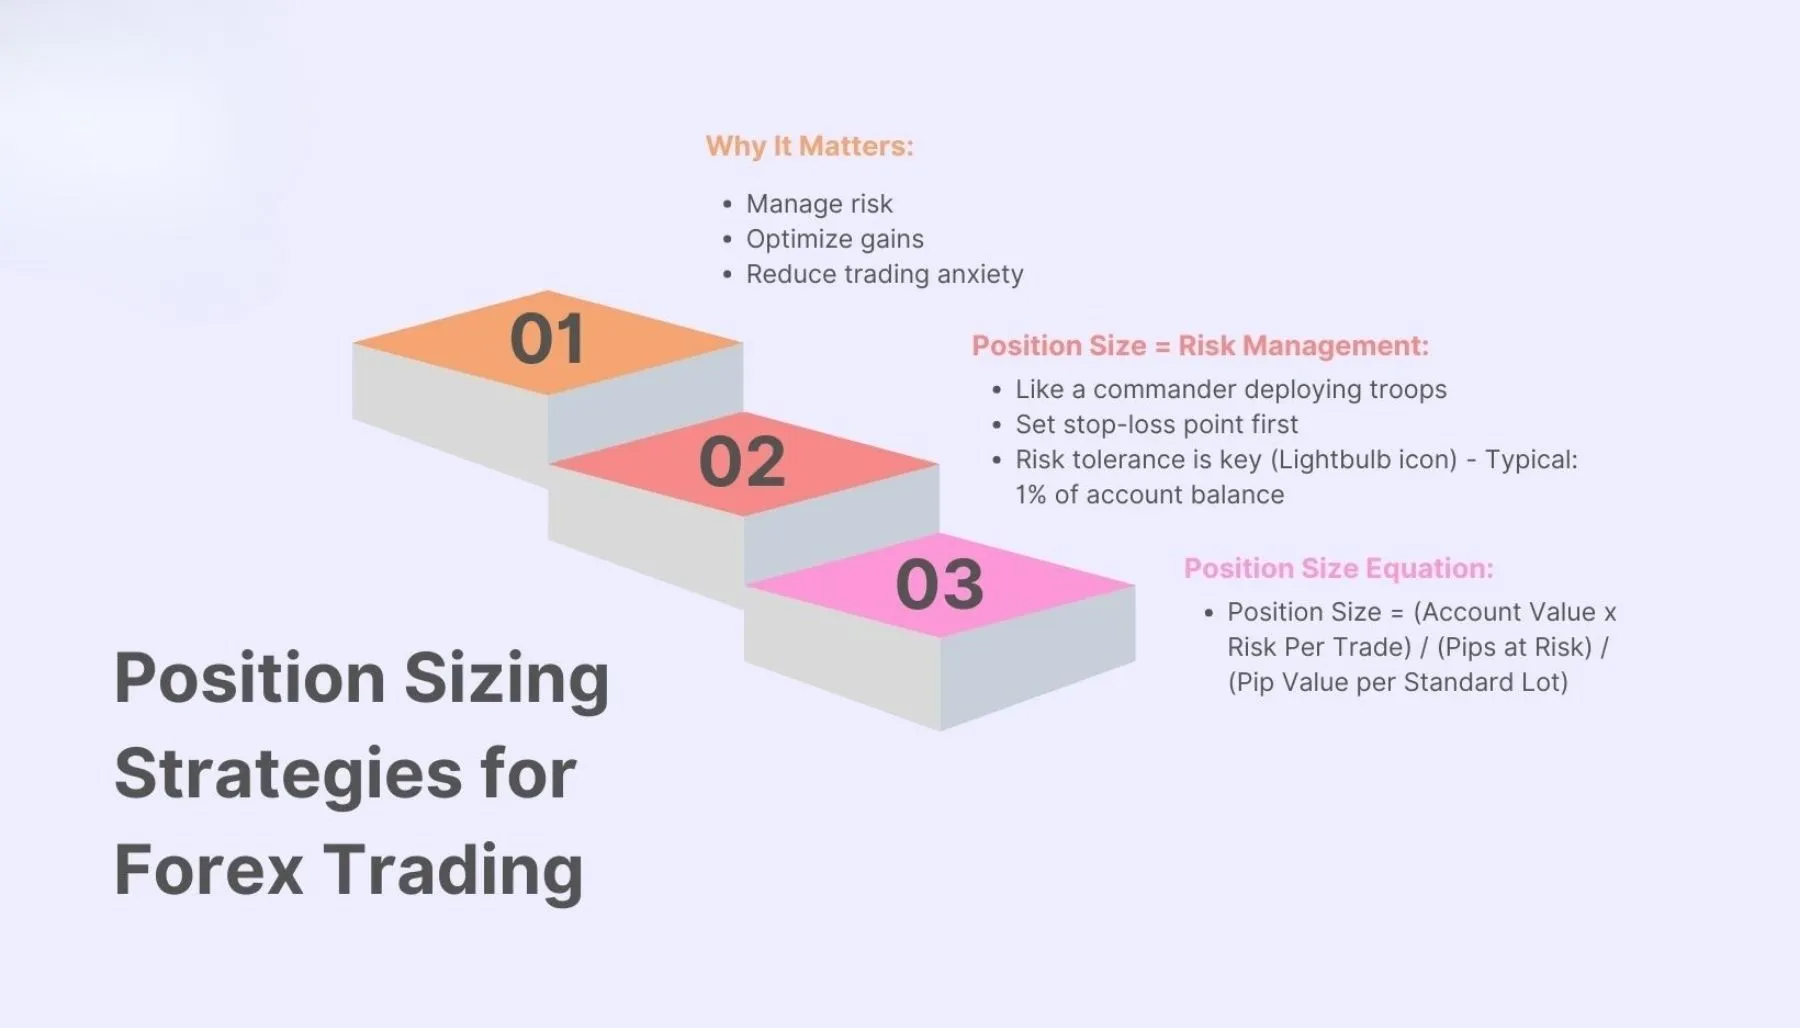
Finally, the third category is management. This encompasses everything a trader does to protect their capital and improve their skills over the long term. It is arguably the most important category for survival and long-term success. A key tool here is the position size calculator. This simple utility helps you determine the correct trade size for any given setup based on your account balance, how much you are willing to risk per trade (e.g., 1%), and your stop-loss distance. It enforces disciplined risk management and prevents you from making catastrophic, account-ending losses on a single bad trade. Another indispensable management tool is a trading journal. This can be a simple spreadsheet or dedicated software like Myfxbook or Tradervue. By logging every trade, including your reasons for entry, exit, and the emotional state at the time, you create a database of your performance. Analyzing this data helps you identify your strengths, weaknesses, and recurring mistakes, providing a clear roadmap for improvement.
What Are the Best Platforms for Charting and Technical Analysis?
The best and most widely used platforms for charting and technical analysis are MetaTrader 4/5 (MT4/MT5) and TradingView, each offering distinct advantages for different types of traders. Choosing between them often comes down to personal preference and specific needs, such as automated trading versus advanced charting and social collaboration. Both platforms provide the essential framework for analyzing price movements, applying indicators, and formulating trading strategies, making them the central hub for any technical trader.
Let’s explore what makes each one stand out.
What Is MetaTrader 4/5 (MT4/MT5)?
MetaTrader, particularly its latest version MetaTrader 5 (MT5), is the long-standing industry standard for forex trading platforms. It is a downloadable software application provided for free by the vast majority of retail forex brokers around the world. Its widespread adoption means that traders can switch brokers with minimal friction, as they do not need to learn a new platform. The core strength of MT4/5 lies in its robust functionality, reliability, and unparalleled support for automated trading.

One of its most significant features is the enormous library of custom indicators and trading tools. The platform uses its own programming language, MQL4/MQL5, and has a massive online community where developers and traders share thousands of custom-built indicators. If you can think of a specific analytical tool, it likely already exists for MetaTrader, either for free or for purchase on the MQL5 Marketplace. This extensibility allows traders to customize the platform far beyond its default capabilities.
Furthermore, MetaTrader is the undisputed leader for automated trading via Expert Advisors (EAs). EAs are programs that run directly on the platform to manage trades automatically based on a predefined set of rules. They can range from simple scripts that send you an alert when a certain condition is met to fully autonomous trading robots that execute and manage trades without any human intervention. This makes MT4/5 the platform of choice for algorithmic traders and those who want to backtest their strategies on historical data to verify their potential effectiveness. While its user interface may seem less modern than newer competitors, its performance, stability, and focus on automation have secured its place as a workhorse in the trading community.
What Is TradingView?
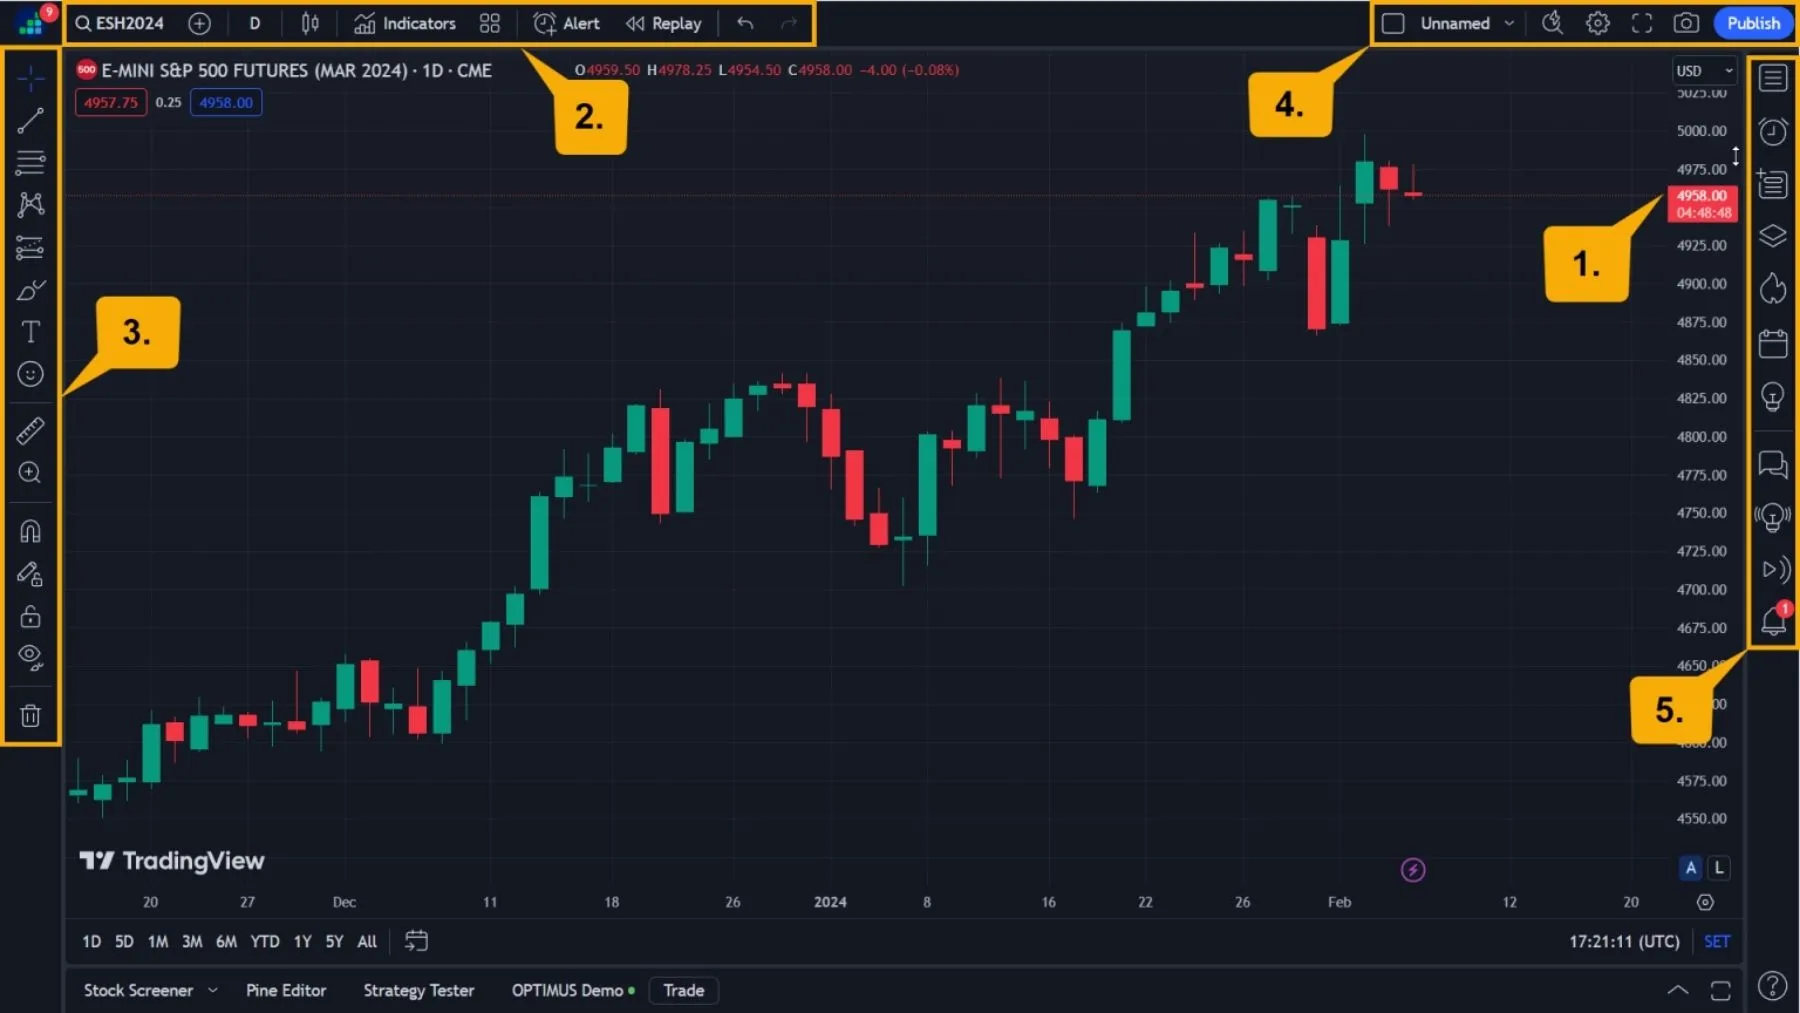
TradingView has emerged as a powerful, modern alternative to MetaTrader, beloved for its superior charting capabilities and collaborative features. Unlike MetaTrader, TradingView is primarily a web-based platform, meaning it runs directly in your browser on any operating system without requiring any software installation. This makes it incredibly accessible and convenient, as your charts, watchlists, and analysis are synced to your account across all devices. While many use TradingView for analysis and then execute on a separate broker platform, an increasing number of brokers are integrating with TradingView, allowing traders to place orders directly from its charts.

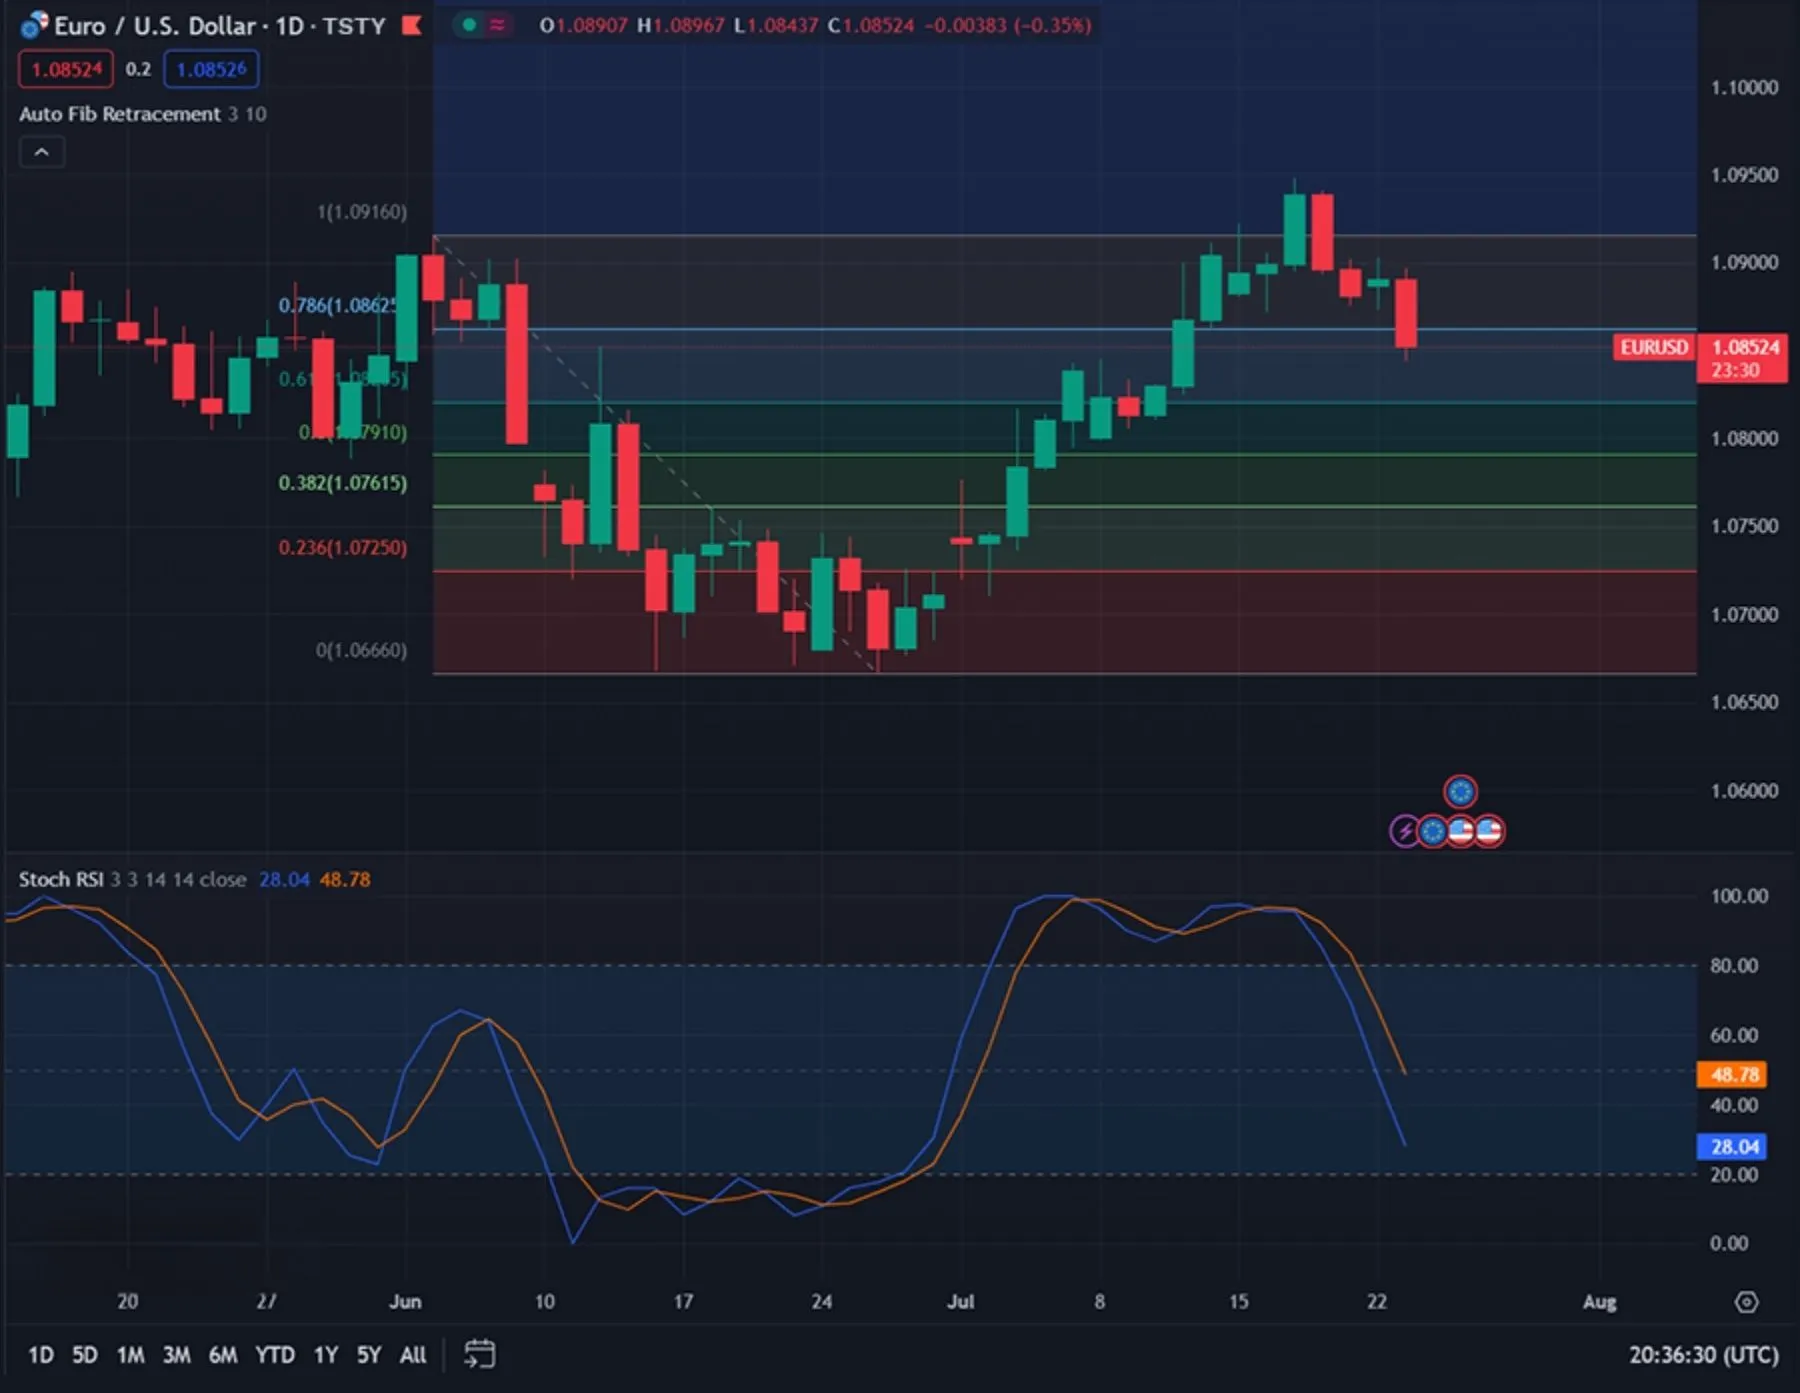
The platform’s main advantage is its best-in-class charting package. The charts on TradingView are incredibly smooth, intuitive, and highly customizable. It offers a wider array of drawing tools, chart types, and visualization options than almost any other platform available to retail traders. Its proprietary scripting language, Pine Script, is also considered easier to learn than MQL5, enabling traders to create their own custom indicators and strategies with relative ease.
Another unique aspect of TradingView is its social networking component. It functions like a social media platform for traders and investors. Users can publish their trade ideas and analysis directly onto a chart and share it with a community of millions. This creates a collaborative environment where you can learn from others, get feedback on your strategies, and stay on top of market sentiment. While the platform offers a capable free version, its most powerful features, such as using multiple charts in one layout, adding more than three indicators per chart, and accessing real-time data for certain markets, are reserved for its paid subscription tiers.
Which Tools Are Essential for Fundamental Analysis?
The most essential tools for fundamental analysis are a high-quality economic calendar to track scheduled events and a real-time news feed for breaking, unscheduled market-moving information. These tools provide the context behind currency price movements, helping traders understand the “why” that drives market volatility. While technical analysis focuses on chart patterns, fundamental analysis focuses on the underlying economic health and political stability of the countries whose currencies are being traded. Relying on one without the other can leave a trader exposed to unexpected risks.
Here’s the breakdown of why each is indispensable.
Why Is an Economic Calendar a Mandatory Tool for Traders?
An economic calendar is a mandatory tool because it serves as a schedule of future events that are known to inject high levels of volatility into the forex market. It lists upcoming macroeconomic data releases, central bank meetings, and other government announcements, allowing traders to anticipate when sharp price movements are most likely to occur. Without consulting a calendar, a trader might enter a position just moments before a major report like the U.S. Non-Farm Payrolls (NFP), only to see the market move violently against them, leading to a significant and avoidable loss.

Reputable economic calendars, like those found on websites such as Forex Factory, DailyFX, or Myfxbook, provide several key pieces of information for each event. These include the exact time and date of the release, the currency it will affect, and its potential market impact, which is often color-coded as low, medium, or high. For each data point, the calendar typically shows the previous result, the consensus forecast from economists, and then the actual figure once it is released. A significant deviation between the actual number and the forecast is what often triggers the strongest market reaction. For example, if inflation comes in much higher than expected, it might signal that the central bank will raise interest rates, causing that country’s currency to strengthen rapidly. By using the calendar, traders can plan their activity, choosing either to avoid trading during these high-impact releases or to develop specific strategies to trade the resulting volatility.
What Are the Most Reliable Forex News Feeds?
While an economic calendar covers scheduled events, a reliable news feed is crucial for reacting to unscheduled, market-moving events in real time. The most reliable sources are typically institutional-grade services like Reuters and the Bloomberg Terminal, though more accessible options for retail traders include specialized forex news sites like ForexLive or the newsfeeds built into professional trading platforms. The defining characteristics of a top-tier news feed are speed, accuracy, and expert context. In a market where prices can change in milliseconds, being the first to receive critical information provides a significant competitive advantage.
For instance, an unexpected geopolitical event, a natural disaster, or a surprise statement from a central bank governor will not appear on an economic calendar. This information is disseminated through news wires, and the fastest feeds can deliver headlines seconds or even minutes before they appear on mainstream news websites. This time gap is where professional traders often find their edge. Beyond just headlines, the best news services provide quick, insightful analysis from experienced market professionals. They help traders interpret the news and understand its potential implications for currency markets. A headline might state that a central bank is launching a new program, but the accompanying analysis will explain whether that action is bullish or bearish for the currency and why. This combination of speed and context is what makes a professional news feed an invaluable tool for any serious fundamental trader.
What Tools Help With Risk Management and Performance Tracking?
A position size calculator is fundamental for managing risk on every trade, while a trading journal is the primary tool for tracking and improving long-term performance. These two tools form the backbone of a professional trading operation, shifting the focus from simply trying to predict the market to managing capital and systematically refining one’s own trading behavior. Many traders fail not because their strategies are poor, but because they neglect the business-like discipline that these tools enforce. They are essential for ensuring both short-term survival and long-term, consistent profitability.
Let’s explore how these tools protect your capital and refine your strategy.
How Does a Position Size Calculator Protect Your Capital?
A position size calculator protects your capital by removing emotion and guesswork from risk management, ensuring that you risk a small, consistent percentage of your account on every single trade. It is a simple tool, often available online or as a plugin for your trading platform, that calculates the appropriate trade size (measured in lots) based on three key inputs: your account balance, your predetermined risk percentage per trade, and your stop-loss distance in pips. By standardizing your risk, you make sure that no single trade can cause catastrophic damage to your account.
For example, imagine you have a $10,000 account and decide you will risk no more than 1% of your capital on any trade, which amounts to $100. You identify a trade setup on EUR/USD and determine that your stop-loss needs to be 50 pips away from your entry price. Instead of guessing how many lots to trade, you input these values into the calculator. It will instantly tell you the precise position size that ensures if your 50-pip stop-loss is hit, your total loss will be exactly $100. This systematic approach prevents the common emotional mistake of placing an oversized trade after a big win (overconfidence) or a big loss (revenge trading). It is the single most effective technique for preserving capital, which is the number one job of any trader.
Why Is a Trading Journal Necessary for Improvement?
A trading journal is necessary for improvement because it provides the objective data needed to analyze your performance, identify recurring mistakes, and discover what parts of your strategy are actually working. Without a journal, a trader relies on memory, which is often biased by the most recent winning or losing trades. A journal acts as a detailed logbook of your trading business, forcing you to confront the reality of your results. This can be as simple as an Excel spreadsheet or as sophisticated as dedicated journaling software like Myfxbook, Tradervue, or Edgewonk.
The process involves recording key details for every trade: the date, the currency pair, the strategy used, the reason for entry, the profit or loss, and, importantly, your psychological state during the trade. Over time, this data reveals powerful insights. You might discover that you are highly profitable trading London session breakouts but consistently lose money trying to trade the Asian session. Or you may find that all your biggest losses occur when you break your rule of not moving your stop-loss. Advanced journaling platforms can automatically import your trade history from your broker and generate detailed performance analytics, such as your win rate, profit factor, and average risk-to-reward ratio. By reviewing this data regularly, you can make informed, data-driven adjustments to your trading plan, transforming trading from a guessing game into a process of continuous, measurable improvement.
How Does a Forex Broker Function as a Core Trading Tool?
A forex broker acts as a core trading tool by providing the essential market access, liquidity, and execution platform needed to place and manage trades in the currency market. A trader cannot participate in the forex market without a broker, making the choice of broker one of the most foundational decisions in a trading career. Far from being just a passive intermediary, the broker is an active component of your trading system. The quality, reliability, and cost structure of your broker directly influence your trading outcomes, potentially being the difference between profitability and loss.
Specifically, the quality of your broker directly impacts your trading costs and reliability. A broker with high-quality technology and deep liquidity pools can offer faster execution speeds and tighter spreads, which are the primary costs of trading. Every pip paid in spread is a pip that reduces your potential profit. For active traders, these costs can accumulate quickly. Therefore, viewing your broker not just as a service provider but as a critical piece of your trading equipment is essential for building a sustainable trading business. Choosing the right one is akin to a race car driver choosing the right engine, it is fundamental to performance.
What Features Define a High-Quality Forex Broker?
A high-quality forex broker is defined by a combination of strong regulation, competitive trading costs, reliable execution, and stable platform performance. These features work together to create a secure and efficient trading environment, allowing you to focus on your strategy rather than worrying about the safety of your funds or the reliability of your order placement. When evaluating a broker, traders should look for evidence of excellence across all these key areas.

The most important feature is tight regulation. A top-tier broker is licensed and overseen by a reputable financial authority, such as the Financial Conduct Authority (FCA) in the United Kingdom, the Australian Securities and Investments Commission (ASIC), or the Cyprus Securities and Exchange Commission (CySEC). Regulation ensures that the broker adheres to strict standards, including segregating client funds from company funds, which protects your money in the event the brokerage becomes insolvent.
Second, a good broker offers low spreads and commissions. The spread is the difference between the buy and sell price of a currency pair and represents a built-in transaction cost. Commissions are a separate fee charged on a per-trade basis, common with ECN (Electronic Communication Network) style accounts. A high-quality broker will offer consistently tight spreads, especially on major pairs, minimizing your trading costs and improving your bottom line.
Third, fast and reliable execution speeds are critical. When you click to buy or sell, you want your order filled at the price you see or very close to it. Brokers with poor technology or insufficient liquidity can cause slippage, where your order is filled at a worse price, or requotes, where the platform asks you to accept a new price before executing. This is particularly damaging during volatile market conditions.
Finally, platform stability is non-negotiable. Your broker’s servers must be robust to prevent the trading platform from freezing or disconnecting, especially during high-impact news events when you need to manage your positions most actively. Paired with this is the need for responsive and knowledgeable customer support that can quickly resolve any technical or account-related issues that may arise.
What Advanced and Specialized Tools Can Enhance Trading Performance?
Advanced tools like Virtual Private Servers, correlation matrices, and backtesting software provide specialized data and automation capabilities that can give serious traders a competitive edge. Furthermore, these platforms move beyond standard technical analysis to address critical aspects of trading such as risk management, strategy validation, and execution reliability, which are often overlooked by beginners. For traders looking to transition from a hobby to a professional endeavor, mastering these specialized instruments is a logical next step. They help quantify performance, manage portfolio-wide risk, and operate with greater consistency.
What Is the Difference Between Free and Paid Trading Tools?
The primary difference between free and paid trading tools lies in their depth, customization, and reliability. Free tools, like the standard indicators included with MetaTrader 4 or the basic charting features on a broker’s platform, are excellent for learning and executing simple strategies. They provide fundamental capabilities like moving averages, RSI, and basic drawing tools. However, they often come with limitations, such as restricted data history, a limited number of indicators per chart, or delayed data feeds.

Paid tools offer advanced functionalities that cater to specific, sophisticated needs. A subscription to TradingView Pro, for example, unlocks multiple chart layouts, server-side alerts, and access to a vast library of custom community-built indicators. Similarly, a professionally coded Expert Advisor (EA) offers complex automation logic that free versions cannot match. An upgrade is justified when a trader’s strategy requires capabilities beyond what free tools provide.
- If your strategy depends on running 24/7 without interruption, a paid Virtual Private Server (VPS) is necessary.
- If you need to test a complex strategy against years of high-quality tick data, premium backtesting software is superior to the limited testers on free platforms.
- If you rely on specific non-standard indicators or require real-time news feeds for your decisions, a paid subscription is often the only option.
How Should Your Trading Style Influence Your Choice of Tools?
Your trading style is the single most important factor in determining your ideal toolset, as different approaches demand completely different resources. A scalper, who aims to profit from tiny price movements over very short timeframes, prioritizes speed and precision above all else. Their toolkit must facilitate near-instantaneous execution and analysis.
A scalper’s setup would likely include:
- A low-latency Virtual Private Server (VPS) to minimize the physical distance to the broker’s servers, reducing slippage.
- One-click trading panels or plugins for platforms like MT4 to enter and exit trades without delay.
- Tick charts or very short timeframes (e.g., M1) to analyze immediate price action, combined with Level 2 data to see order flow.
In contrast, a swing trader, who holds positions for several days or weeks to capture larger market moves, requires tools focused on broader analysis and patience. Execution speed is less of a concern than the quality of their long-term analytical insights.
A swing trader’s setup would feature:
- Advanced charting platforms like TradingView for multi-day analysis, pattern recognition, and long-term trend lines.
- A high-quality economic calendar, such as the one from Forex Factory, to track major fundamental events that could impact their positions.
- Fundamental analysis resources and sentiment tools, like the Commitment of Traders (COT) report, to gauge long-term market direction.
What Is a Virtual Private Server (VPS) and Who Needs One?
A Virtual Private Server, or VPS, is a remote, private server that runs its own copy of an operating system, allowing users to install software and maintain a constant internet connection. In forex trading, a VPS is used to host a trading platform like MetaTrader 4 or 5, ensuring it runs 24 hours a day, seven days a week, completely independent of the trader’s personal computer. This means your platform stays online and active even if you experience a power outage, internet disconnection, or computer shutdown at home.
The primary users of a VPS are traders who require uninterrupted platform operation. The need for a VPS becomes clear in specific scenarios.
- Traders using automated strategies: Anyone running an Expert Advisor (EA) or a trading robot must use a VPS. These automated systems need to analyze the market and execute trades at any time, day or night, and cannot afford to go offline.
- Traders with unstable connections: If your home internet or power supply is unreliable, a VPS provides a stable, professional-grade environment to prevent missed trades or failures in managing open positions.
- Traders seeking lower latency: By choosing a VPS located in the same data center as their broker’s servers (often in London or New York), traders can reduce execution delay, known as latency, which is especially beneficial for scalping strategies.
What Is a Forex Correlation Matrix?
A forex correlation matrix is a powerful analytical tool that displays the degree to which different currency pairs move in relation to one another. It presents this relationship as a coefficient value ranging from -1 to +1. A value of +1 indicates a perfect positive correlation, meaning the two pairs move in the same direction. A value of -1 indicates a perfect negative correlation, meaning they move in opposite directions. A value of 0 suggests no discernible relationship. For example, EUR/USD and GBP/USD often have a high positive correlation because both economies are closely tied.

This information is invaluable for sophisticated risk management and strategy diversification. Understanding these relationships helps traders avoid common pitfalls and identify unique opportunities.
- Managing Exposure: A trader might think they are diversifying by opening long positions on both AUD/USD and NZD/USD. However, because these pairs are highly correlated, they have effectively doubled their exposure to a single market factor rather than spreading risk.
- Identifying Hedging Opportunities: If a trader is long on EUR/USD but fears a short-term downturn, they could open a smaller long position on a negatively correlated pair like USD/CHF to offset potential losses.
- Confirming Trade Signals: If a buy signal appears on EUR/USD, a trader can check the correlation matrix. Seeing a similar bullish pattern on a positively correlated pair like GBP/USD adds confidence to the trade idea.
What Are Forex Sentiment Analysis Tools?
Forex sentiment analysis tools are instruments designed to measure the overall mood and positioning of market participants. Instead of focusing on price charts or economic data, these tools analyze how many traders are long versus short on a particular currency pair. This provides insight into market psychology and can reveal when a currency is becoming overly popular or “crowded,” often signaling a potential reversal. The goal is to understand what the collective market is thinking and doing.

There are several common sources for sentiment data that traders can use.
- The Commitment of Traders (COT) Report: Published weekly by the U.S. Commodity Futures Trading Commission (CFTC), this report details the positions of large institutional traders, commercial hedgers, and speculators in the futures market, offering a glimpse into what the “smart money” is doing.
- Retail Broker Sentiment Data: Many retail brokers, including OANDA and IG, provide data showing the percentage of their clients holding long or short positions on various pairs.
- News and Social Media Sentiment: Some advanced platforms use algorithms to scan news articles and social media posts to gauge the general tone (bullish or bearish) surrounding a currency.
These tools are often used for contrarian analysis. The theory suggests that retail traders are often wrong at major market turning points. If 90% of retail clients are long EUR/USD, a contrarian trader might see this as a signal that the pair is overbought and look for opportunities to sell.
Is Backtesting Software a Worthwhile Investment?
Backtesting software is an exceptionally worthwhile investment for any trader serious about developing a consistent, rule-based strategy. This software, such as Forex Tester or the advanced Strategy Tester in MetaTrader 5, allows you to simulate your trading strategy against historical price data. It recreates past market conditions with a high degree of accuracy, enabling you to see exactly how your strategy would have performed over months or even years. This process moves a trading idea from a theoretical concept to a statistically validated system.
The benefits of using dedicated backtesting software are extensive and directly contribute to better trading performance. Without it, a trader is essentially testing their ideas with live money, which can be a slow and expensive process.
- Objective Strategy Validation: Backtesting provides hard data on your strategy’s viability, including key metrics like total profit, maximum drawdown, profit factor, and win rate. This objective feedback removes emotion and guesswork from strategy development.
- Risk-Free Optimization: You can experiment with different parameters, such as stop-loss placement, position sizing, or indicator settings, to refine your system without risking a single dollar.
- Accelerated Learning: A trader can manually backtest months of historical data in just a few hours. This rapid exposure to various market conditions helps build chart reading skills and confidence in a strategy’s signals much faster than live trading alone.