

Blog
What Are the Key Seasonal Trends in the Forex Market and How Can You Trade Them?

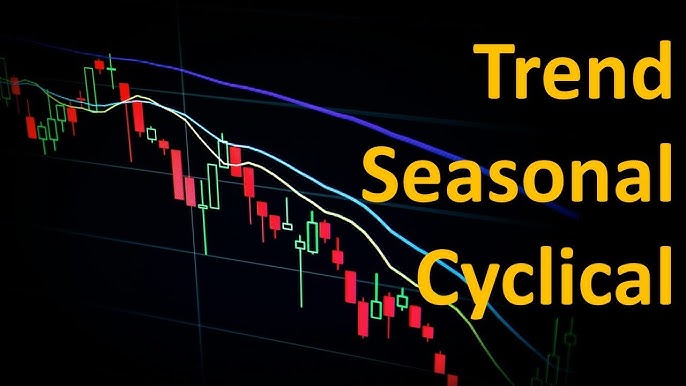
The key seasonal trends in the forex market are predictable patterns that recur at specific times of the year, including the low-volatility “summer doldrums,” a potential “year-end rally” in the fourth quarter, and quarterly currency flows linked to corporate repatriation. You can trade these trends by first identifying a historical seasonal bias for a currency pair and then waiting for confirmation from technical indicators like moving averages or momentum oscillators before entering a position. This approach combines statistical probability with real-time price action to create a more robust trading strategy.
The most common seasonal patterns include a noticeable slowdown in liquidity and volatility during the Northern Hemisphere’s summer months of July and August, a potential increase in activity and directional moves in the fourth quarter, and currency strength linked to corporate fund flows at the end of each financial quarter. These phenomena are not random. They are driven by consistent human behavior, such as institutional traders taking holidays, fund managers rebalancing portfolios before year-end, and multinational corporations moving money across borders for accounting purposes.
To effectively trade these patterns, you can develop a strategy that combines historical seasonal tendencies with real-time technical confirmation using tools like moving averages or the Relative Strength Index (RSI). A seasonal chart might suggest a currency is historically strong in April, but you would only consider a trade if the current price is also showing bullish momentum on your trading chart. This method prevents you from trading based on history alone and ensures the current market conditions align with the seasonal expectation.
Understanding these tendencies provides you with a unique analytical edge, offering a high-level market forecast or bias. While seasonal patterns are not guaranteed to repeat every year, they represent powerful statistical probabilities that can inform your trading decisions, improve your timing, and help you anticipate potential shifts in market sentiment before they become obvious to everyone else.
What is Seasonality in the Forex Market?
Forex seasonality is a category of predictable, recurring price patterns that appear at specific times of the calendar year, originating from consistent behavioral and economic activities. To understand this better, think of it as the market’s internal clock. Just as seasons in nature bring predictable changes in weather, seasons in the forex market bring predictable shifts in volatility, liquidity, and even directional bias. These patterns are not caused by long-term economic fundamentals like interest rate cycles or short-term news events like an employment report. Instead, they are the result of consistent, calendar-driven human and corporate behavior that repeats year after year. For example, trading activity often quiets down during the summer holidays, and certain currencies may see increased demand at the end of a fiscal quarter. This rhythm is what we call seasonality. It is a statistical tendency observed over many years, giving traders a potential roadmap of what to expect during different months or quarters.
Is Forex Seasonality Different from Cyclical Trends?
A common point of confusion is the difference between seasonality and broader cyclical trends. While both involve patterns, they operate on different timelines and are driven by different forces. The key distinction is the calendar. Seasonal trends are tied directly to specific, fixed periods of the calendar year, such as a particular month, quarter, or holiday period. For example, the tendency for the Japanese Yen to strengthen ahead of the Japanese fiscal year-end in March is a seasonal pattern because it happens at the same time every year.

On the other hand, cyclical trends are tied to economic or business cycles that have variable and unpredictable lengths. A business cycle includes phases like expansion, peak, contraction, and trough, but these phases do not last for a fixed number of months or years. A currency might strengthen during a multi-year economic expansion and weaken during a recession. This is a cyclical trend, not a seasonal one, because you cannot mark on your calendar exactly when it will begin or end. In short, if a pattern is linked to a date (like December), it’s seasonal. If it’s linked to an economic phase (like a recession), it’s cyclical.
Are Seasonal Patterns Guaranteed to Occur?
It is absolutely essential to understand that seasonal patterns represent a statistical tendency or probability, not a certainty. History does not repeat itself perfectly, and forex markets are influenced by countless factors. Think of seasonality as a tailwind or a headwind, not a guaranteed destination. A strong seasonal tendency for a currency to rise in a particular month increases the probability of that outcome, but it does not promise it.
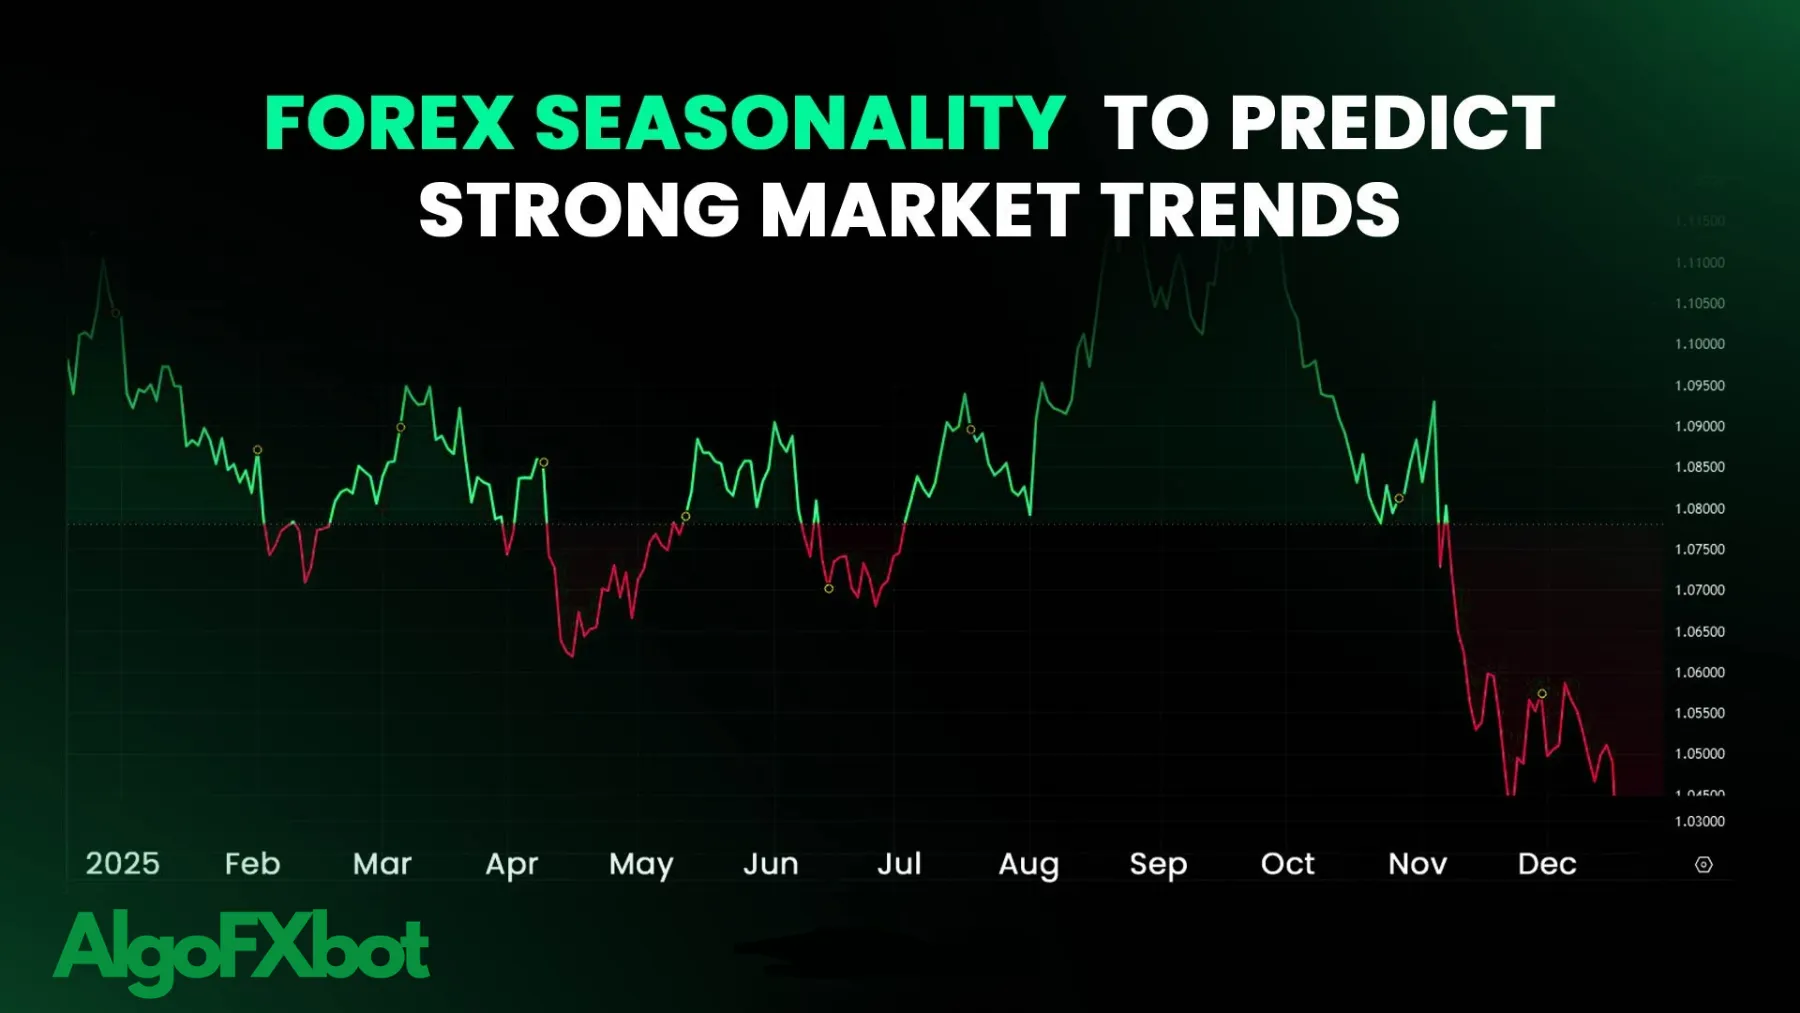
Other powerful market forces can easily override or completely negate a seasonal pattern. A surprise interest rate hike from a central bank, a major geopolitical event, or a sudden shift in global risk sentiment can all cause a currency pair to move in the opposite direction of its historical seasonal trend. For this reason, traders should never base a decision solely on seasonality. Instead, it should be used as one component of a comprehensive trading plan. For example, if a currency pair has a strong seasonal tendency to rally in October, you would look for other technical or fundamental factors to confirm that strength before risking any capital. It’s a tool for adding confluence, not a crystal ball.
What are the Most Common Seasonal Forex Patterns?
The three most common seasonal forex patterns are the “Summer Doldrums,” the “Year-End Rally,” and “Quarterly Repatriation,” each based on specific calendar periods and institutional behaviors. These patterns are well-known among professional traders because they reflect the structural rhythm of the global financial system. They are not random occurrences but are instead tied to predictable events like holiday schedules, corporate accounting deadlines, and institutional portfolio management cycles. Understanding these key patterns can help you anticipate shifts in market conditions throughout the year. For instance, knowing that volatility might dry up in August could prevent you from getting stuck in choppy, directionless markets. Similarly, being aware of potential year-end moves can help you position yourself for emerging trends. Let’s explore each of these common phenomena in more detail.
What is the “Summer Doldrums” Effect in Forex Trading?
The “Summer Doldrums” refers to the typical decrease in liquidity and trading volume that occurs during the Northern Hemisphere’s summer months, primarily July and August. This slowdown happens for a simple reason: many institutional traders, fund managers, and corporate treasurers in major financial hubs like London and New York go on holiday. With fewer large players actively participating in the market, the overall trading volume shrinks.
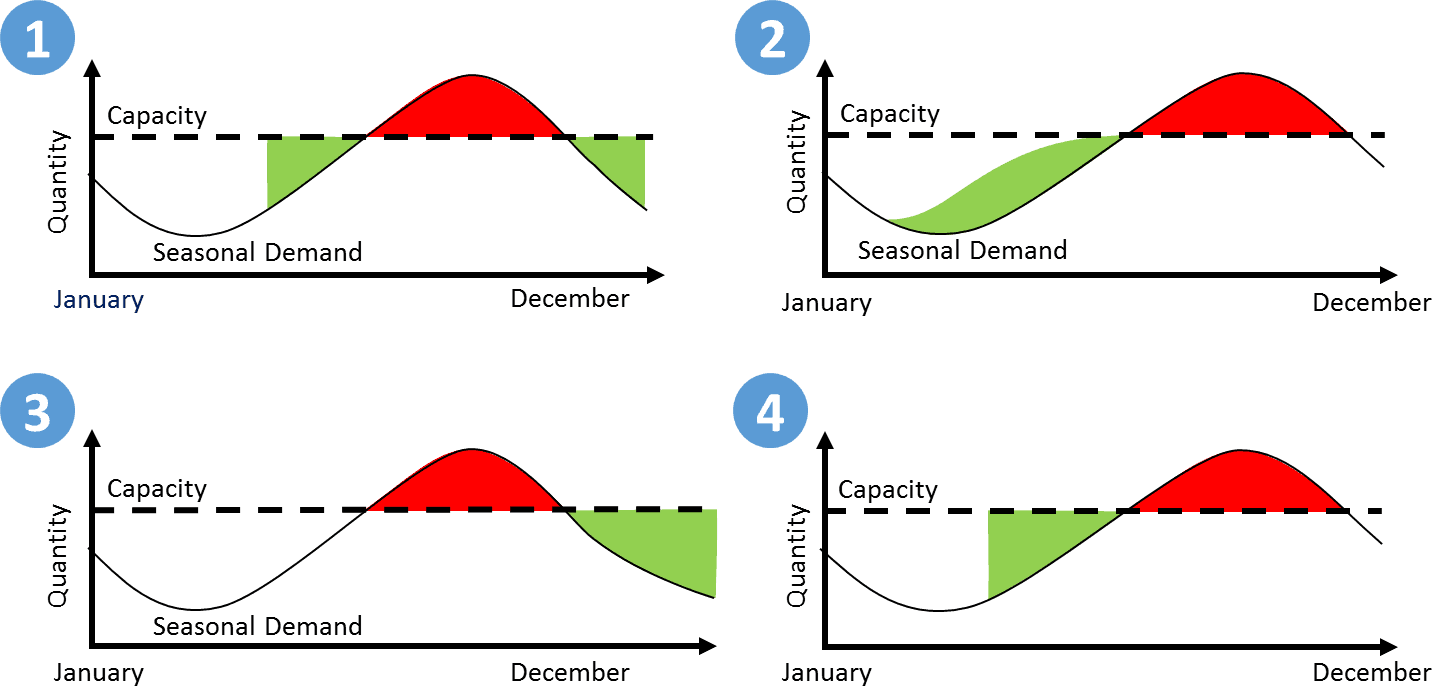
This has two main effects on the market. First, with lower liquidity, price action can become choppy and erratic, often trading within a narrow range without a clear directional trend. It can be a frustrating time for trend-following traders. Second, the thin liquidity can paradoxically lead to moments of sharp, sudden volatility. If a significant news event occurs or a large order hits the market, the lack of opposing volume can cause an exaggerated price swing. Traders should be cautious during this period, perhaps by reducing their position sizes or focusing on range-trading strategies rather than expecting strong, sustained trends.
Is there a “Year-End Rally” for Certain Currencies?
The final quarter of the year, from October to December, often brings a notable increase in volatility and the potential for strong directional moves, sometimes referred to as a “year-end rally” or “Santa Claus rally” in equity markets, which can spill over into forex. This increased activity is driven by several factors. First, institutional investors and hedge funds often rebalance their portfolios as the year concludes. They may lock in profits, cut losses, or position themselves for the year ahead, leading to large capital flows.
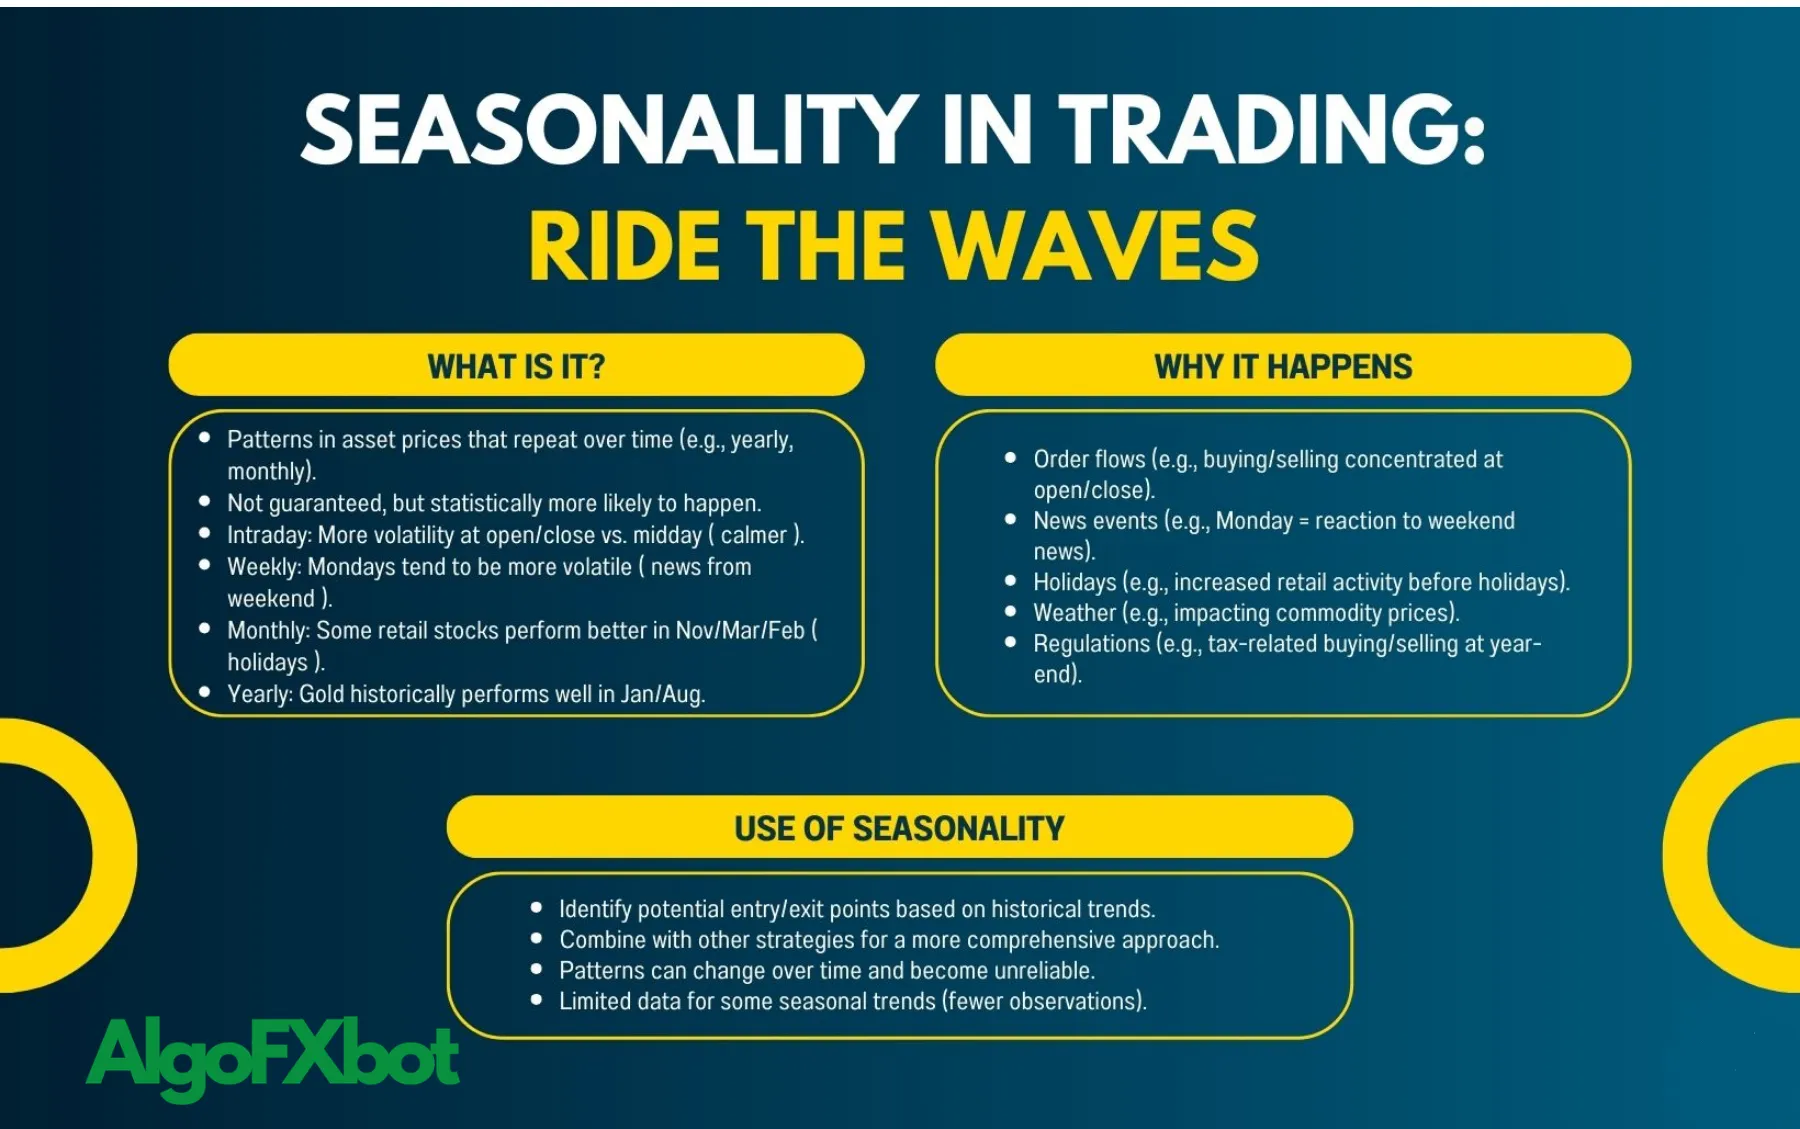
Second, this period includes major consumer spending holidays like Black Friday and Christmas, particularly in the United States. Economic data related to retail sales and consumer confidence can heavily influence the US Dollar (USD). Strong holiday spending can signal a robust economy, potentially boosting the dollar. This combination of institutional repositioning and economic activity makes the fourth quarter a period where new trends can emerge or existing ones can accelerate, breaking out of the quiet ranges often seen during the summer.
How Do Quarterly Cycles Affect Currency Markets?
Beyond the major annual patterns, there are also shorter seasonal tendencies related to the end of financial quarters: late March, June, September, and December. These periods are significant because many multinational corporations must finalize their financial statements and reports. To do this, they often need to convert profits earned in foreign currencies back into their home currency. This process is known as repatriation.

For example, a U.S.-based company that sold goods in Europe will have profits in euros (EUR). At the end of the quarter, it may sell those euros and buy U.S. dollars to report its earnings, creating demand for the USD. A similar effect occurs with Japanese companies, whose fiscal year ends in March. This often leads to large repatriation flows back into the Japanese Yen (JPY), creating a seasonal tendency for the JPY to strengthen leading up to this deadline. These quarterly flows can cause short-term distortions in supply and demand, offering opportunities for traders who are aware of them.
Which Currency Pairs Exhibit the Strongest Seasonal Tendencies?
Currency pairs with the strongest seasonal tendencies include the major EUR/USD, commodity-linked pairs like AUD/USD and USD/CAD, and the Japanese Yen pairs due to their unique economic drivers. While almost all currencies show some form of seasonal behavior, these pairs often display more pronounced and reliable patterns because their value is tied to factors with clear calendar-based cycles. For instance, commodity currencies are influenced by the seasons that affect supply and demand for raw materials like oil and agricultural products. The Japanese Yen is heavily influenced by Japan’s fiscal calendar, which has a fixed end date. The EUR/USD, as the world’s most traded pair, often reflects broad market sentiment shifts that can have a seasonal component. Here’s a breakdown of the seasonal behavior you might observe in these specific pairs.
What are the Typical Seasonal Patterns for EUR/USD?
The EUR/USD is the most liquid and heavily traded currency pair in the world, and it exhibits several historical seasonal tendencies. While these should never be taken as guarantees, historical data often shows distinct patterns throughout the year. For instance, some analyses show that the euro has a tendency to perform well against the U.S. dollar during the second and fourth quarters. The Q4 strength could be linked to global portfolio flows and a potential “risk-on” sentiment that often materializes toward the end of the year, which can sometimes weigh on the safe-haven USD.

Conversely, the third quarter (July-September) has historically been a more challenging period for the EUR/USD. This aligns with the “Summer Doldrums” effect, where lower liquidity can lead to directionless, choppy markets. It’s also a period when U.S. companies may be repatriating foreign earnings, which could create relative demand for the dollar. A trader might use this information by being more cautious with long EUR/USD positions during the summer and more open to bullish setups later in the year, always confirming the seasonal bias with current price action.
What are the Seasonal Patterns for Commodity Currencies (AUD, CAD, NZD)?
Commodity-linked currencies like the Australian Dollar (AUD), Canadian Dollar (CAD), and New Zealand Dollar (NZD) have seasonal patterns that are often tied to the underlying commodities they export. The value of these currencies is heavily influenced by the price fluctuations of raw materials.
- Canadian Dollar (CAD): Canada is a major oil exporter, so the CAD is often correlated with crude oil prices. Oil prices themselves have a seasonal pattern, typically rising in the spring and summer during the U.S. “driving season” and potentially seeing demand increase for heating oil in the winter. This can translate into seasonal strength for the CAD during these periods.
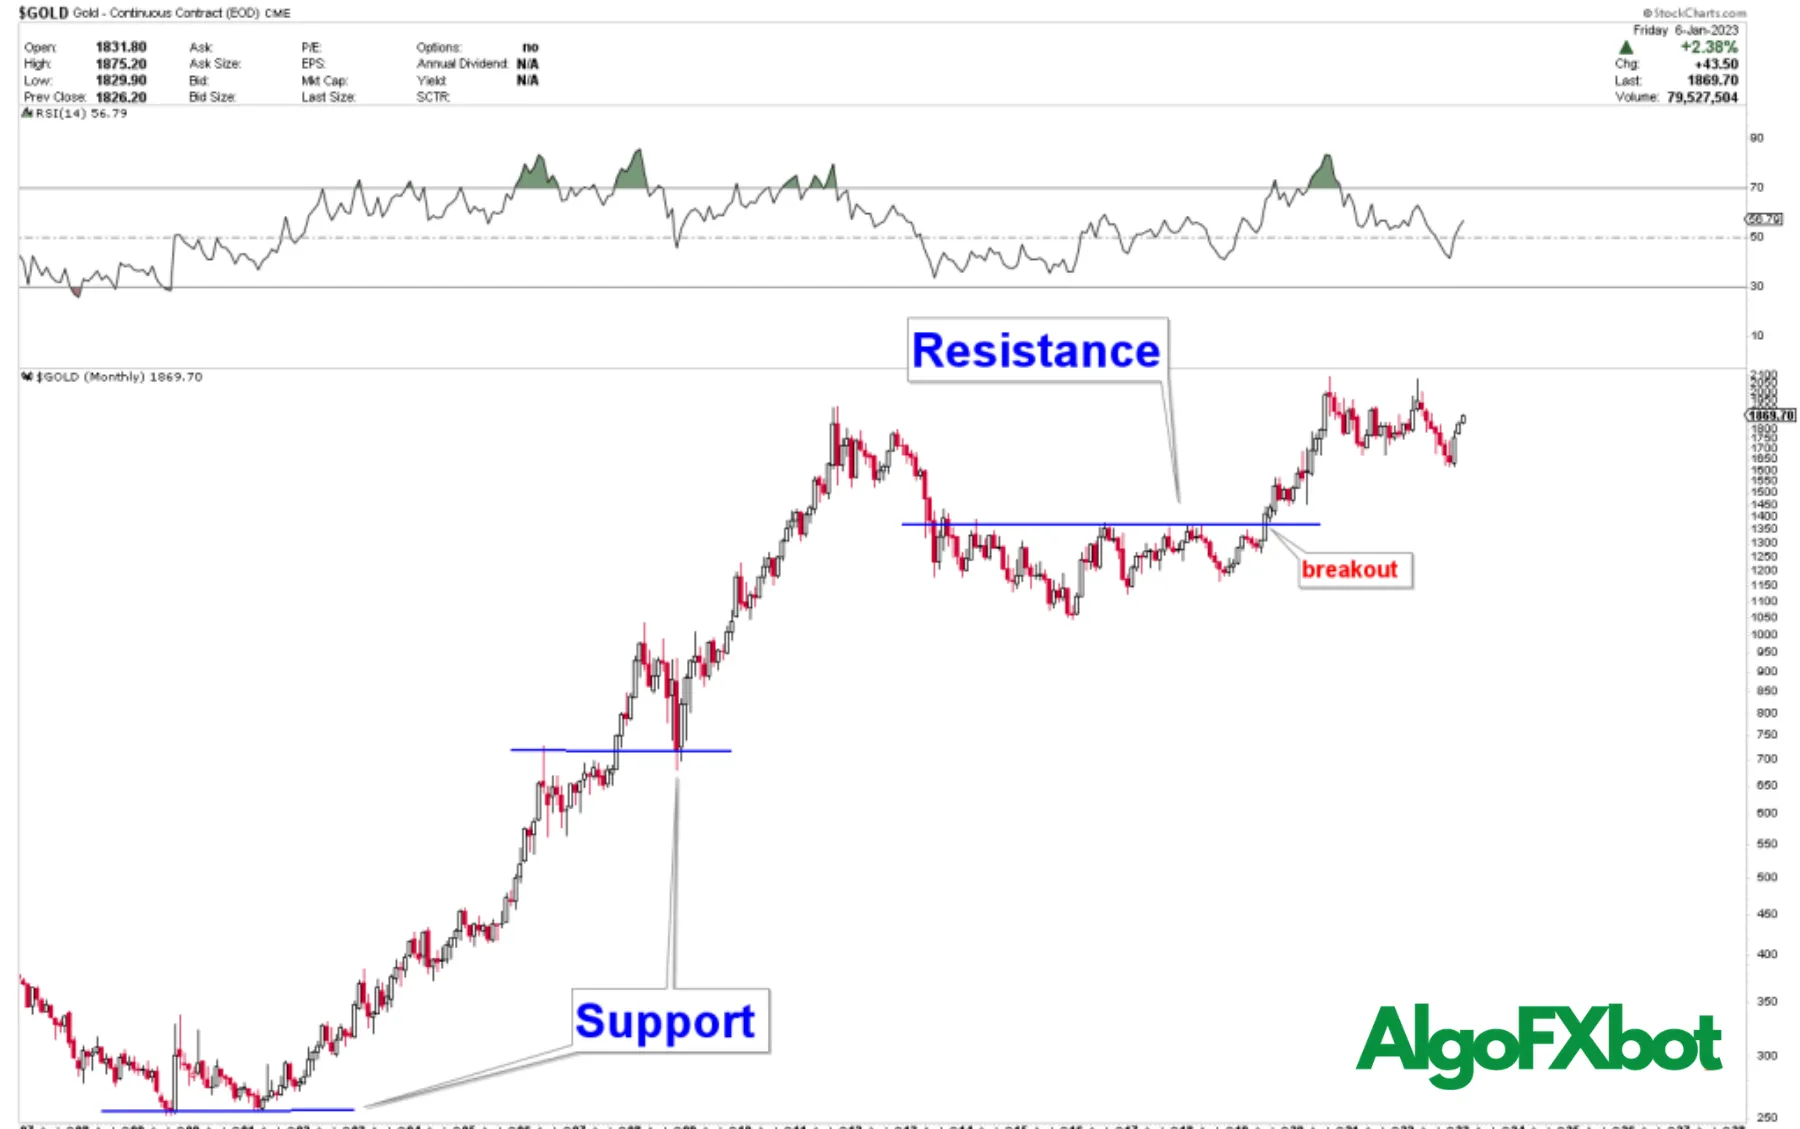
- Australian Dollar (AUD): The AUD is influenced by prices for iron ore and gold. Gold, for example, has a well-known seasonal tendency to perform strongly at the beginning of the year, which can provide a tailwind for the Aussie dollar.
- New Zealand Dollar (NZD): The NZD is linked to agricultural products, especially dairy. The global demand and supply cycles for these soft commodities can create seasonal patterns for the “Kiwi” dollar.
For these currencies, analyzing the seasonal chart of the key commodity can provide an extra layer of insight.
Does the Japanese Yen (JPY) Have Unique Seasonal Behavior?
The Japanese Yen has one of the most well-known and powerful seasonal tendencies in the forex market, primarily driven by Japan’s fiscal calendar. The Japanese fiscal year concludes at the end of March. In the weeks leading up to this deadline, major Japanese corporations and institutional investors often engage in large-scale repatriation, selling off foreign assets and converting the proceeds back into JPY. This massive inflow of capital creates significant demand for the yen, often causing it to strengthen against other major currencies like the USD and EUR during February and March.
However, the JPY also functions as a global safe-haven currency. This means that during times of global financial stress or uncertainty, investors flock to the yen, causing it to strengthen regardless of the season. This safe-haven status can sometimes override the fiscal-year-end pattern. For example, if a major global crisis erupts in March, the JPY’s rally might be attributed more to risk aversion than to repatriation flows. A trader analyzing the JPY must therefore consider both the seasonal factor and the prevailing global risk sentiment.
How Can You Develop a Trading Strategy Based on Seasonal Trends?
The main method is to combine historical seasonal analysis with real-time technical confirmation in a three-step process to identify high-probability trading setups and improve timing. A strategy based purely on seasonality is incomplete because past performance is not indicative of future results. A historical pattern is merely a statistical edge, not a trading signal. The key is to use seasonality to establish a directional bias, like a weather forecast that suggests conditions are favorable for a certain outcome. You then use technical analysis tools to confirm that the current market price is actually behaving as expected before you enter a trade. This disciplined approach helps you avoid trading on history alone and ensures your decisions are grounded in present market conditions. Specifically, building a robust strategy involves a few key components.
How Do You Use Seasonal Charts to Identify Opportunities?
A seasonal chart is the primary tool for identifying historical tendencies. Unlike a standard price chart that shows price over a continuous period, a seasonal chart averages the price performance of an asset over many years (e.g., 5, 10, or 20) for each day or month of the calendar year. This process filters out the noise of any single year and reveals the underlying seasonal pattern. For example, a seasonal chart for gold might show a line that, on average, rises from late December through February and then declines in March.

To use this tool, you look for clear and consistent periods of historical strength or weakness. The goal is not to find a vague pattern but a distinct and repeatable one. If a currency pair’s 15-year seasonal chart shows it has risen 12 out of the last 15 years in April, that provides a strong bullish bias for that month. You would then take this high-level insight to your live trading chart. The seasonal chart has done its job by telling you what to look for and when. It provides the “why” and “when,” but you still need technical analysis to determine the “how” and “where” to enter a trade.
What Technical Indicators Can Confirm a Seasonal Bias?
Once you have a directional bias from your seasonal analysis, the next crucial step is to seek confirmation from technical indicators on your live price chart. This ensures that the current market momentum aligns with the historical tendency. Never enter a trade just because the calendar says you should. Instead, wait for the price action to validate your idea. Several indicators are excellent for this purpose:
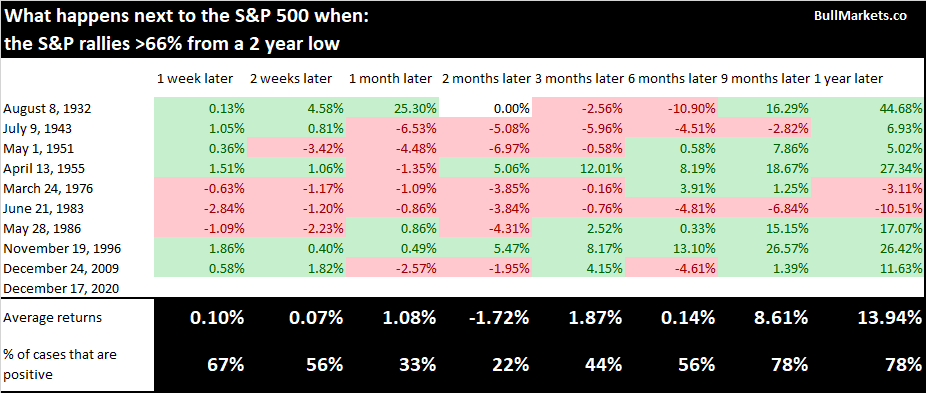
- Moving Averages: If seasonality suggests a currency pair is likely to rise, you can wait for the price to cross above a key moving average, like the 50-day or 200-day MA. A price trading above its moving average confirms that the current trend is indeed bullish, aligning with your seasonal bias.
- Relative Strength Index (RSI): This momentum oscillator can help with timing your entry. If seasonality points to a downtrend, you could wait for the RSI to enter overbought territory (above 70) and then turn lower. This signals that upward momentum is fading and the market may be ready to resume its seasonal downward path.
- MACD (Moving Average Convergence Divergence): A MACD crossover can provide a powerful confirmation signal. For a seasonally bullish outlook, you would look for the MACD line to cross above the signal line, indicating that bullish momentum is building.
By requiring a technical signal to align with the seasonal pattern, you create a powerful confluence of factors. This disciplined, multi-layered approach filters out weak setups and increases the probability of your trade working out.
What Are Other Important Questions About Forex Seasonality?
Forex seasonality is driven by economic factors, analyzed with specific tools, contains notable risks, and differs from seasonal patterns in stock and commodity markets. Moreover, understanding these related aspects provides a more complete picture of how to use historical tendencies in a trading strategy. By exploring the causes, tools, and risks, you can develop a more nuanced approach to seasonal trading.
What Economic Factors Cause Seasonal Trends in Forex?
Seasonal forex trends are rooted in recurring, predictable patterns of economic activity and capital flows throughout the year. For instance, consumer behavior drives major shifts. The holiday shopping season in the fourth quarter in Western countries often boosts retail sales figures, which can strengthen currencies like the U.S. dollar (USD) or the British pound (GBP) due to positive economic data. Another factor is corporate activity. Many multinational corporations repatriate foreign profits at the end of fiscal quarters or the calendar year to pay dividends or taxes, creating predictable demand for their home currency.

Agricultural and energy cycles also play a key role, particularly for commodity-linked currencies.
- Energy Demand: Colder winter months in the Northern Hemisphere increase demand for heating oil and natural gas, often benefiting the Canadian dollar (CAD) and Norwegian krone (NOK).
- Agricultural Cycles: The harvest seasons for major exports like soybeans or wheat can affect the currencies of producer nations such as Australia (AUD) and New Zealand (NZD).
- Tourism: Countries heavily reliant on tourism may see their currency strengthen during peak travel seasons as foreign visitors exchange their money for local currency.
What are the Best Tools for Analyzing Forex Seasonality?
Traders use a variety of tools to identify and validate seasonal forex patterns, ranging from simple charting features to sophisticated software. For many, the starting point is a robust charting platform like TradingView or MetaTrader 4/5. These platforms allow you to visually inspect historical price charts over many years to spot recurring monthly or quarterly price behaviors. Many community-built indicators are also available that can overlay average historical performance directly onto a current chart, helping you visualize potential seasonal strength or weakness.

For more advanced analysis, specialized software and services offer deeper insights.
- Seasonax: This is a dedicated tool that integrates with platforms like Bloomberg and provides detailed seasonality charts for currencies, stocks, and commodities, showing the average performance of an asset for any period.
- Custom Scripts: Traders with coding skills can use languages like Python with libraries such as Pandas and Matplotlib to download historical data and run their own statistical backtests to verify seasonal tendencies.
- Economic Calendars: Advanced economic calendars can be filtered to show the historical impact of recurring data releases, like Non-Farm Payrolls, which can have their own seasonal biases.
What are the Risks of Trading Based on Seasonality?
Trading based on seasonality involves significant risks because historical patterns are statistical averages, not guarantees of future performance. The primary risk is that a well-established seasonal trend can fail to materialize or even reverse. A major geopolitical event, such as a trade war or military conflict, can easily disrupt normal capital flows and override any expected seasonal behavior. Similarly, unexpected monetary policy shifts from a central bank, like a surprise interest rate hike, can cause immediate and sharp currency movements that negate historical tendencies.
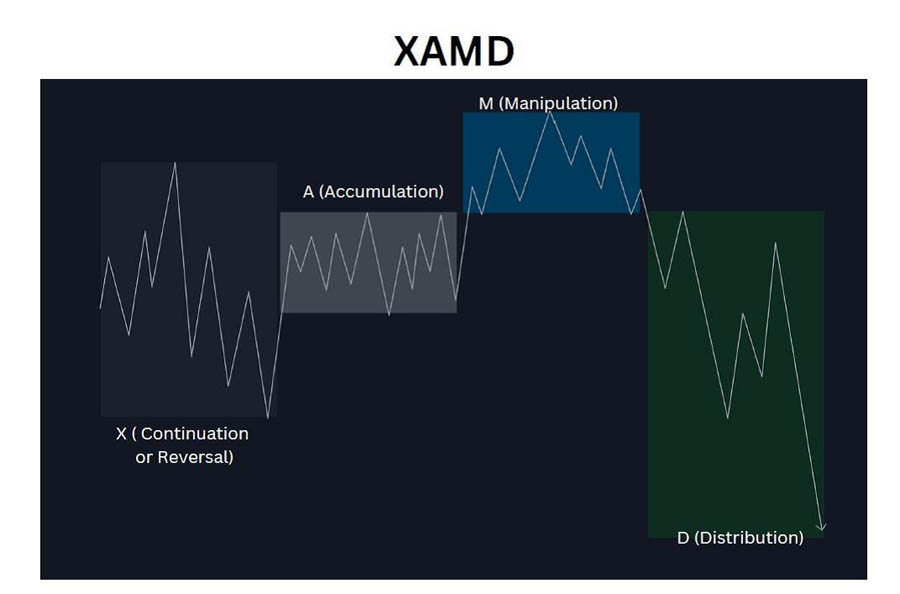
Over-reliance on a single factor is another major danger.
- Lack of Confirmation: A strategy based solely on seasonality without confirmation from other forms of analysis, such as technical indicators or fundamental data, is fragile.
- Changing Market Structures: Economic relationships and global trade patterns evolve over time, which can weaken or invalidate seasonal patterns that were reliable in the past.
- Randomness: Financial markets contain a large degree of randomness, and what appears to be a seasonal pattern could simply be a statistical coincidence from a limited data set.
How Does Forex Seasonality Compare to Seasonality in the Stock Market?
While both forex and stock markets exhibit seasonal tendencies, their underlying drivers are quite different. Stock market seasonality is often more closely tied to investor psychology, corporate earnings cycles, and specific calendar events. Well-known adages like “Sell in May and Go Away” reflect historical periods of underperformance during summer months, often attributed to lower trading volumes and a lack of market-moving news. The “Santa Claus Rally” at the end of the year is linked to holiday optimism, the investment of year-end bonuses, and institutional window dressing of portfolios.
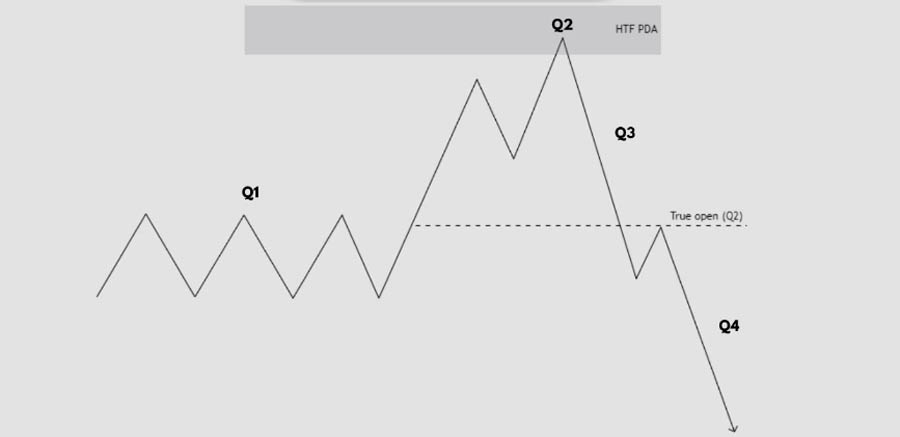
In contrast, forex seasonality is more directly connected to macroeconomic forces and international trade.
- Macroeconomic Drivers: Forex trends are influenced by large scale capital flows related to international trade balances, corporate profit repatriation, and seasonal demand for goods and energy.
- Interest Rate Policies: While central bank meetings occur year-round, policy biases can have seasonal components tied to economic cycles, affecting interest rate differentials between currencies.
- Global Focus: Forex seasonality is a result of the aggregated economic activity of entire nations, whereas stock market seasonality can be driven by the performance and reporting schedules of a few large-cap sectors.
Is Seasonality More Significant in Forex or Commodity Markets?
Seasonality is generally more direct and pronounced in commodity markets than in forex markets. This is because commodity prices are often tied to physical supply and demand cycles that are predictable and recurring. For example, the demand for natural gas and heating oil reliably increases in the winter, creating upward price pressure. Agricultural commodities like corn, soybeans, and wheat follow clear planting, growing, and harvesting seasons that dictate their supply availability throughout the year. These physical constraints create powerful and consistent seasonal patterns that traders have followed for decades.

In the forex market, seasonality is more subtle and statistical in nature.
- Forex Drivers: Forex seasonality is not driven by the supply of a physical item but by the aggregation of millions of economic transactions, including trade, investment, and tourism.
- Statistical Edge: Unlike the near-certainty of increased winter heating demand, forex seasonality provides a statistical probability, or an edge, rather than a certainty.
- Interconnectedness: A currency’s value is relative to another, so its seasonal pattern is affected by the seasonal patterns of its counterpart in a currency pair, adding layers of complexity not present in a single commodity.