

Blog
What Is Technical Analysis in Forex: A Guide to Charts, Indicators, and Principles

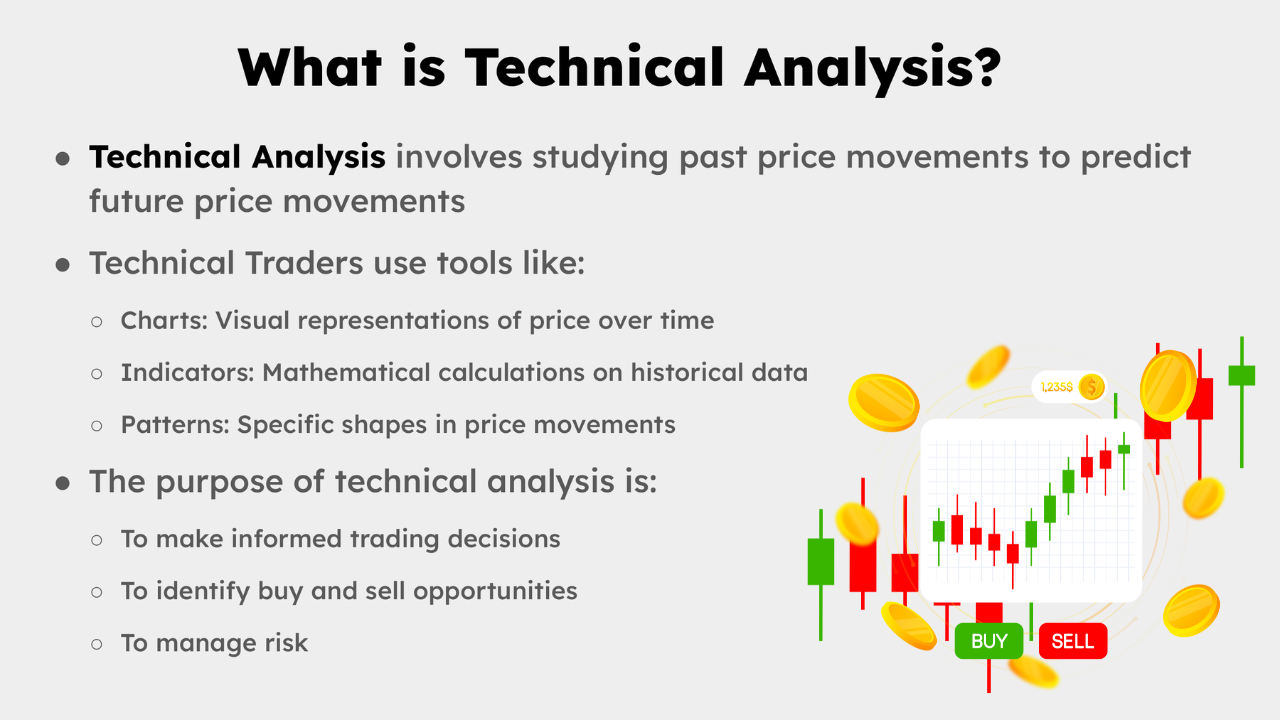
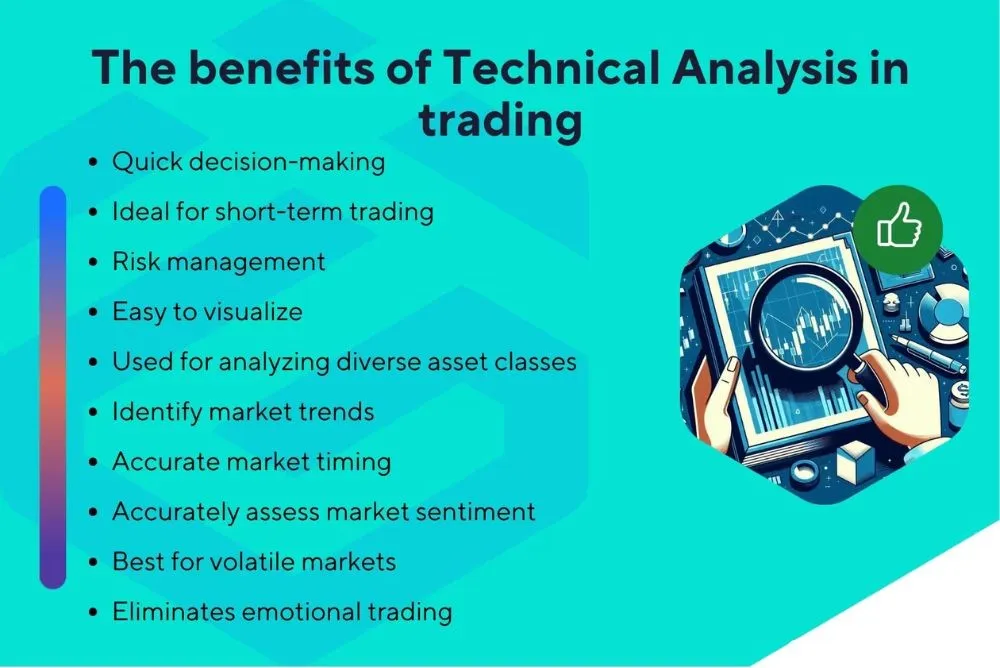
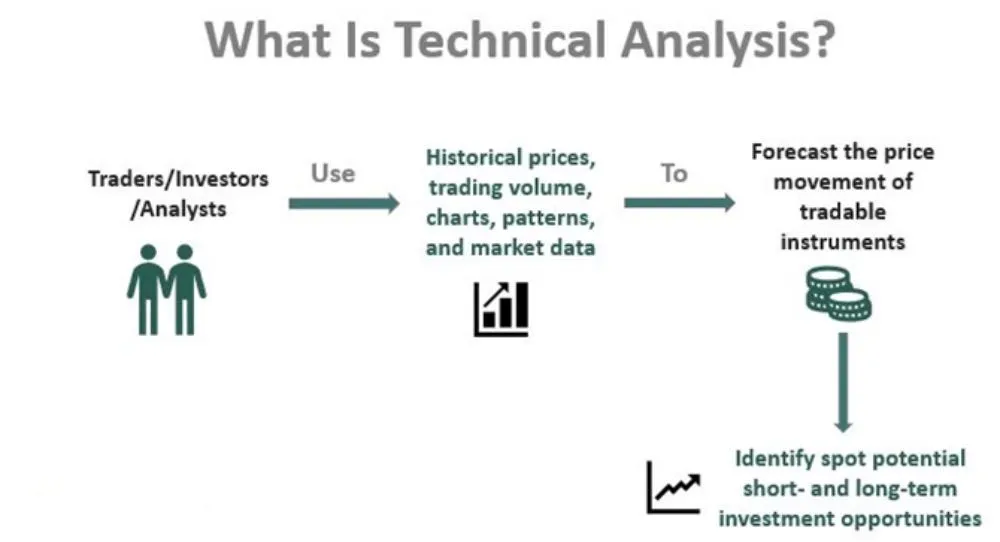
Technical analysis in forex is a trading discipline used to evaluate currency pairs and forecast their future direction by analyzing historical price data, primarily through charts and statistical indicators. Instead of looking at a country’s economic health or interest rates, a technical analyst believes that all the information needed to make a trade is already reflected in the price of a currency pair. This method is grounded in the idea that price movements are not random but follow identifiable patterns and trends that tend to repeat over time. It is a visual approach to trading that relies on interpreting price action.
The primary goal of technical analysis is to identify high-probability trading opportunities by recognizing statistical trends and patterns in market data. By studying past price behavior, traders aim to forecast future movements with a reasonable degree of accuracy. This analysis helps determine not just the direction of a potential trade but also the optimal timing for entry and exit points. It also serves as a critical tool for risk management, allowing traders to set logical stop-loss orders based on chart-based support and resistance levels.
The main tools used for this method are price charts, such as candlestick charts, and mathematical calculations known as technical indicators, like Moving Averages or the Relative Strength Index (RSI). Charts provide a visual representation of a currency pair’s price history over a specific period, making it easier to spot trends and patterns. Indicators are then overlaid on or displayed below the price chart to provide additional insights into market momentum, volatility, and trend strength, helping to confirm trading signals or warn of potential reversals.
Ultimately, technical analysis provides a structured framework for making trading decisions in the complex and fast-moving foreign exchange market. By mastering the principles of chart reading and indicator interpretation, you can develop a systematic approach to finding and managing trades. This guide will walk you through the core concepts, tools, and advantages of using technical analysis to navigate the forex market.
What Is the Definition of Technical Analysis in Forex Trading?
Technical analysis in forex trading is a methodology for forecasting price direction and making trading decisions by examining past market data, primarily price and volume. It is a framework built on the idea that all market information is already baked into the price of a currency pair, and that historical price movements can give clues about future performance. Unlike fundamental analysis, which focuses on economic data, interest rates, and geopolitical events, technical analysis is concerned only with the chart. A technical trader looks at what the price is doing now and what it has done in the past to form a hypothesis about where it might go next. This involves studying price charts to identify recurring patterns, trends, and key levels of support and resistance. By applying various statistical tools and indicators, traders aim to gain a statistical edge, improve their timing for entering and exiting trades, and manage their risk more effectively in the volatile foreign exchange market.
What Is the Goal of Using Technical Analysis?
The primary goal of using technical analysis is to identify trading opportunities and manage risk by analyzing statistical trends gathered from trading activity. It’s not about being right 100% of the time, which is impossible. Instead, it is about tilting the probabilities in your favor. By studying charts, a trader can identify the prevailing trend of a currency pair, such as the EUR/USD. If the pair is in an uptrend, the goal is to find low-risk entry points to buy, or “go long.” Conversely, in a downtrend, the goal is to find opportunities to sell, or “go short.”
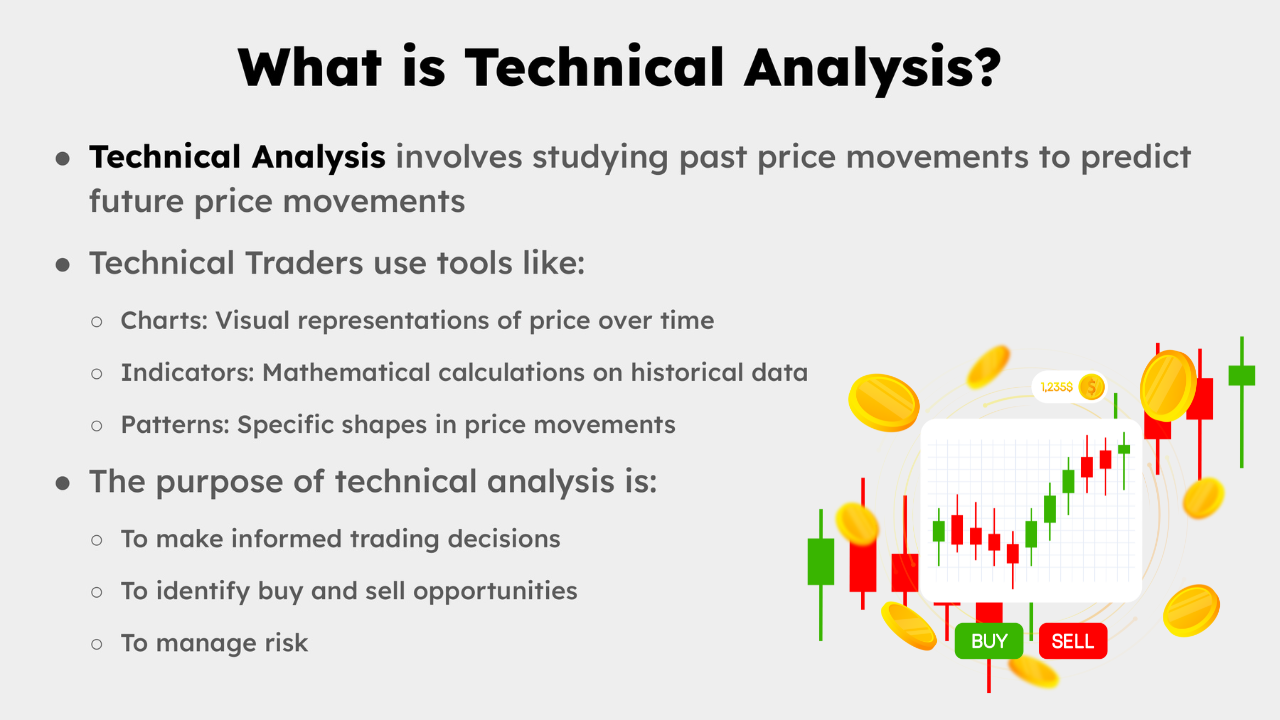
Another key goal is risk management. Technical analysis provides clear, visual levels on a chart that can be used to set protective stop-loss orders. For example, if you buy a currency pair at a support level (a price floor where buying interest has historically been strong), you can place your stop-loss just below that level. If the price breaks below support, your trade is automatically closed, limiting your potential loss. Similarly, it helps in setting profit targets at resistance levels (a price ceiling where selling pressure has been strong). This disciplined approach to defining risk and reward before entering a trade is a cornerstone of successful trading.
What Data Does Technical Analysis Use?
Technical analysis exclusively uses data generated by the market itself. The main inputs are historical price, volume, and time. For any given time interval, such as a one-hour or one-day period, the price data is typically broken down into four key components:
- Open: The first price at which the currency pair traded at the beginning of the time period.
- High: The highest price the pair reached during that period.
- Low: The lowest price the pair reached during that period.
- Close: The final price at which the pair traded at the end of the time period.
This set of data is often referred to as OHLC. It forms the basis for constructing different types of charts, like bar charts and candlestick charts, which provide much more information than a simple line chart that only tracks the closing price.
The second critical data input is volume, which represents the total amount of a currency that was traded during a specific period. In forex, true volume is difficult to track because it is a decentralized, over-the-counter market. However, many trading platforms provide “tick volume,” which measures the number of price changes. While not a perfect substitute, traders use tick volume to gauge market activity and confirm the strength of a price trend. For instance, a strong price move accompanied by high volume is generally considered more valid than a move with low volume.
What Are the Core Principles of Technical Analysis?
The three core principles of technical analysis, largely derived from Dow Theory, are that market action discounts everything, prices move in trends, and history tends to repeat itself. These foundational assumptions form the bedrock upon which all chart patterns, indicators, and trading strategies are built. Understanding them is essential because they provide the “why” behind the practice of looking at a chart to make trading decisions. They represent a philosophy about how markets work, suggesting that human psychology and market behavior are predictable to a certain degree. Each principle builds on the other to create a logical framework for analyzing financial markets, including the massive and liquid forex market. Let’s explore each of these principles in more detail to see how they apply to practical trading scenarios.
Does Market Action Discount Everything?
The first and most important principle is that market action discounts everything. This means that any piece of information that could possibly affect a currency’s price, whether it’s fundamental, economic, political, or psychological, is already reflected in its current market price. For a forex trader, this implies that you don’t need to analyze inflation reports from the European Central Bank or listen to speeches from the U.S. Federal Reserve to trade the EUR/USD pair successfully. Why? Because the collective actions of all market participants, including banks, hedge funds, corporations, and retail traders, have already processed that information and expressed their conclusions through buying and selling.

The price chart, therefore, is seen as the ultimate summary of all known and even unknown information. If demand for the Euro is greater than the supply, its price will rise. If supply outweighs demand, its price will fall. The reasons behind that supply and demand imbalance are irrelevant to the pure technical analyst. This principle simplifies the trading process immensely, allowing you to focus solely on price action and chart patterns rather than trying to become an expert in global macroeconomics for every currency you trade.
Do Forex Prices Move in Trends?
The second core principle is that prices move in trends. Price movements are not random or chaotic. Instead, they follow directional paths that persist for some period of time. A key objective of technical analysis is to identify these trends early in their development to trade in the direction of the trend. This concept is often summarized by the famous trading adage, “the trend is your friend.” There are three primary types of trends you’ll encounter:
1. Uptrend: Characterized by a series of “higher highs” and “higher lows.” This indicates that buying pressure is stronger than selling pressure, and traders will look for opportunities to buy.
2. Downtrend: Characterized by a series of “lower highs” and “lower lows.” This shows that selling pressure is dominant, and traders will seek opportunities to sell.
3. Sideways Trend (or Range): Occurs when price moves back and forth between a relatively stable high (resistance) and low (support). In this scenario, traders might buy at support and sell at resistance or wait for a “breakout” in either direction.
By identifying the prevailing trend on a chart, a trader can make more informed decisions and avoid fighting against the market’s primary momentum, which improves the probability of a successful trade.
Does History Tend to Repeat Itself?
The final principle is that history tends to repeat itself. This concept is rooted in market psychology. The price patterns and formations you see on a chart are visual representations of human emotions like fear, greed, and hope. Because human nature is relatively constant over time, people tend to react to similar market situations in predictable ways. This is why certain chart patterns, like “head and shoulders,” “double tops,” or “triangles,” have been recognized and used for decades. These patterns have predictive value because they illustrate a recurring battle between buyers and sellers at key price levels.
For instance, a “double top” pattern forms after a strong uptrend and looks like the letter “M.” It shows that the price failed to break above a specific high point on two separate occasions, suggesting that buyers are losing steam and sellers are taking control. A technical trader who recognizes this historical pattern might see it as a signal to sell or exit a long position. The idea is that what happened in the past under similar circumstances is likely to happen again, providing a statistical edge for forecasting future price movements.
How Does Technical Analysis Work to Predict Forex Movements?
Technical analysis works by using charts to visualize price history and applying mathematical indicators to identify statistical patterns, trends, and potential reversal points. It’s a systematic process of interpreting market-generated data to forecast the most probable direction of a currency pair’s future price. A technical analyst operates like a detective, looking for clues left behind by the price action of buyers and sellers. The entire approach is based on the core principles that price discounts all information, moves in trends, and that history, driven by human psychology, tends to repeat itself. By applying a consistent framework, a trader can move from a chaotic-looking price chart to a structured set of high-probability trade setups with defined risk.
To understand this better, let’s break down the practical workflow of a technical trader. The process isn’t about finding a magic formula that predicts the future with certainty; rather, it’s about building a case for a trade based on accumulated evidence from the chart. The first step is always selecting a market and a timeframe. A day trader might look at a 15-minute chart of the GBP/JPY, while a swing trader might focus on a 4-hour or daily chart of the AUD/USD. The chosen timeframe sets the context for all subsequent analysis.
Once the chart is open, the trader’s primary job is to identify the market environment. Is the price in a clear uptrend, a downtrend, or is it moving sideways in a range? This is often done by simply looking at the sequence of peaks and troughs. An uptrend shows higher peaks and higher troughs, while a downtrend shows the opposite. This initial assessment is crucial because it dictates the type of strategy to be used. For example, in a strong uptrend, a trader would primarily look for buying opportunities, often waiting for a temporary pullback to a support level to enter at a better price.
With the market context established, the trader then applies specific tools to refine their analysis and pinpoint entry and exit signals. This is where technical indicators and chart patterns come into play. A trader might add a Moving Average to the chart to confirm the trend’s direction and strength. They might use an oscillator like the Relative Strength Index (RSI) to identify overbought or oversold conditions, which could signal a potential price reversal or a good entry point during a pullback. They will also scan the chart for classic patterns like triangles, flags, or head and shoulders, which can signal either a continuation of the current trend or an impending reversal. By combining these different pieces of evidence, the trader formulates a complete trade plan: a precise entry price, a stop-loss level to limit potential losses, and a take-profit target to lock in gains.
What Are the Main Tools for Forex Technical Analysis?
The main tools for forex technical analysis are price charts for visualizing historical data and technical indicators for applying mathematical formulas to that data for deeper insight. These two categories work together to provide a comprehensive view of the market. Charts are the canvas, showing the raw price action, while indicators are the analytical brushes that help traders interpret that action. A trader rarely relies on just one tool. Instead, they build a trading system by combining a few select charts and indicators that complement each other. For example, a trend-following indicator might be paired with a momentum indicator to both confirm the direction and find the best time to enter a trade. Mastering these tools allows a trader to create a repeatable process for analyzing any currency pair on any timeframe.
What Are Forex Charts?
A forex chart is a graphical representation of a currency pair’s price over a specific period. It is the most fundamental tool for a technical analyst, as it visually displays the historical battle between buyers and sellers. While there are several types, three are the most popular:
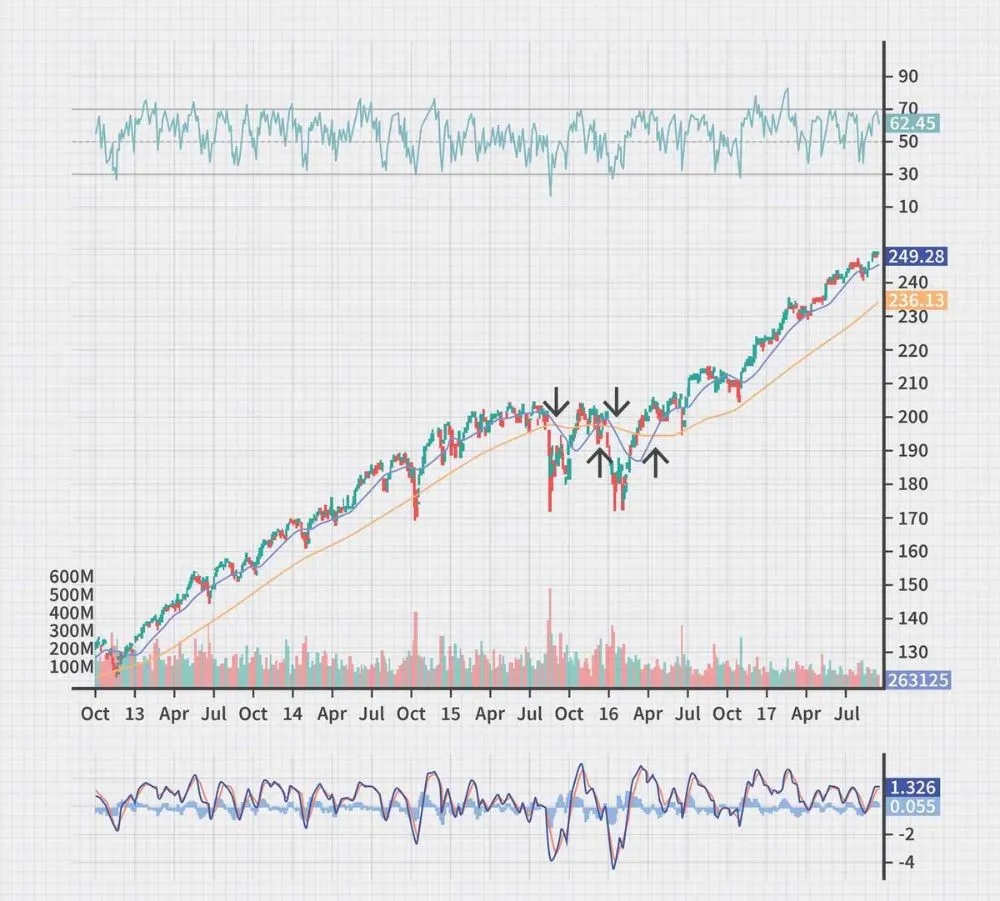
- Line Chart: This is the simplest type of chart, created by connecting a series of closing prices over time. It offers a clean, easy-to-read view of the general price trend but omits the open, high, and low price data for each period. It is best used for identifying long-term trends and major support and resistance levels.
- Bar Chart: This chart provides more detail than a line chart. Each period is represented by a vertical bar that shows the open, high,low, and close prices (OHLC). The top of the bar is the high, the bottom is the low, a small horizontal tick on the left shows the open price, and a small tick on the right shows the close price. It gives a clear picture of the trading range for the period.
- Candlestick Chart: Originating from Japan, this is the most popular chart type among modern traders. Like a bar chart, it shows the OHLC, but it does so in a more visually intuitive way. The “body” of the candle represents the range between the open and close price. If the close is above the open, the body is typically green or white (bullish). If the close is below the open, it’s red or black (bearish). The thin lines above and below the body, called “wicks” or “shadows,” show the high and low. Candlesticks make it very easy to see price momentum at a glance.
What Are Technical Indicators?
Technical indicators are mathematical calculations based on the price, volume, or open interest of a security or contract, which in forex is applied to a currency pair. They are used to forecast future price changes by analyzing historical data. Traders use indicators to help identify trends, gauge momentum, and measure volatility. They are usually plotted on top of a price chart or in a separate window below it. There are thousands of indicators, but they can generally be grouped into a few main categories:

- Trend-Following Indicators: These indicators help traders identify the direction and strength of a trend. The most common example is the Moving Average (MA), which smooths out price data to create a single flowing line, making it easier to see the underlying trend.
- Momentum Indicators (Oscillators): These indicators are designed to signal whether a currency pair is “overbought” or “oversold.” They typically fluctuate within a set range. Examples include the Relative Strength Index (RSI), which measures the speed and change of price movements on a scale of 0 to 100, and the Stochastic Oscillator.
- Volatility Indicators: These tools measure the rate of price movement, regardless of direction. They can help traders identify periods of high or low volatility. Bollinger Bands, which consist of a moving average plus two standard deviation bands above and below it, are a popular volatility indicator. The bands widen when volatility increases and contract when it decreases.
- Volume Indicators: These indicators use volume (or tick volume in forex) to confirm the strength of a trend. The On-Balance Volume (OBV) is an example that uses volume flow to predict price changes.
What Are the Advantages of Technical Analysis in Forex?
The primary advantages of technical analysis in forex are its objectivity in providing clear entry and exit signals, its effectiveness in risk management, and its universal applicability across all currency pairs and timeframes. This method of analysis offers a structured and data-driven approach that can help traders navigate the complexities of the world’s largest financial market. Unlike fundamental analysis, which can be subjective and require extensive research into economic reports, technical analysis focuses solely on price action, making it a more accessible and efficient discipline for many traders. It provides a roadmap based on historical behavior, which can reduce emotional decision-making and promote a more disciplined trading style.
One of the most significant benefits is the clarity it provides for entry, exit, and risk management. Technical analysis uses specific price levels, chart patterns, and indicator readings to generate trade signals. For example, a trader might decide to enter a long trade when the price of EUR/USD bounces off a key support level and a momentum indicator like the RSI crosses above 30, signaling an exit from oversold territory. This is a clear, repeatable rule. More importantly, that same support level provides a logical place to set a stop-loss order, defining the exact amount of risk on the trade from the outset. Profit targets can be set at the next resistance level. This mechanical approach helps remove greed and fear from the decision-making process, which are often the biggest obstacles to consistent profitability.
Another key advantage is its versatility and broad applicability. The principles of technical analysis can be applied to any financial instrument that has historical price data, and this is especially true in the forex market. The same techniques used to analyze the highly liquid EUR/USD pair can also be used on a more exotic pair like the USD/ZAR (U.S. Dollar vs. South African Rand). Furthermore, it is adaptable to any trading style or timeframe. A scalper looking for small profits over a few minutes can use technical analysis on a one-minute chart, while a long-term position trader holding trades for weeks or months can use the same principles on a weekly or monthly chart. This flexibility allows traders to tailor their analytical approach to their own personality, schedule, and risk tolerance.
Finally, technical analysis is highly efficient and accessible. In the fast-paced 24-hour forex market, news and economic data can be released at any time. Trying to stay on top of all the fundamental drivers for multiple currencies can be overwhelming. Technical analysis, on the other hand, summarizes all of that information into the price chart. A trader can quickly pull up a chart for any currency pair and, within minutes, get a feel for the market’s trend, volatility, and key price levels. Modern trading platforms come equipped with advanced charting packages and a vast library of built-in indicators, making the tools of technical analysis readily available to every retail trader with an internet connection. This accessibility lowers the barrier to entry and allows traders to focus on developing and executing their strategies.
What Are Related Concepts in Forex Technical Analysis?
Technical analysis is deeply connected to concepts like fundamental analysis, specific chart indicators, trading psychology, and risk management. Furthermore, understanding these related ideas provides a more complete picture of how technical analysis fits into a comprehensive forex trading strategy.
What Is the Difference Between Technical and Fundamental Analysis?
Technical and fundamental analysis are the two primary methodologies for evaluating financial markets, but they approach the task from opposite ends. Technical analysis focuses entirely on price action. Technicians believe that all known information, from economic news to market sentiment, is already reflected in a currency pair’s price chart. They use historical price data, patterns, and volume to forecast future price movements. Their tools are charts and indicators, and their goal is to identify trends and entry or exit points, often for short to medium term trades.

In contrast, fundamental analysis examines the intrinsic value of an asset. For forex, this means evaluating the economic health and stability of the countries behind the currencies.
- Data Sources: Fundamental analysts look at economic indicators like Gross Domestic Product (GDP), inflation rates, employment figures, and central bank interest rate policies.
- Goal: Their objective is to determine if a currency is overvalued or undervalued relative to its economic reality, assuming its price will eventually correct to its true value.
- Timeframe: This approach is typically used for longer term investment decisions, as economic trends can take months or years to play out and affect currency prices.
What Are the Most Common Types of Technical Indicators?
Technical indicators are mathematical calculations based on price, volume, or open interest of a security or contract used by traders who follow technical analysis. They are designed to help forecast future price changes by providing signals for entry and exit points. Among the hundreds available, a few are exceptionally popular for their reliability and ease of use.

Traders often use these tools in combination to confirm signals and increase their confidence in a trade setup.
- Moving Averages (MA): This is one of the most basic yet powerful trend following indicators. It smooths out price data by creating a constantly updated average price. A simple moving average (SMA) gives equal weight to all prices in the period, while an exponential moving average (EMA) gives more weight to recent prices, making it more responsive.
- Relative Strength Index (RSI): The RSI is a momentum oscillator that measures the speed and change of price movements. It oscillates between zero and 100. Traditionally, the RSI is considered overbought when above 70 and oversold when below 30, signaling a potential trend reversal or pullback.
- Moving Average Convergence Divergence (MACD): This versatile indicator shows the relationship between two exponential moving averages. It consists of the MACD line, a signal line, and a histogram. Traders look for crossovers between the MACD and signal lines to identify potential buy and sell signals.
Are There Disadvantages to Using Technical Analysis?
While technical analysis is a powerful tool for navigating the forex market, it is not without its limitations and should not be viewed as a flawless predictive system. One of the main criticisms is its inherent subjectivity. Two different analysts can look at the exact same price chart and come to completely different conclusions. What one sees as a clear bullish pattern, another might interpret as a consolidation phase before a downturn. This lack of objective certainty can be a source of confusion.

Another significant disadvantage is the occurrence of false signals, often called “whipsaws.”
- Lagging Indicators: Many indicators, such as moving averages, are lagging, meaning they are based on past price action. By the time they generate a signal, the significant price move may have already happened.
- Premature Signals: Conversely, leading indicators like the RSI can provide premature signals. An asset might appear overbought and continue to rise for an extended period, causing traders who acted on the initial signal to miss out on further gains.
- Past Performance: The entire foundation of technical analysis rests on the belief that historical price patterns will repeat. While history often rhymes, it is never an exact replica, and unforeseen market events can render past patterns irrelevant.
Is Technical Analysis Enough to Trade Forex Profitably?
For the vast majority of traders, relying solely on technical analysis is not enough to achieve consistent, long term profitability. While it provides an excellent framework for identifying potential trade setups, timing entries, and managing exits, it only tells part of the story. Successful trading is often described as a three legged stool, requiring a balance of technical analysis, fundamental analysis, and rigorous risk management. Technical analysis helps answer “when” to enter or exit a trade, based on chart patterns and indicator signals.
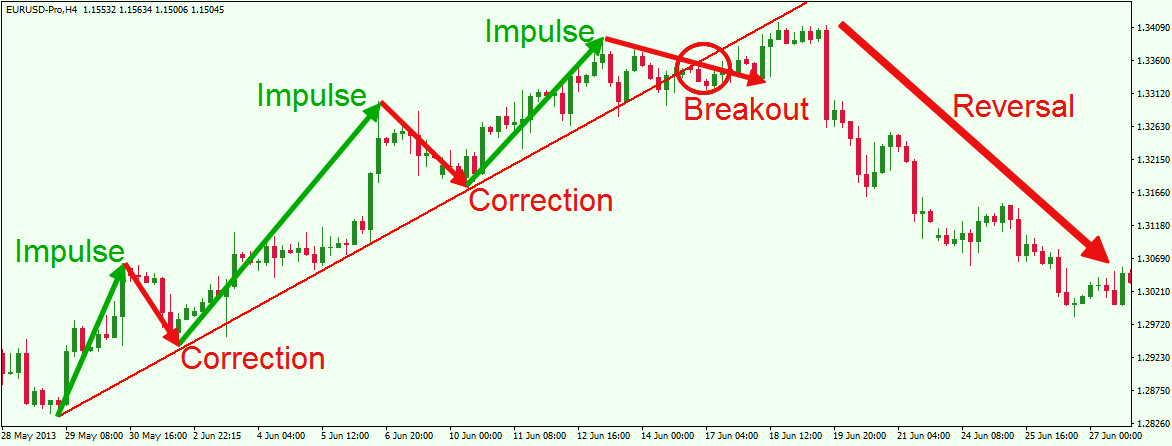
However, fundamental analysis provides the “why” behind a major market move. A technically perfect setup can instantly fail if a central bank makes an unexpected interest rate announcement or a major geopolitical event occurs. By having at least a basic understanding of the economic calendar and major news drivers, a trader can avoid taking technical signals right before high impact events that could introduce extreme volatility. More importantly, neither analytical method will lead to success without proper risk management. This includes using stop losses, calculating appropriate position sizes, and maintaining a healthy risk to reward ratio on every trade. Without this third leg, even the most insightful analysis can lead to a depleted trading account.
How Does Algorithmic Trading Use Technical Analysis?
Algorithmic trading leverages the systematic, rule based nature of technical analysis to automate trading decisions. In this relationship, technical analysis provides the “logic” and the algorithm provides the execution. Developers program automated trading systems, often called trading bots or Expert Advisors (EAs) in platforms like MetaTrader 4, to scan the markets and execute trades based on a predefined set of technical rules. These systems can operate 24/7 without emotion or fatigue, which are common pitfalls for human traders.

This connection allows for a powerful and efficient application of technical principles. For example, an algorithm can be designed with rules such as:
- Entry Condition: Buy EUR/USD when the 50 period Exponential Moving Average crosses above the 200 period Exponential Moving Average and the Relative Strength Index (RSI) is below 70.
- Exit Condition: Sell the position if the price falls 50 pips below the entry (a stop loss) or if the 50 EMA crosses back below the 200 EMA.
- Position Sizing: Risk no more than 1% of the total account balance on any single trade.
By codifying these technical rules, traders can backtest their strategies on historical data to see how they would have performed, helping them refine their approach before risking real capital.