

Blog
How to Use Support and Resistance Levels in Forex Trading

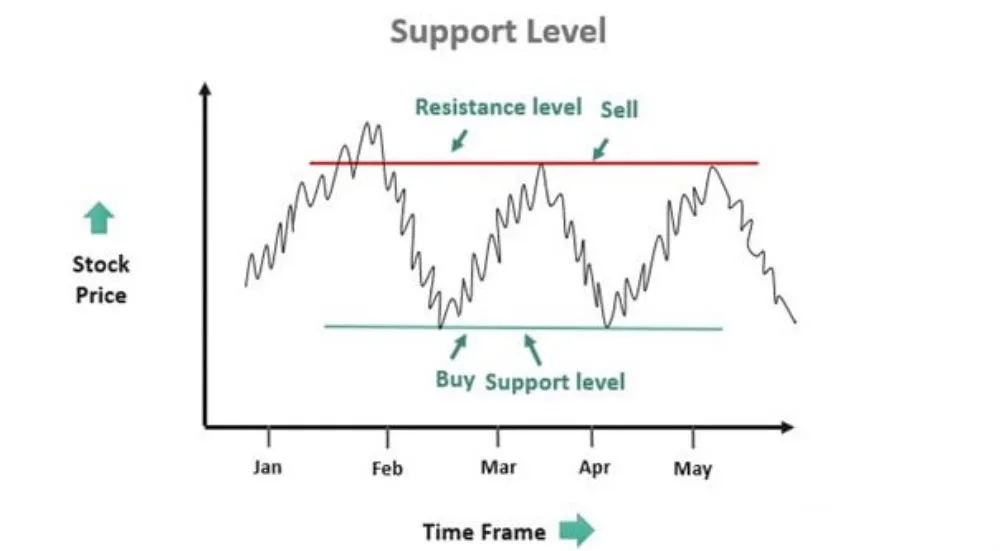
Using support and resistance in forex trading involves identifying key price levels on a chart where the market has previously reversed and then using those levels to make trading decisions. The primary method is to either trade “bounces” off these levels in a ranging market or trade “breakouts” when the price decisively moves through them, signaling a potential new trend. These levels act as a map of the market, showing you areas where the balance between buyers and sellers is likely to shift, providing high-probability entry and exit points for your trades. By mastering this concept, you can frame your trades with clear risk management parameters.
At their core, support and resistance levels are specific price points on a chart that act as barriers to price movement. Support is a price “floor” where buying pressure is strong enough to stop a downtrend, while resistance is a price “ceiling” where selling pressure is strong enough to stop an uptrend. Think of them as zones where a significant number of traders have previously decided to either buy or sell, creating a memory in the market that often repeats itself.
You can find these critical levels by carefully examining historical price action on a currency pair’s chart. The most reliable way to identify support and resistance is by locating previous swing highs (peaks) and swing lows (troughs) where the price has reversed direction multiple times. The more often a level has been tested and has held, the more significant it becomes, signaling a strong concentration of buy or sell orders at that price.
Understanding how to properly identify, draw, and trade these levels is a foundational skill for any forex trader. It moves you from random guessing to making informed decisions based on market structure and psychology. Let’s explore exactly what these levels are, how to find them, and the specific strategies you can apply to use them in your trading.
What Are Support and Resistance in Forex Trading?
Support and resistance are price levels on a chart that act as barriers, formed by a concentration of historical buying (support) or selling (resistance) pressure. They represent key turning points where the psychology of the market shifts, causing price to pause or reverse direction. To understand this better, let’s explore these foundational concepts in more detail, as they are the building blocks of technical analysis in the forex market. These levels are not random. They are created by the collective actions and beliefs of millions of traders. When a price level is established as support, it means that at that point, buyers become more aggressive than sellers. Conversely, at a resistance level, sellers overpower buyers. This dynamic of supply and demand creates visible boundaries on your chart, offering clues about future price movements. Recognizing these areas is the first step toward building a robust trading strategy, allowing you to anticipate potential market reactions instead of just reacting to them. It’s a way of reading the story that the price chart is telling you about the battle between bulls and bears.
What is a Support Level?
A support level is essentially a price floor where a downtrend is expected to pause or reverse due to a surge in demand or buying interest. At this level, buyers see the currency pair as undervalued and begin to enter the market in larger numbers, overwhelming the sellers. This increased demand stops the price from falling further and can often push it back up. Imagine a tennis ball being dropped on the floor. The floor acts as a support, preventing the ball from going any lower and causing it to bounce back up. A support level on a forex chart functions in much the same way for price.
For example, let’s say the EUR/USD pair is in a downtrend, falling from 1.0850. As it approaches 1.0700, you notice on the chart that twice in the last month, the price hit this exact level and then rallied back up. This historical action establishes 1.0700 as a support level. As the price nears this level again, traders who missed the previous bounces may place buy orders, while those who shorted the pair may start taking profits. This combined activity creates a strong wave of buying pressure that absorbs the selling, halting the decline. The more times the price touches 1.0700 and bounces, the stronger that support level is considered to be by market participants.
What is a Resistance Level?
A resistance level is the opposite of support. It is a price ceiling where an uptrend is expected to pause or reverse due to a concentration of supply or selling interest. At this level, sellers become more dominant than buyers because traders perceive the currency pair as overvalued. They may start selling to lock in profits from a long position or initiate new short positions in anticipation of a price drop. Continuing our tennis ball analogy, resistance is like the ceiling. If you throw the ball upward, the ceiling will stop it from going any higher and force it back down.

For instance, consider the GBP/JPY pair rallying from 198.00. As it approaches 200.50, you observe that this is the highest price it has reached in the past six months, and each time it got close, it was met with heavy selling and fell back down. This makes 200.50 a strong resistance level. As the price approaches it again, traders who bought at lower levels will see it as a prime opportunity to sell and take their profits. At the same time, bearish traders will view it as a low-risk point to enter short trades. This surge in supply overwhelms the demand from buyers, causing the upward momentum to stall and often reverse. A strong resistance level acts as a formidable barrier, and it often takes a major catalyst or a significant shift in market sentiment to break through it.
How Do You Identify Key Support and Resistance Zones?
You identify key support and resistance zones primarily by analyzing historical price action, looking for previous swing highs and swing lows where the market has repeatedly reversed direction. This manual process involves scanning the chart to find obvious turning points that stand out. Here’s a breakdown of the practical methods you can use to pinpoint these crucial areas on your trading platform. The foundation of this skill lies in training your eye to see the market’s structure. It’s not about finding a secret formula but rather about observing where price has struggled to move past in the past. These historical battlegrounds between buyers and sellers often remain relevant for future price action. While indicators can help, the most powerful levels are typically those visible to the naked eye on a clean price chart. By focusing on these clear, respected levels, you can filter out market noise and focus on areas where a significant reaction is most likely to occur, giving you a strategic advantage in planning your trades.
How Do You Find S&R Using Price Highs and Lows?
The most direct method for finding support and resistance is by identifying significant “swing highs” and “swing lows” on your chart. A swing high is a peak where the price reached a high point before turning back down. A swing low is a trough where the price hit a low point before bouncing back up. To find them, simply look at your chart and mark the most obvious peaks and valleys where price reversed.
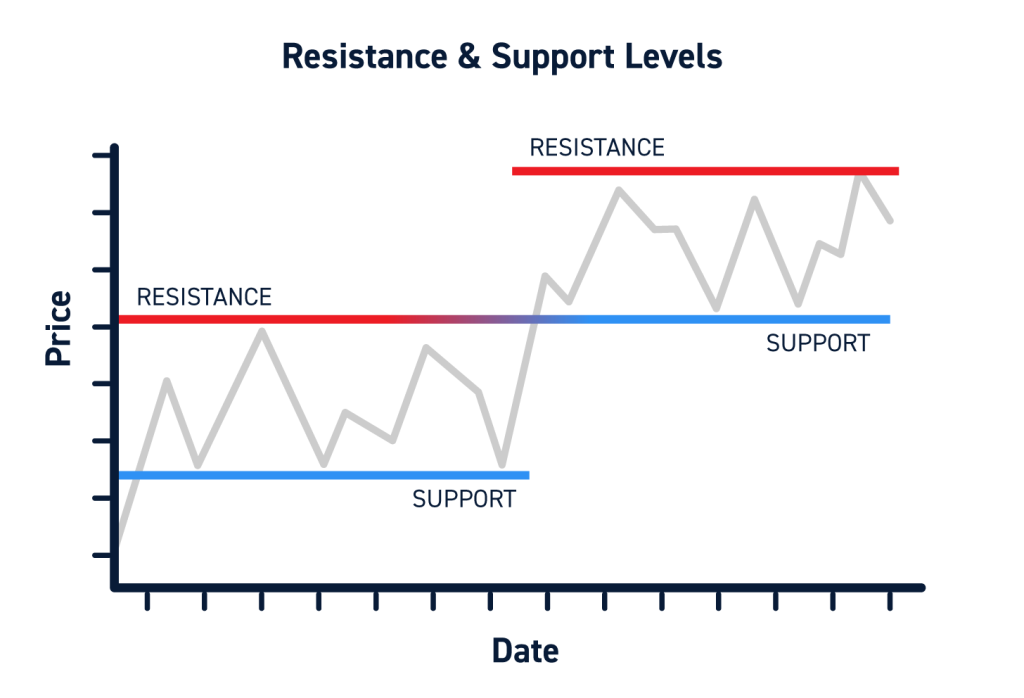
The key to confirming a level’s importance is the rule of multiple touches. A single peak or valley is just a turning point, but when the price returns to that same approximate level and reverses again, it starts to establish a valid support or resistance area. For instance, if you see the price of USD/CAD drop to 1.3500 and bounce, that’s a potential support level. If it returns to 1.3500 a week later and bounces again, the level is confirmed. A third touch makes it even stronger. The more times a level has been tested and has held firm, the more traders will be watching it, which in turn reinforces its strength. To find resistance, you do the opposite: look for multiple peaks that form at a similar price level.
Do Previous Support Levels Become Future Resistance?
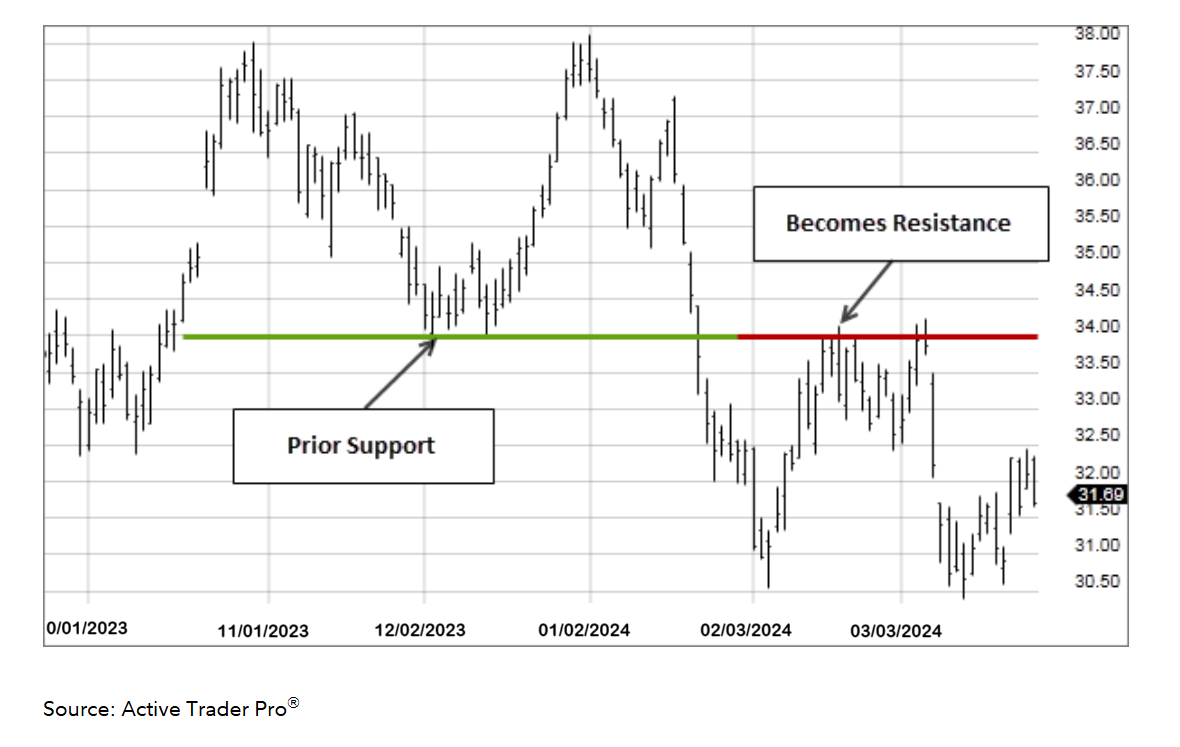
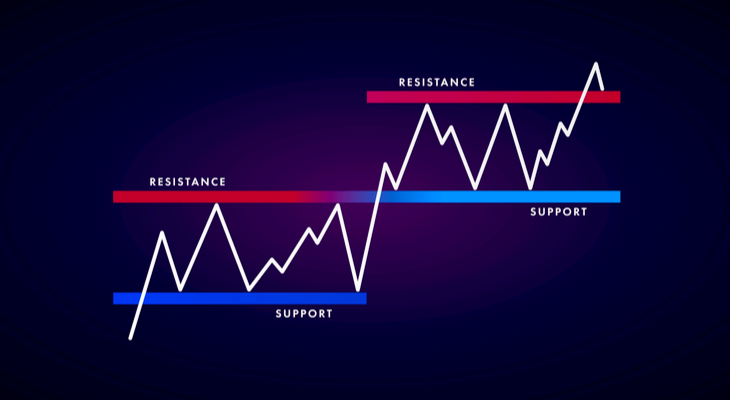
Yes, when a support level is decisively broken, it often becomes a new resistance level, a phenomenon known as the polarity principle or “role reversal.” This is a fundamental concept in technical analysis. The same is true in reverse: when a resistance level is broken, it frequently turns into a new support level. This happens because the market’s psychology surrounding that price level has changed.
Let’s illustrate with an example. Suppose the 1.2500 level was a strong support for GBP/USD. Many traders bought at this level, expecting it to bounce. However, due to negative news, the price breaks below 1.2500 and falls to 1.2400. The traders who bought at 1.2500 are now holding a losing position. Many of them will be hoping for the price to return to their entry point so they can sell and exit their trade at breakeven, cutting their losses. If the price does rally back up to 1.2500, this wave of selling from the trapped buyers, combined with new sellers who see the broken support as a new ceiling, creates significant resistance. The old floor has now become the new ceiling. This principle is extremely useful for identifying high-probability entry points, especially in the context of a breakout and retest strategy.
What is the Correct Way to Draw Support and Resistance Lines?
The correct way to draw support and resistance is to connect at least two major swing points with a horizontal line, though viewing these levels as zones rather than precise lines is more effective. This practice acknowledges that market turning points are rarely exact to the pip. Let’s look at the practical details of getting this right on your charts, as accurately drawing these levels is crucial for developing reliable trading strategies. The goal is not to pinpoint a single price but to identify an area where a reaction is likely. Your lines should capture the essence of where supply and demand have historically shifted. It is a skill that blends art and science. While there are rules, a trader’s discretion and experience play a large part in determining which levels are most relevant. Over time, you will develop a feel for how to draw lines that best reflect the market’s behavior, leading to more consistent analysis.
Should You Draw S&R Lines or Zones?
While drawing a simple line is a good starting point, it’s far more practical and effective to draw support and resistance as zones. The market is driven by human emotion and is rarely perfectly precise. Price will almost never reverse at the exact same price point every single time. One time it might reverse at 1.1000, the next at 1.1005, and another at 1.0995. If you only draw a single line at 1.1000, you might miss trading opportunities or get faked out by small overshoots.
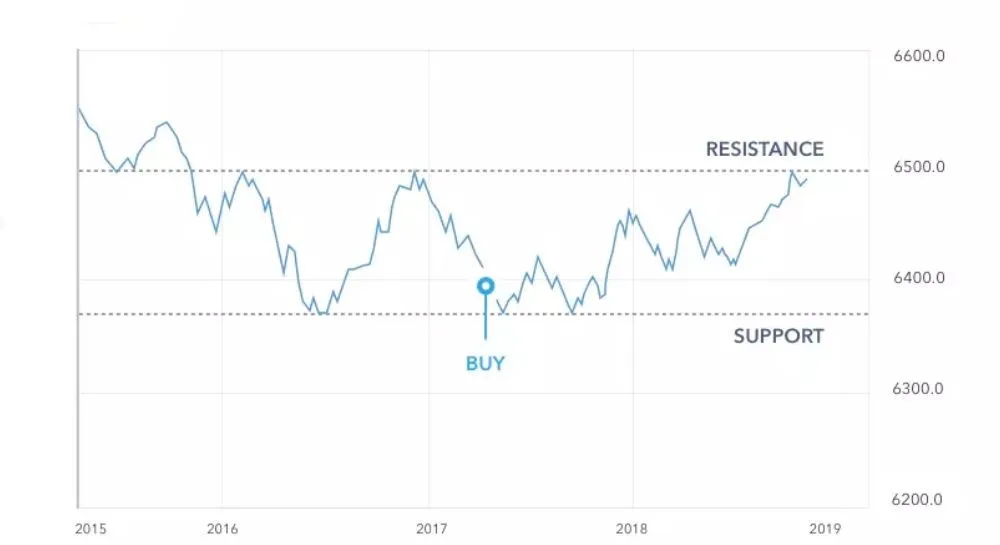
A zone, typically drawn as a thin rectangle on your chart, accounts for this market “noise.” To draw a support zone, you would identify the cluster of swing lows and draw a rectangle that covers the area from the lowest candle wicks up to the candle bodies. This captures the entire price area where buyers have historically stepped in. Similarly, for a resistance zone, you would draw a rectangle covering the area from the candle bodies up to the highest wicks of the swing highs. Thinking in terms of zones helps you avoid the trap of being too rigid with your levels and gives your trade setup more breathing room. It reflects the reality that support and resistance are areas of contention, not impenetrable walls at a single price.
Which Timeframes are Best for Drawing Support and Resistance?
The timeframe you use to draw your support and resistance levels has a direct impact on their strength and reliability. As a general rule, support and resistance levels identified on higher timeframes (such as the weekly, daily, or 4-hour charts) are far more powerful than those found on lower timeframes (like the 15-minute or 1-hour charts). This is because higher timeframe levels are formed over a longer period, which means they represent a larger volume of transactions and a more significant consensus among market participants. A daily support level has been defended by buyers for days or weeks, making it a much more formidable barrier than a 15-minute level that has only held for a few hours.
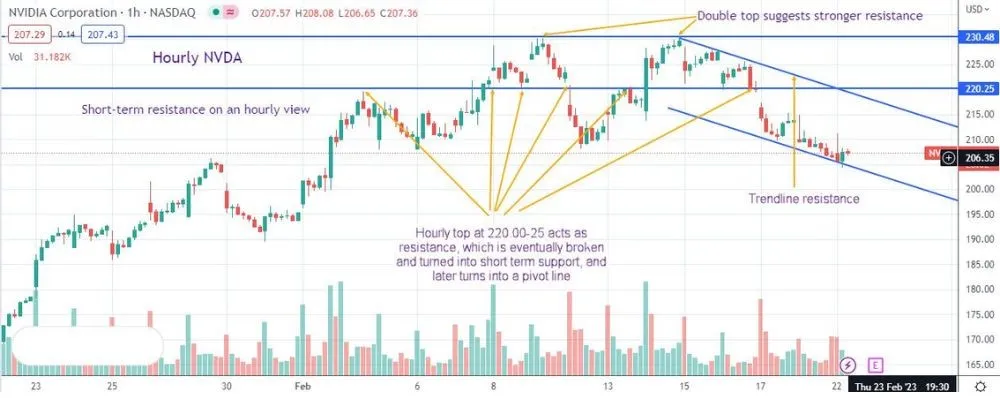
A highly effective approach is to use a top-down analysis. Start by identifying the major, long-term support and resistance zones on the weekly or daily chart. These are your key battlegrounds. Once you have marked these major levels, you can then zoom in to a lower timeframe, like the 4-hour or 1-hour chart, to look for more precise entry signals and finer S&R levels within the larger context. For example, if the price on the daily chart is approaching a major support zone, you can switch to the 1-hour chart to watch for a bullish candlestick pattern to form, signaling a good time to enter a buy trade. This method allows you to trade with the bigger picture in mind, greatly improving the probability of your trades.
How Do You Trade Using Support and Resistance Strategies?
You can trade using two primary support and resistance strategies: the range trading strategy, which involves buying at support and selling at resistance, and the breakout strategy, which involves trading after the price breaks through these levels. Both approaches leverage the predictable behavior of the market around these key zones but are suited for different market conditions. Let’s break down how each of these powerful strategies works in practice so you can apply them to your own trading. The choice between these strategies depends on whether the market is consolidating sideways or beginning a new directional move. By learning to identify the prevailing market condition, you can select the appropriate strategy to capitalize on the price action around your identified support and resistance zones. Each method requires a clear plan for entry, stop-loss placement, and profit targets to manage risk effectively.
What is the Bouncing or Range Trading Strategy?
The bouncing strategy, also known as range trading, is ideal for a market that is consolidating or moving sideways between a well-defined support and resistance level. In this scenario, there is no clear uptrend or downtrend. The strategy is straightforward: you aim to buy when the price hits the support level and sell when it reaches the resistance level. The core assumption is that these boundaries will continue to hold, causing the price to “bounce” back and forth between them.
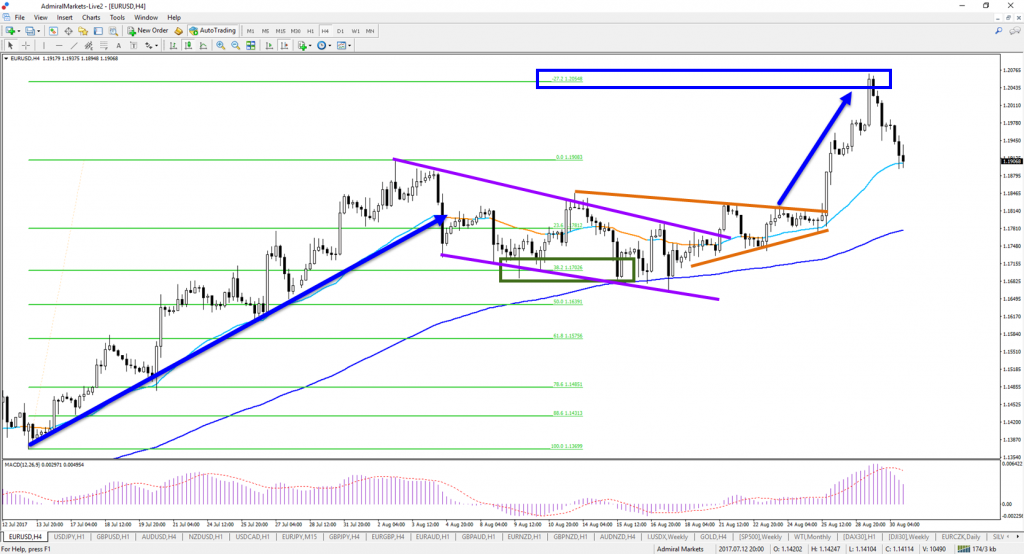
Here’s how to execute it:
1. Entry: Wait for the price to touch a strong support or resistance level. Do not enter the moment it touches. Instead, look for confirmation that the level is holding. This could be a bullish candlestick pattern (like a hammer or bullish engulfing) at support or a bearish pattern (like a shooting star or bearish engulfing) at resistance. This confirmation increases the probability that the bounce will occur.
2. Stop-Loss: Risk management is critical. For a buy trade at support, place your stop-loss just below the support zone. For a sell trade at resistance, place your stop-loss just above the resistance zone. This protects you in case the level breaks unexpectedly.
3. Take-Profit: The logical profit target is the opposite end of the range. If you buy at support, set your take-profit just below the resistance level. If you sell at resistance, set your take-profit just above the support level.
What is the Breakout and Retest Strategy?
The breakout and retest strategy is used when you anticipate that a support or resistance level is about to fail, leading to a strong directional move. This often happens when a market transitions from a ranging phase to a trending phase. A simple breakout can be misleading, as many of them turn out to be “false breakouts” or “fakeouts,” where the price briefly pierces a level only to reverse back into the range. To avoid this trap, experienced traders often wait for a retest.

Here’s the step-by-step process:
1. The Breakout: First, you must see a decisive break. This is usually confirmed by a candle closing clearly beyond the support or resistance zone, often with strong momentum.
2. The Retest: After the breakout, the price will often pull back to the level it just broke. This is the retest. The old resistance level should now act as new support, or the old support level should act as new resistance (the polarity principle).
3. Entry: The entry signal occurs on the retest. When the price pulls back to the broken level and shows signs of respecting it in its new role (e.g., a bullish candle forming on a retest of old resistance), you can enter the trade in the direction of the breakout.
4. Stop-Loss: Place your stop-loss on the other side of the broken level. For a bullish breakout, your stop would go below the new support zone. For a bearish breakout, it would go above the new resistance zone.
5. Take-Profit: You can set a profit target by measuring the height of the previous range and projecting that distance from the breakout point or by targeting the next major support or resistance level.
What Are Other Key Concepts and Types of Support and Resistance?
Beyond simple horizontal lines, other key forms of support and resistance include dynamic levels like moving averages and trendlines, psychological round numbers, and calculated levels like Fibonacci retracements. What’s more, understanding these varied types provides a more nuanced view of how price action interacts with different potential barriers in the market. Each type gives unique insights into market sentiment and potential turning points, moving beyond the static price levels of past highs and lows. By incorporating these concepts, traders can build a more robust framework for analyzing currency pairs. Let’s look at how these advanced forms work and what makes them different.
What Is the Difference Between Static and Dynamic Support and Resistance?
The primary difference between static and dynamic support and resistance lies in their behavior over time. Static support and resistance levels are fixed price points that do not change, whereas dynamic levels move along with the price. Static levels are horizontal lines drawn on a chart based on historical price data. For example, if a currency pair repeatedly fails to rise above 1.0850, a static resistance line is placed at that price. This level remains the same regardless of what happens next. Pivot points are another example of static levels that are calculated at the start of a trading day and remain fixed throughout the session.
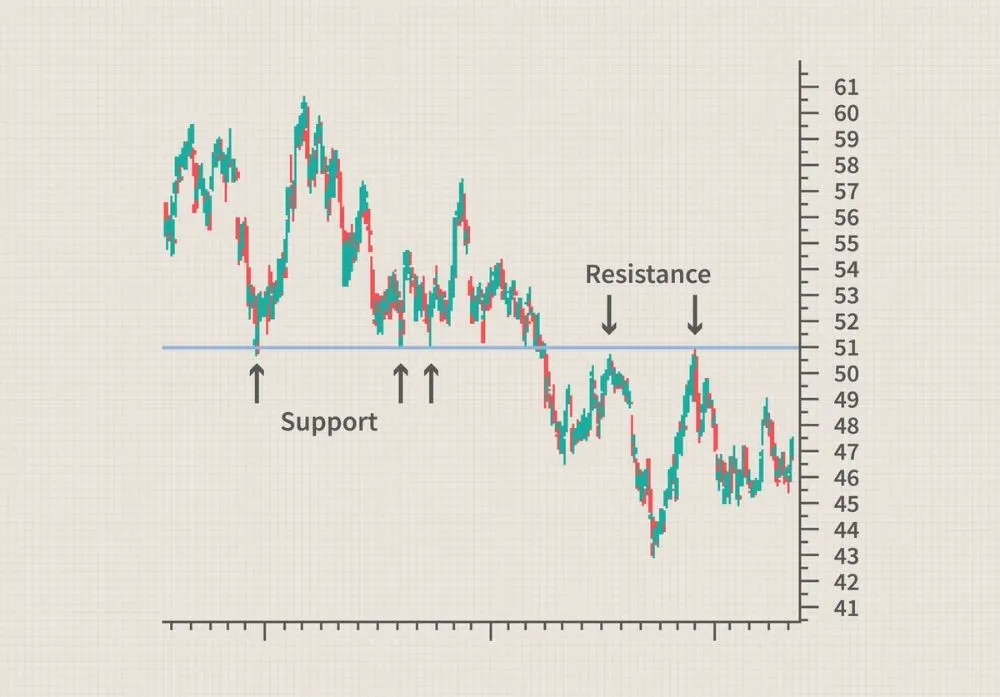
In contrast, dynamic support and resistance are fluid and adapt to recent price action. The most common example is a moving average. A 50-period moving average, for instance, recalculates its position with each new candle, creating a constantly shifting line.
- In an uptrend, a rising moving average often acts as dynamic support, with price pulling back to it before bouncing higher.
- In a downtrend, a falling moving average often acts as dynamic resistance, with price rallying to it before being pushed lower.
How Do Trendlines Act as Support and Resistance?
Trendlines are a simple yet powerful tool that acts as a diagonal, or dynamic, form of support and resistance. Unlike horizontal levels that mark a specific price, trendlines follow the general direction of the market’s momentum. You can draw them to visualize the current trend and identify potential areas where the price might reverse or continue. The way you draw them depends on the direction of the market. A key point is that a trendline becomes more confirmed the more times the price touches and respects it.
To apply them correctly, follow these steps:
- In an uptrend, you draw a line connecting at least two consecutive higher lows. This ascending line then acts as a support level. Traders will watch for the price to pull back to this trendline, looking for buying opportunities as it is expected to hold.
- In a downtrend, you draw a line connecting at least two consecutive lower highs. This descending line acts as a resistance level. Here, traders anticipate that price rallies will stall at the trendline, providing potential selling opportunities.
- A break of a confirmed trendline can signal that the current trend is weakening and a potential reversal is underway.
Are Round Numbers a Form of Psychological Support and Resistance?
Yes, round numbers absolutely function as a form of psychological support and resistance. These levels, often called “psych levels” or “big figures,” are price points that end in .00 or .50, such as 1.2000 for EUR/USD or 160.00 for GBP/JPY. Their power comes not from technical analysis but from human psychology. People naturally gravitate toward whole numbers, and this tendency extends to trading. Large financial institutions, hedge funds, and retail traders alike tend to place a high volume of entry orders, stop-loss orders, and take-profit targets at or around these neat figures.
This concentration of orders creates a self-fulfilling effect. For instance, as a currency pair approaches a major round number like 1.1000, a large number of sell orders may be waiting just below it, creating a strong resistance barrier. Similarly, many buy orders may be placed just above it, creating a support floor. This collective market behavior can cause the price to slow down, stall, or reverse direction entirely upon reaching these levels, even if no historical price action occurred there previously.
How Do Fibonacci Levels Relate to Support and Resistance?
Fibonacci levels are a predictive tool used to identify potential support and resistance areas before the price actually reaches them. Derived from a mathematical sequence discovered by Leonardo Fibonacci, these levels work on the theory that markets tend to retrace a predictable portion of a previous move before continuing in the original direction. The most common tool is the Fibonacci retracement, which is drawn by connecting a significant swing low to a significant swing high in an uptrend, or vice versa in a downtrend.
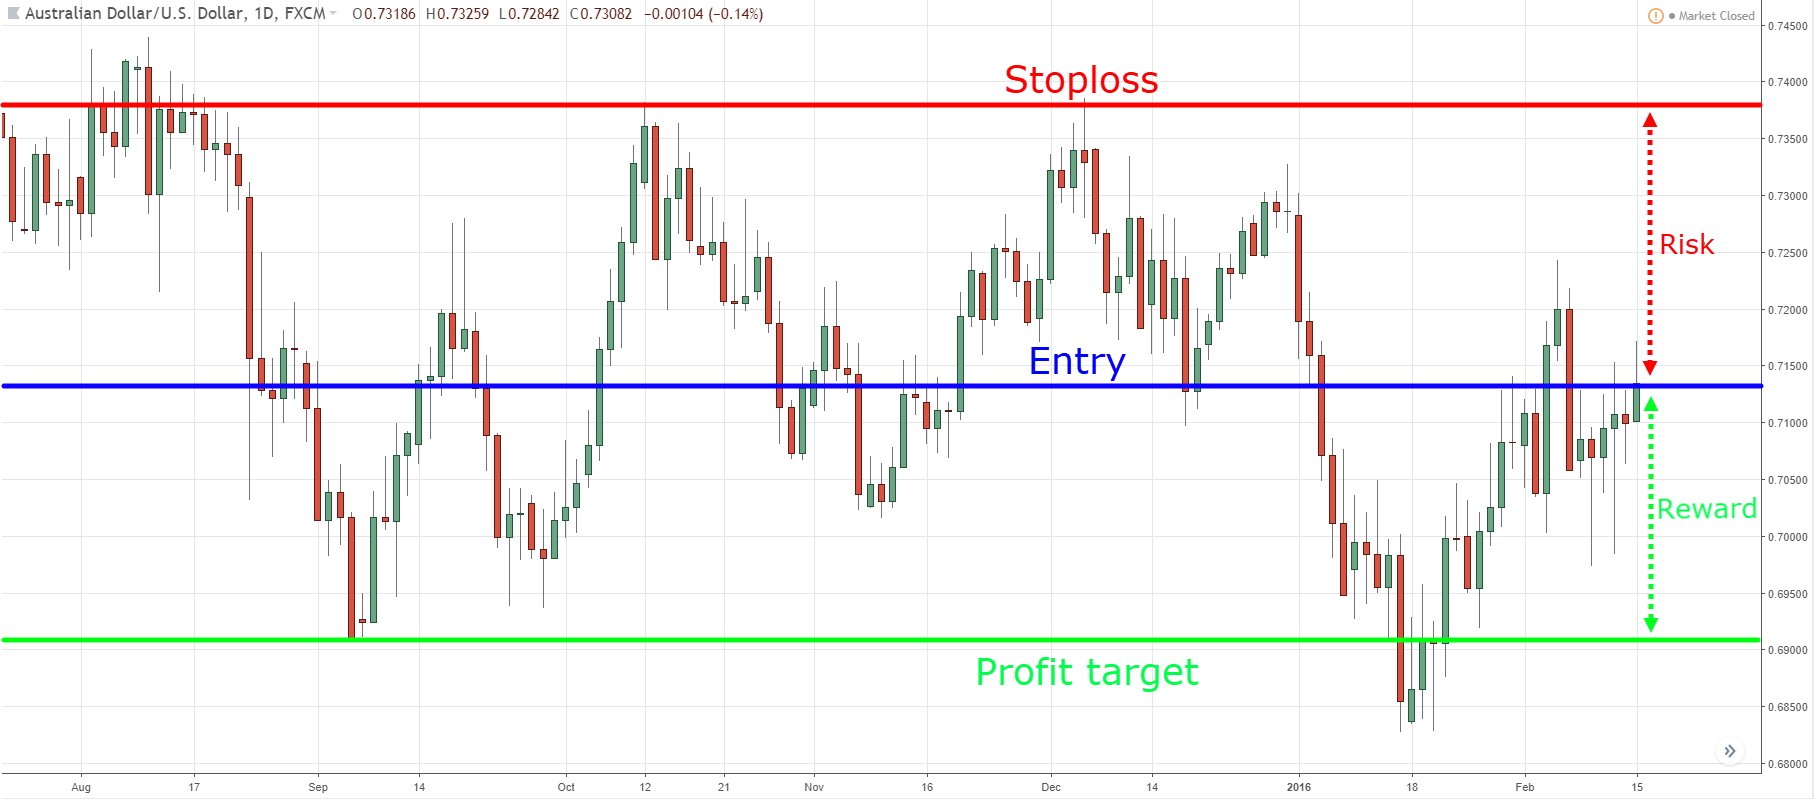
This action creates a grid of horizontal lines at key Fibonacci ratios. The most watched levels include:
- 23.6%: The shallowest retracement level.
- 38.2%: A moderate retracement area.
- 50%: Although not an official Fibonacci ratio, it is included because prices often reverse after retracing half of a prior move.
- 61.8%: Often called the “golden ratio,” this is a very strong potential reversal zone.
When price is in an uptrend and pulls back, traders watch for it to bounce off one of these Fibonacci levels, which act as potential support. Conversely, in a downtrend, these levels act as potential resistance during a price rally.
What Is the Difference Between a Breakout and a False Breakout?
The difference between a breakout and a false breakout is whether the price sustains its move beyond a key level. A breakout is a confirmed move where the price pushes through a support or resistance level and continues in that direction, whereas a false breakout occurs when the price breaches a level only to quickly reverse. A false breakout, also known as a “fakeout,” is a common trap for inexperienced traders. It looks like a genuine breakout at first, encouraging traders to enter the market, but then the price moves back to its previous range, stopping them out for a loss.
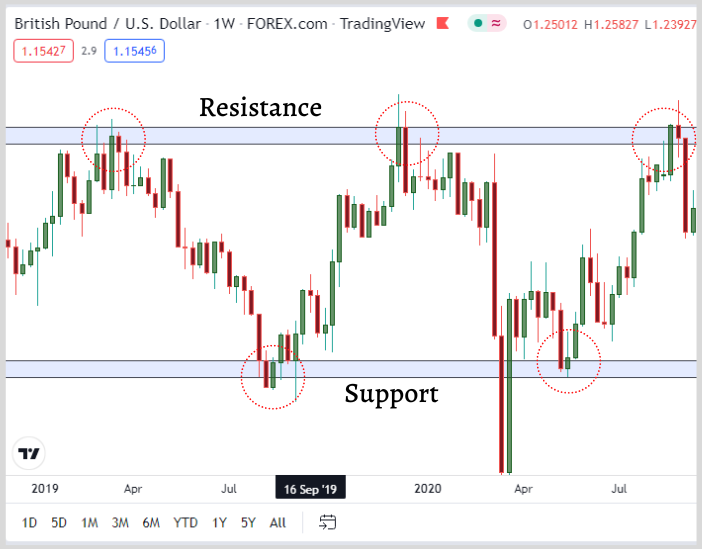
To help distinguish a genuine breakout from a false one, you can use several confirmation techniques:
- Wait for a candle close: Do not enter a trade the moment a level is broken. Instead, wait for the trading candle (e.g., a 1-hour or 4-hour candle) to close firmly beyond the support or resistance line. This shows stronger conviction.
- Check trading volume: A true breakout is often accompanied by a noticeable increase in trading volume. High volume suggests that many market participants are behind the move. A breakout on low volume is more likely to fail.
- Look for a retest: A classic breakout pattern involves the price breaking a level, pulling back to “retest” that same level from the opposite side, and then continuing on its way. This retest confirms the old resistance has become new support (or vice versa).