

Blog
What are the Top 5 Forex Chart Patterns and How Do You Trade Them?

The top five forex chart patterns every trader should know are the Head and Shoulders, Double Top and Double Bottom, Bullish and Bearish Flags, Ascending and Descending Triangles, and the Pennant. These patterns are highly regarded because they are common, visually distinct, and provide clear entry, stop-loss, and take-profit signals based on their structure. By learning to identify these formations on a price chart, you can better anticipate potential market movements and make more informed trading decisions.
To trade these patterns effectively, you must first identify the pattern and then wait for a confirmation signal, which is typically a price breakout from a key level. The general strategy involves entering a trade after the price closes beyond the pattern’s support or resistance boundary, placing a stop-loss order to manage risk, and setting a take-profit target based on the pattern’s measured height. This structured approach helps remove emotional guesswork from trading and provides a consistent framework for execution.
These chart patterns are important because they visually represent the underlying psychology and struggle between buyers and sellers in the market. They offer clues about whether a current trend is likely to continue or reverse, giving traders a probabilistic edge. A pattern like a Double Top suggests that buyers have failed twice to push prices higher, indicating a potential shift in momentum to the sellers. Recognizing this can help you position yourself for the next likely move.
Understanding these patterns begins with classifying them into two main categories: reversal and continuation. Reversal patterns, such as the Head and Shoulders, signal that an existing trend is losing steam and may be about to change direction. Continuation patterns, like Flags and Pennants, suggest the market is simply taking a brief pause before resuming its original trend. This distinction is the first step in applying them correctly to your trading strategy.
What is a Forex Chart Pattern?
A forex chart pattern is a distinct formation created by the movement of currency prices on a chart that helps traders predict potential future price action. These patterns are a cornerstone of technical analysis and are formed by a series of trendlines or curves. Because human behavior and market psychology tend to be repetitive, these geometric shapes appear again and again across different currency pairs and timeframes. Traders use them to identify potential trend reversals or continuations, which can signal valuable trading opportunities.
To understand this better, think of chart patterns as a visual story of the battle between buyers (bulls) and sellers (bears). For example, a series of higher highs and higher lows indicates an uptrend, where buyers are in control. A pattern might form when this control is challenged. If sellers start to resist the price at a certain level, creating a horizontal line of resistance while buyers continue to push up from below, an ascending triangle pattern may form. The resolution of this pattern, typically a breakout to the upside, tells you that the buyers have won the battle and the uptrend is likely to continue.
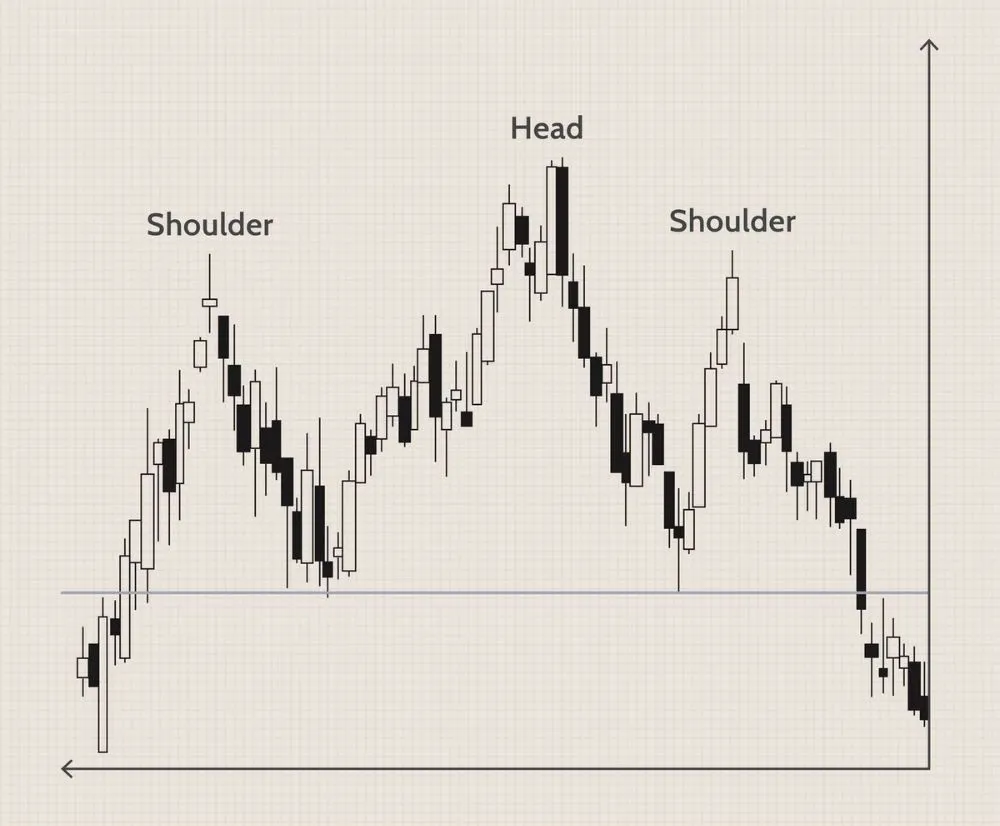
These formations are not magical predictors of the future. Instead, they provide a logical framework based on probabilities. Each pattern has a specific set of rules for identification and trading, including where to enter a trade, where to place a protective stop-loss order, and how to calculate a potential profit target. This structure helps traders manage risk and approach the market with a clear plan rather than trading on impulse or emotion. For instance, the “neckline” in a Head and Shoulders pattern is a critical level of support. A decisive break below this level is the signal to enter a short trade, as it indicates sellers have officially taken control. By learning to recognize these recurring shapes, you can gain insight into market sentiment and improve the timing of your trades.
What are the Two Main Types of Chart Patterns?
The two main types of chart patterns are reversal patterns, which indicate a potential change in the prevailing trend, and continuation patterns, which signal that the current trend will likely resume after a brief pause. This classification is based on what the pattern suggests about the future direction of the price. Recognizing whether a pattern is signaling a reversal or a continuation is fundamental to using it correctly in a trading strategy. Understanding this distinction helps you align your trades with the most probable market outcome.
Here’s the breakdown.
What are Reversal Patterns?
Reversal patterns are formations that signal the end of an existing trend and the beginning of a new one in the opposite direction. These patterns develop after a sustained price move, either up or down, and suggest that the momentum driving the trend is fading. For example, after a long uptrend, the formation of a bearish reversal pattern like a Double Top indicates that buyers are losing steam and sellers are beginning to gain control. The pattern is confirmed when the price breaks a key support level, showing that the shift in power from bulls to bears is complete and a downtrend is likely to start.
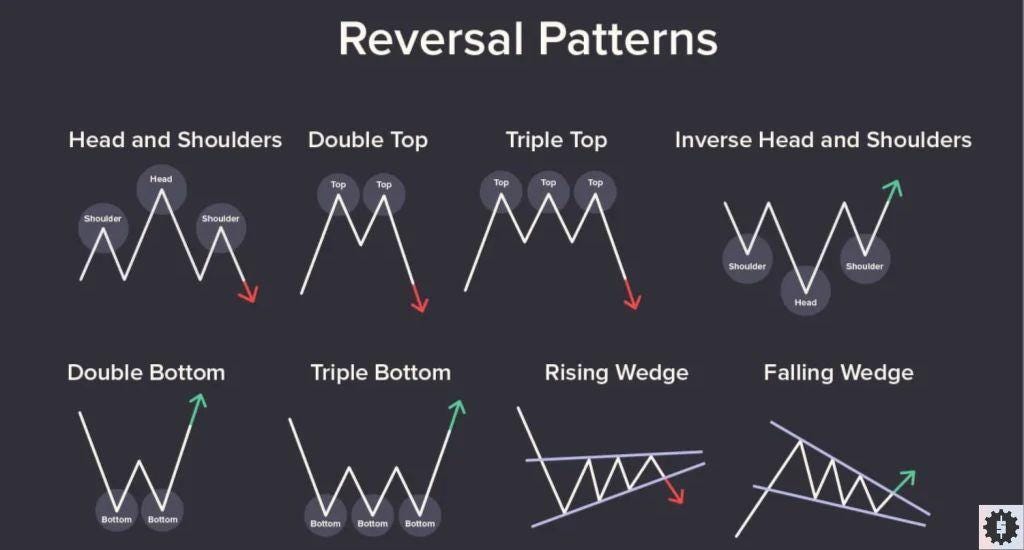
The psychology behind reversal patterns is trend exhaustion. In an uptrend, a pattern like the Head and Shoulders forms because buyers push the price to a new high (the head), but their subsequent attempt fails to reach that same level (the right shoulder). This failure shows weakening conviction among buyers. When the price finally breaks below the support level (the neckline), it confirms that sellers have overpowered the buyers. Famous reversal patterns include:
- Head and Shoulders and Inverse Head and Shoulders: Classic bearish and bullish reversal patterns, respectively.
- Double Tops and Double Bottoms: M-shaped and W-shaped patterns that signal a trend is running out of energy.
- Triple Tops and Triple Bottoms: Similar to doubles but with three peaks or troughs, indicating an even stronger level of resistance or support.
- Rising and Falling Wedges: While sometimes acting as continuation patterns, they often signal reversals when they form against the primary trend.
Trading these patterns requires patience, as you must wait for the pattern to be fully formed and for the price to confirm the reversal with a breakout. Acting too early, before the neckline or key support/resistance is broken, can lead to false signals and losing trades.
What are Continuation Patterns?
Continuation patterns are chart formations that suggest a temporary pause or consolidation within an existing trend, after which the original trend is expected to resume. Unlike reversal patterns that appear at the end of a trend, continuation patterns form in the middle of one. They represent a period where the market is taking a “breather” before continuing its primary direction. For instance, in a strong uptrend, a Bullish Flag might appear. This looks like a small, downward-sloping channel where prices consolidate briefly before breaking out to the upside and continuing the original uptrend.
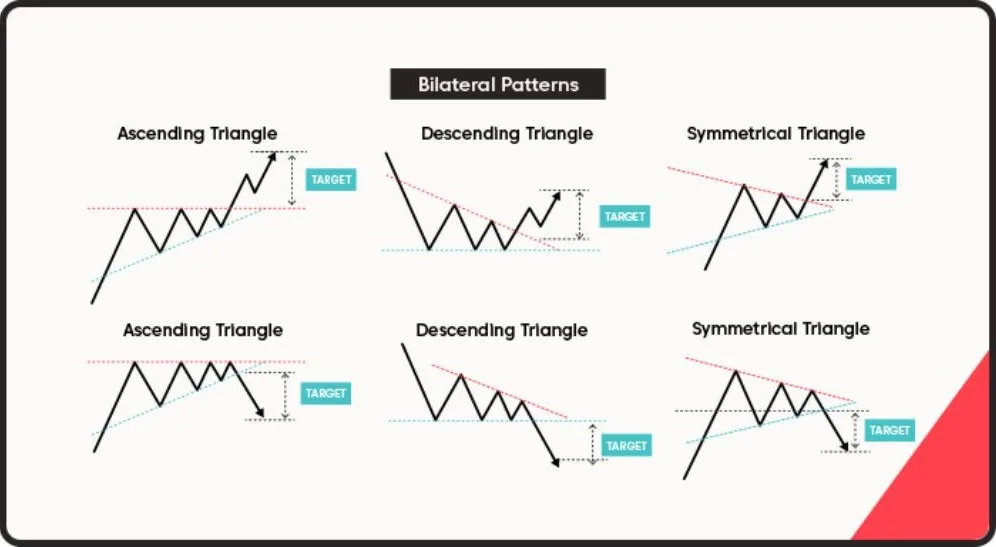
The market psychology here is one of consolidation, not exhaustion. The dominant market force, whether buyers in an uptrend or sellers in a downtrend, is still in control. The pattern simply reflects a brief period of profit-taking or indecision before more participants join the prevailing trend. Volume typically decreases during the formation of a continuation pattern and then increases sharply on the breakout, confirming that the trend is back in motion. Common continuation patterns include:
- Flags (Bullish and Bearish): Short-term patterns that look like small rectangles angled against the main trend.
- Pennants (Bullish and Bearish): Similar to flags but form a small, symmetrical triangle after a sharp price move.
- Triangles (Ascending, Descending, and Symmetrical): These represent a battle between buyers and sellers, with the breakout direction often following the preceding trend.
-gaps Rectangles: Formed when the price moves sideways between parallel support and resistance levels before breaking out in the direction of the prior trend.
When trading continuation patterns, the goal is to enter the market in the direction of the original trend as soon as the price breaks out of the consolidation area. These patterns often provide excellent risk-to-reward opportunities because the consolidation period is usually short and the subsequent move can be powerful.
What are the Top 5 Forex Chart Patterns Every Trader Should Know?
The top five forex chart patterns every trader should know are the Head and Shoulders, the Double Top and Double Bottom, Bullish and Bearish Flags, Ascending and Descending Triangles, and the Pennant pattern. These patterns are favored by technical analysts because they appear frequently across various currency pairs and timeframes, and they provide clear, actionable trading plans with defined entry points, stop-loss levels, and profit targets. Mastering their identification and execution can significantly enhance a trader’s ability to read the market and anticipate price movements.
Let’s explore each of these patterns in detail.
What is the Head and Shoulders Pattern?
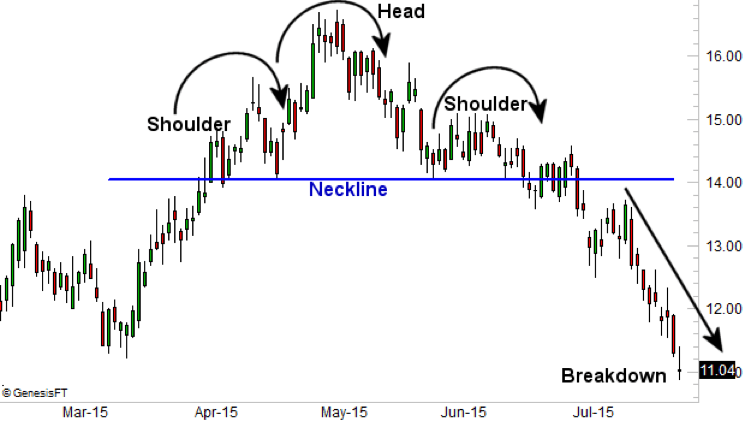
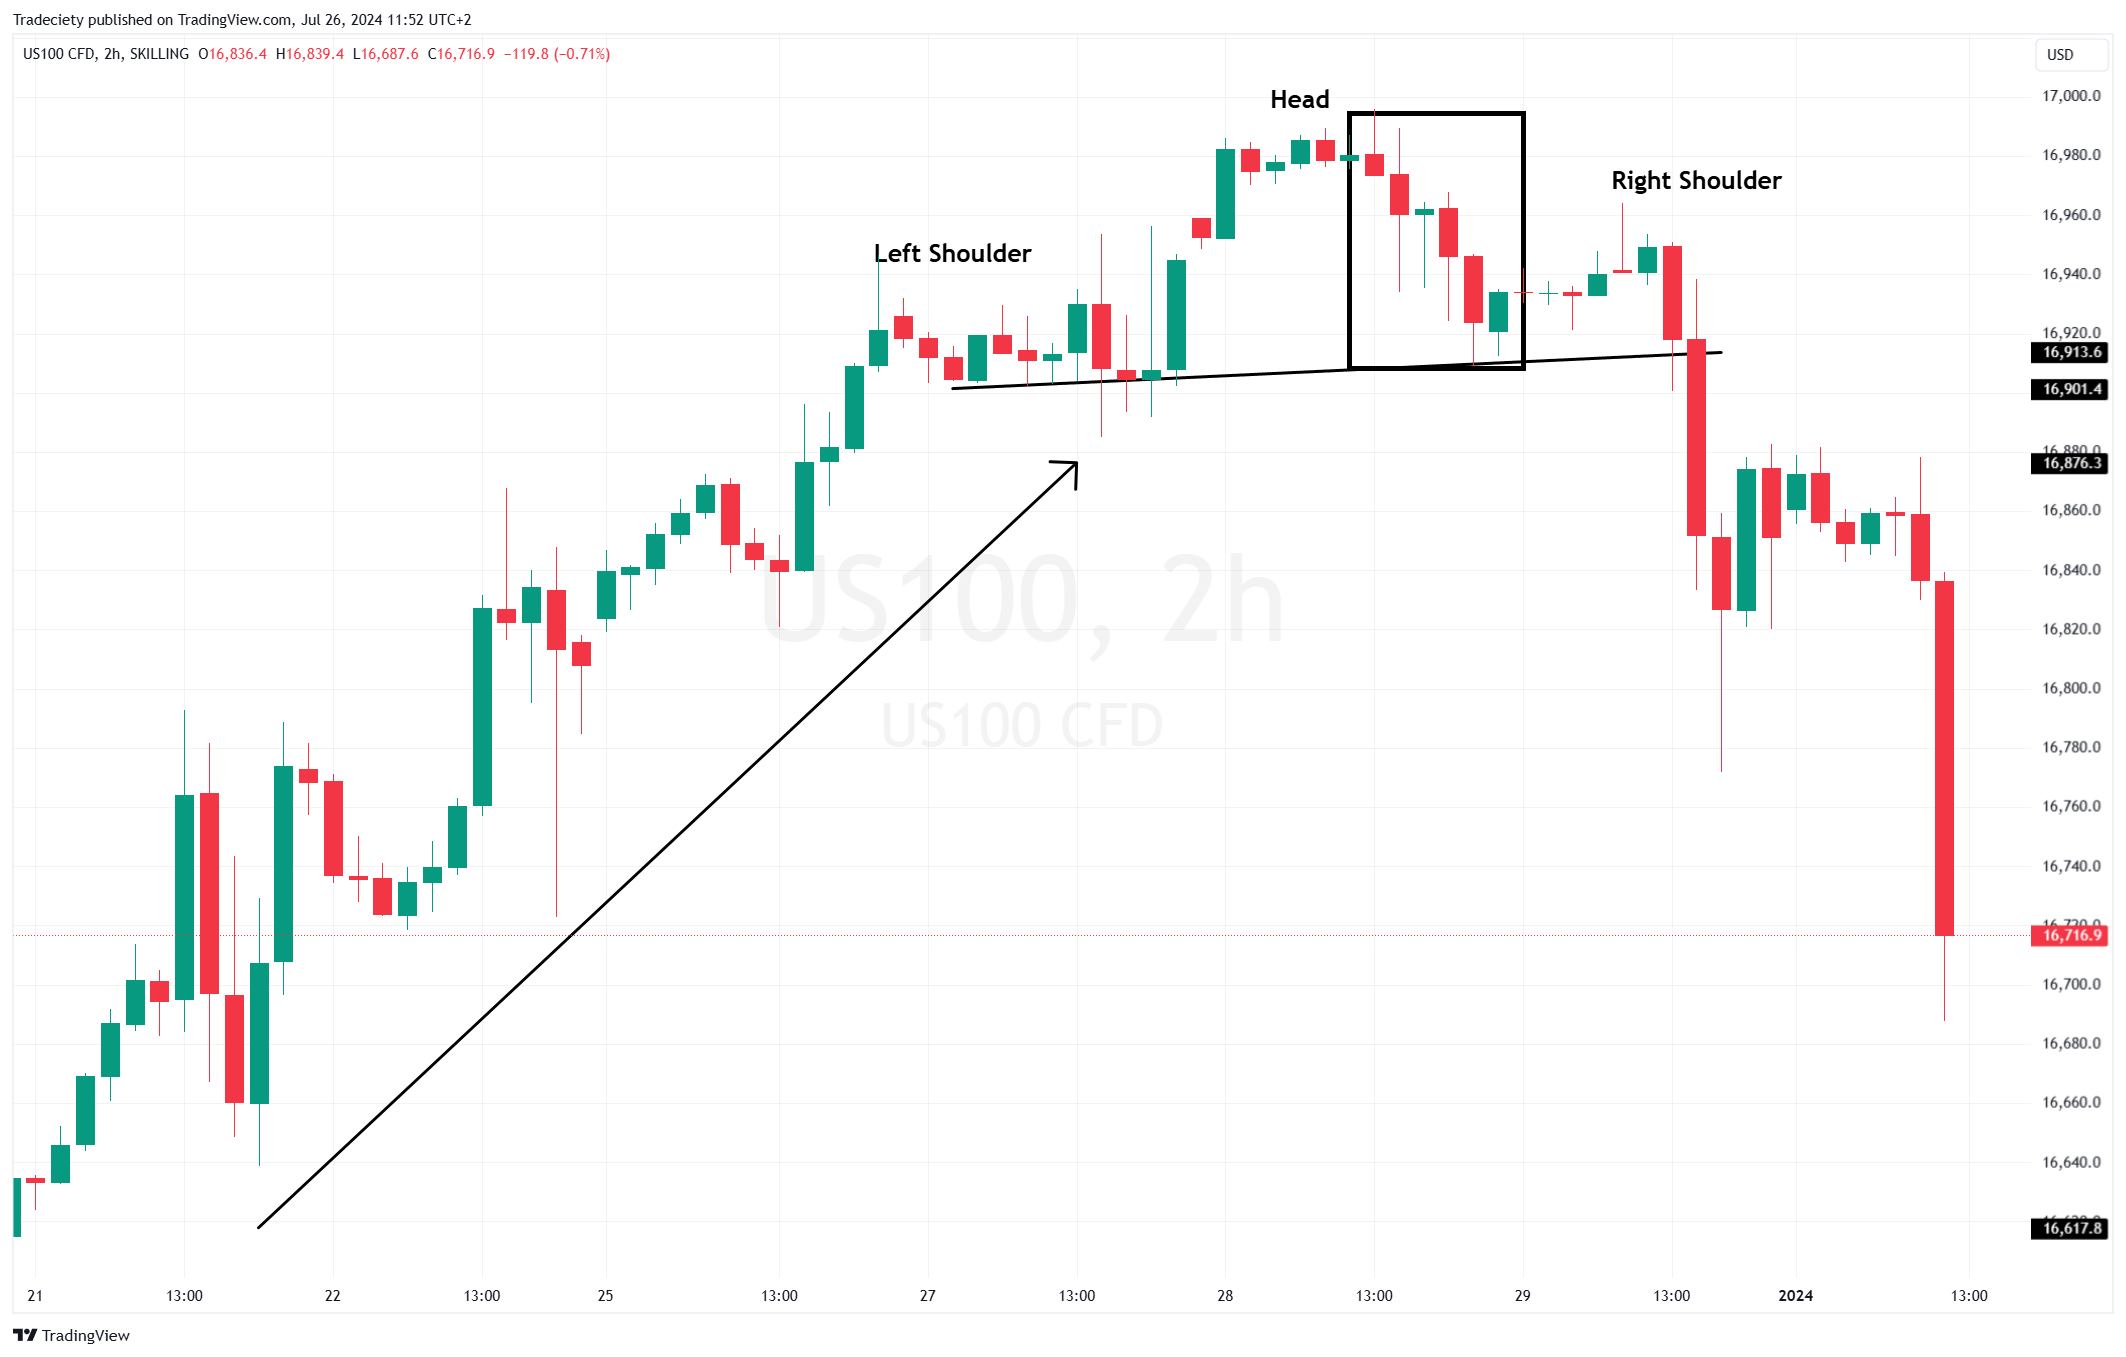
The Head and Shoulders is a classic bearish reversal pattern that signals a potential end to an uptrend and the beginning of a new downtrend. It is composed of three peaks: a central peak (the head) that is higher than the two surrounding peaks (the left and right shoulders). A “neckline” is drawn by connecting the lowest points of the two troughs between the three peaks. This neckline acts as a critical support level. The formation of the right shoulder, which is lower than the head, indicates that buying pressure is weakening and unable to push the price to a new high.
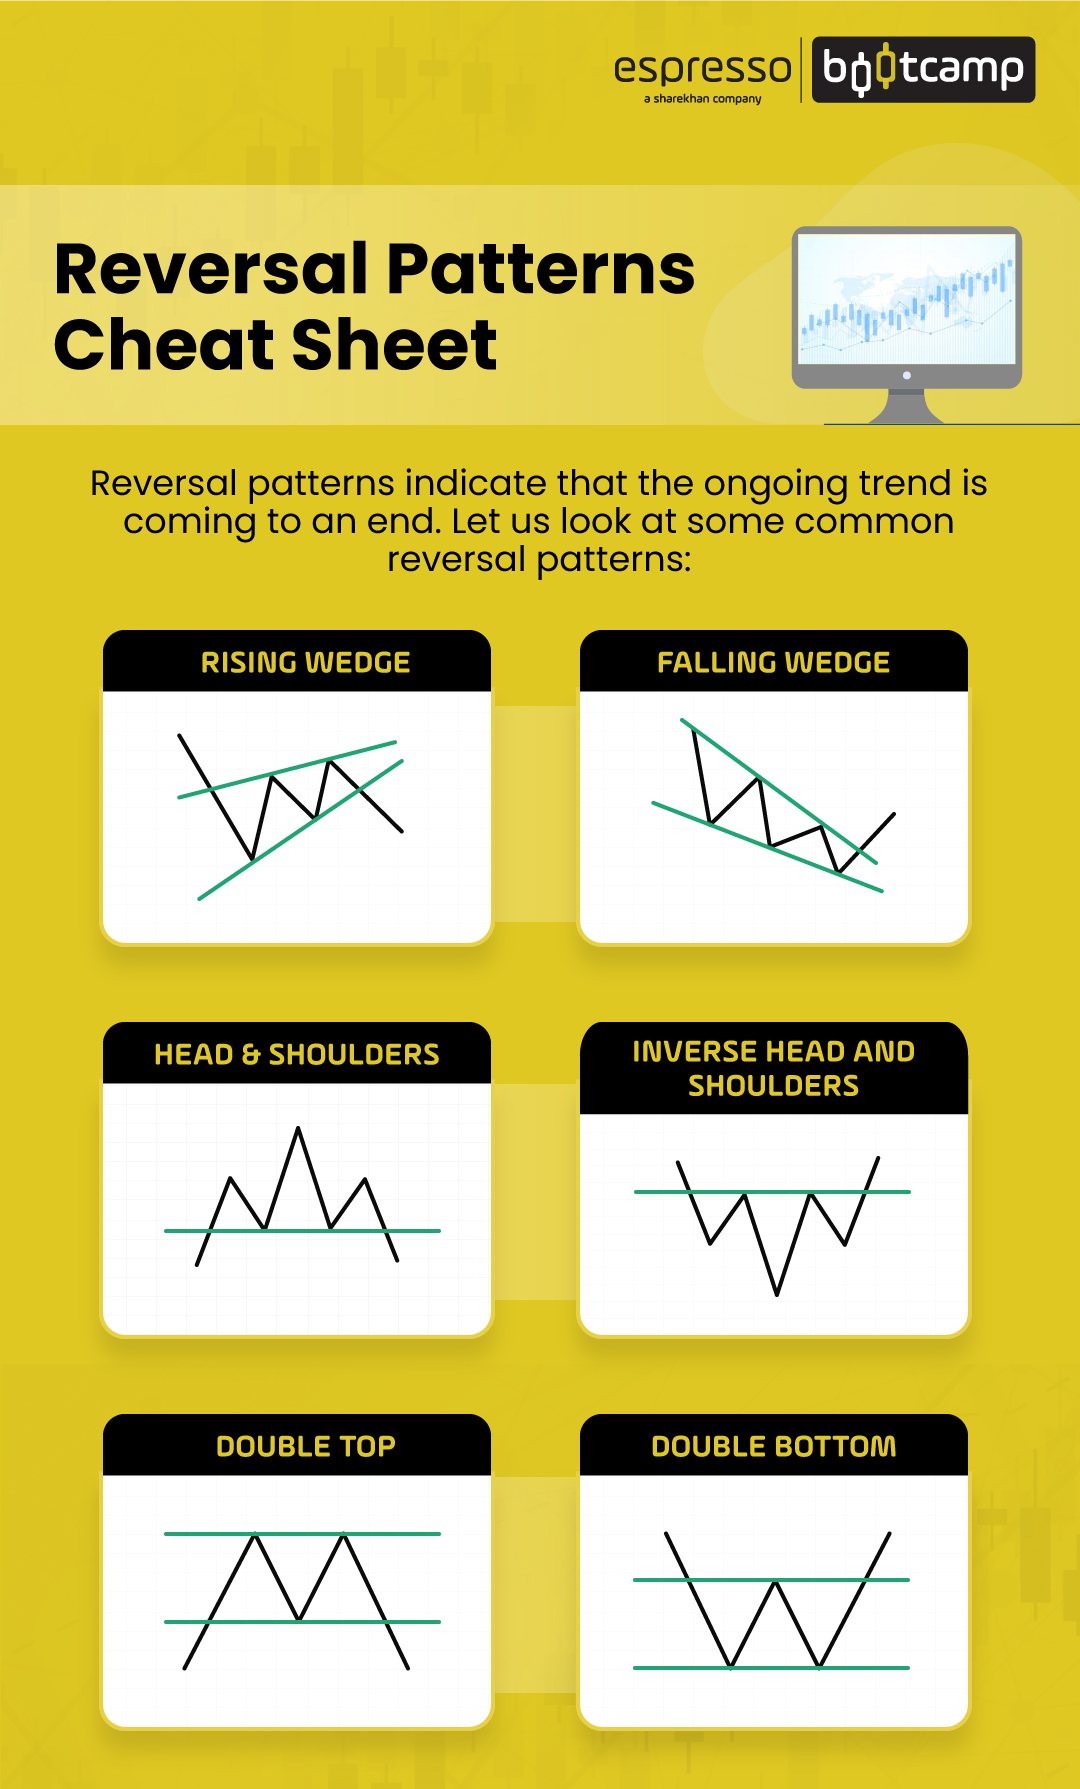
The trading strategy for a Head and Shoulders pattern is straightforward:
1. Identification: Spot the three-peak structure in an existing uptrend and draw the neckline.
2. Entry Signal: The primary signal to enter a short (sell) position occurs when the price breaks below and closes below the neckline. This confirms that the uptrend has failed and sellers are now in control. Some traders wait for a small pullback to the broken neckline before entering, as this can offer a better risk-to-reward ratio.
3. Stop-Loss: To manage risk, a stop-loss order is typically placed just above the high of the right shoulder. This ensures that if the pattern fails and the price reverses back up, your loss is limited.
4. Take-Profit Target: The potential profit target is calculated by measuring the vertical distance from the top of the head down to the neckline. This distance is then projected downward from the point where the price broke the neckline.
An Inverse Head and Shoulders is the bullish version of this pattern. It appears at the bottom of a downtrend, is flipped upside down, and signals a potential reversal to an uptrend. The trading rules are the same but in reverse: you would look to buy on a breakout above the neckline.
What is the Double Top and Double Bottom Pattern?
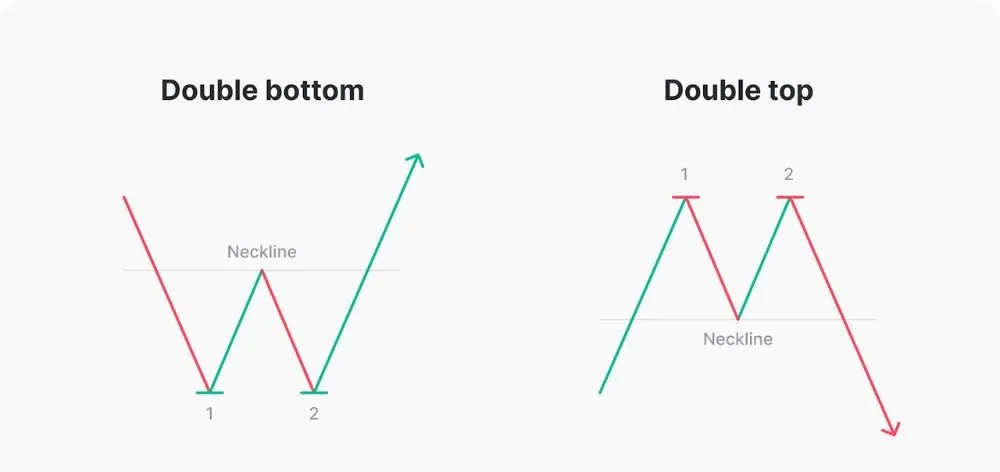
The Double Top and Double Bottom are powerful reversal patterns that indicate a potential trend change. The Double Top is a bearish pattern that looks like the letter “M.” It forms after an extended uptrend when the price hits a resistance level, pulls back, and then rallies again to the same resistance level but fails to break through. This second failure to create a new high shows that the buying momentum is gone. The entry signal is a break below the support level formed by the trough between the two peaks. The strategy is to sell on the breakout, with a stop-loss above the peaks and a profit target equal to the height of the pattern projected downwards.

Conversely, the Double Bottom is a bullish reversal pattern that resembles the letter “W.” It appears at the end of a downtrend when the price hits a support level, rallies, pulls back to the same support level, and fails to break lower. This second bounce off support suggests that selling pressure is exhausted and buyers are stepping in. The trading strategy is to buy when the price breaks above the resistance level formed by the peak between the two troughs. The stop-loss is placed below the two bottoms, and the profit target is measured as the distance from the bottoms to the resistance line, projected upwards from the breakout point. Both patterns are highly effective because they clearly define key support and resistance levels, making entry and exit points easy to identify.
What are the Bullish and Bearish Flag Patterns?
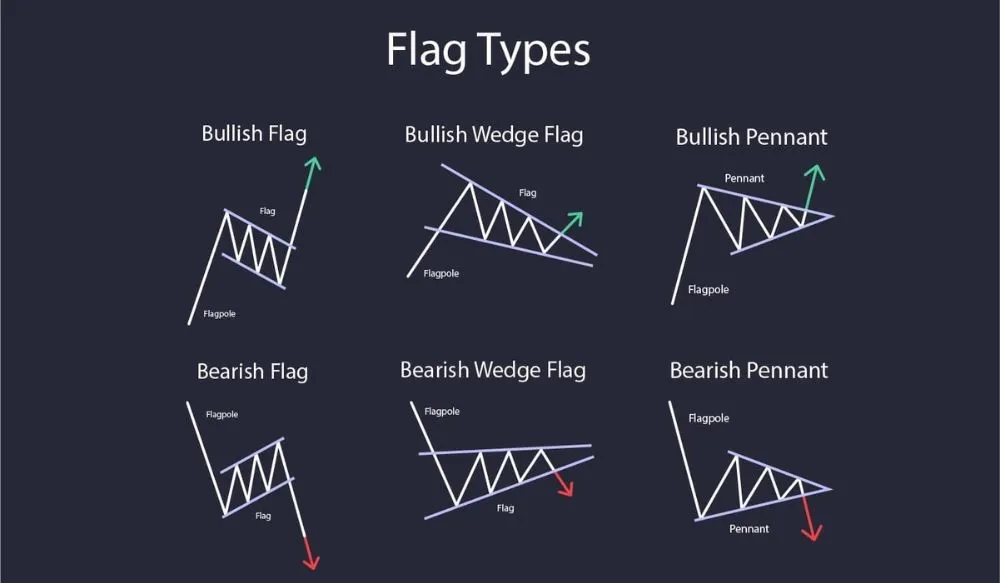
Bullish and Bearish Flags are short-term continuation patterns that signal the market is likely to continue in its prevailing direction after a brief consolidation. The pattern consists of two main parts: the “flagpole” and the “flag.” The flagpole is a strong, sharp price move that forms the initial part of the trend. The flag is a small, rectangular consolidation period that follows the flagpole, typically slanting against the direction of the main trend.

A Bullish Flag forms during an uptrend. You’ll see a sharp move up (the flagpole), followed by a period of slight downward consolidation (the flag). This pause indicates that some traders are taking profits, but new buyers are ready to push the price higher. The trading strategy is to wait for the price to break out above the upper trendline of the flag channel.
- Entry: Buy on a decisive close above the flag’s upper resistance line.
- Stop-Loss: Place it just below the lowest point of the flag channel.
- Take-Profit: Measure the length of the flagpole and project that distance upward from the breakout point.
A Bearish Flag is the opposite. It occurs in a downtrend and consists of a sharp move down (the flagpole) followed by a slight upward consolidation (the flag). This signals a temporary pause before sellers push the price lower again. The strategy is to sell when the price breaks below the lower support line of the flag, with a stop-loss above the flag’s high and a profit target measured from the flagpole.
What is the Ascending and Descending Triangle Pattern?
Ascending and Descending Triangles are continuation patterns that signal a likely continuation of the current trend. An Ascending Triangle is considered a bullish pattern. It is formed by a horizontal resistance line at the top and a rising trendline connecting a series of higher lows at the bottom. This pattern shows that while there is resistance at a certain price level, the buying pressure is consistently increasing, as indicated by the higher lows. This buildup of pressure often leads to an upside breakout. The trading strategy is to place a buy order on a breakout and close above the horizontal resistance line. A stop-loss can be placed below the rising trendline, and the profit target is calculated by measuring the height of the triangle at its widest part and projecting that distance up from the breakout point.
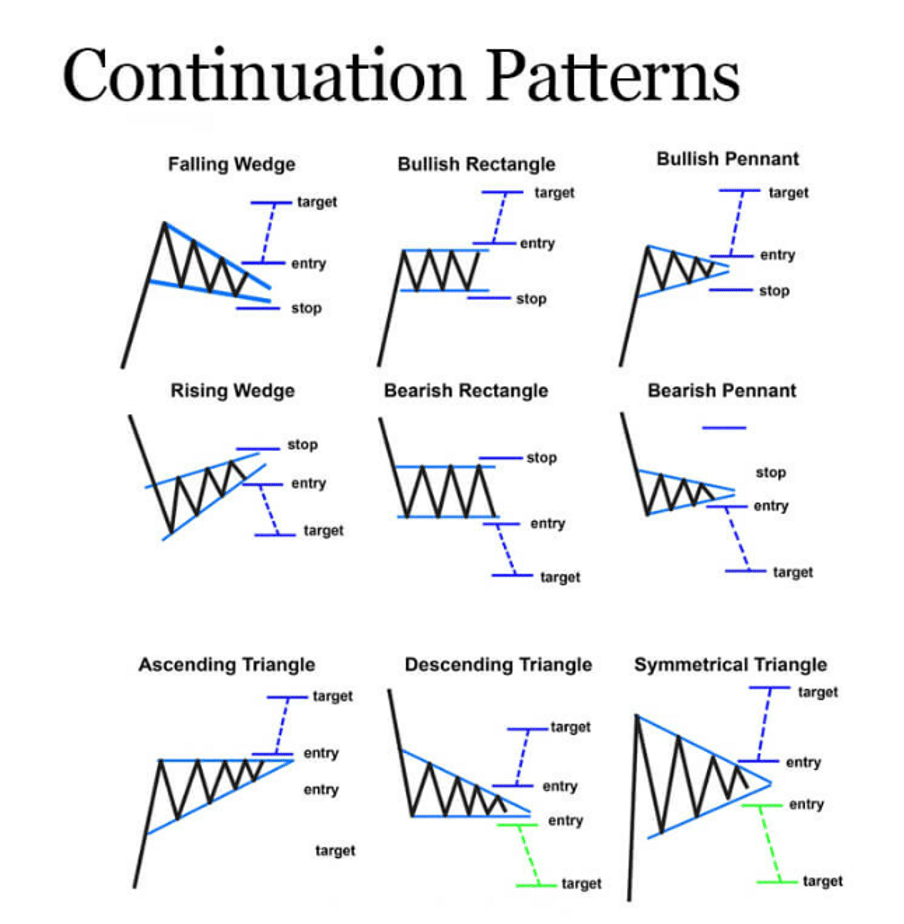
A Descending Triangle is the bearish counterpart. It is formed by a horizontal support line at the bottom and a falling trendline connecting a series of lower highs at the top. This pattern suggests that while there is support at a certain level, selling pressure is growing, as shown by the lower highs. This often results in a downside breakout. The strategy is to place a sell order on a breakout and close below the horizontal support line. The stop-loss goes above the falling trendline, and the profit target is the height of the triangle projected downward from the breakout point.
What is the Pennant Pattern?
A Pennant is a short-term continuation pattern that looks very similar to a Flag, but the consolidation phase is a small, symmetrical triangle rather than a rectangle. Like a flag, a pennant always starts with a strong, sharp price move called the flagpole. After this move, the price consolidates between two converging trendlines, forming a small triangle or “pennant.” This consolidation phase represents a brief pause in the market before the trend continues. Pennants are typically short-lived, lasting from a few days to a few weeks.
A Bullish Pennant forms during an uptrend. After a strong upward flagpole, the price consolidates within converging lines. The trading strategy is to buy when the price breaks out above the upper trendline of the pennant. The stop-loss is placed just below the lowest point of the pennant formation. The profit target is usually determined by measuring the length of the initial flagpole and projecting it upwards from the breakout point, similar to a flag pattern.
A Bearish Pennant forms during a downtrend. After a sharp downward flagpole, the price consolidates briefly between converging support and resistance lines. The trading strategy is to sell when the price breaks out below the lower trendline of the pennant. The stop-loss is placed just above the highest point of the pennant, and the take-profit target is calculated by projecting the length of the flagpole downward from the breakout point.
How Do You Confirm a Chart Pattern’s Signal?
You can confirm a chart pattern’s signal by using secondary technical analysis tools, primarily trading volume and other indicators like moving averages, to validate the breakout. Relying solely on the visual pattern can lead to false signals, also known as “fakeouts,” where the price breaks out briefly only to reverse back into the pattern. Confirmation adds an extra layer of confidence to a trade, increasing the probability that the breakout is genuine and that the predicted price move will follow through.
To understand this better, a chart pattern identifies a potential opportunity, but confirmation tools help you verify if that opportunity is strong enough to act on. It is about gathering more evidence before committing capital to a trade. A breakout from a pattern is the initial signal, but a surge in volume on that breakout or a supportive signal from another indicator provides the confirmation that strengthens your trading decision.
How Can Volume be Used for Confirmation?
Volume is one of the most powerful tools for confirming a chart pattern’s breakout because it represents the level of conviction or participation behind a price move. A breakout that occurs on high or increasing volume is considered much more significant and reliable than one that happens on low or declining volume. High volume suggests strong agreement among market participants that the price should move in the direction of the breakout. In contrast, a low-volume breakout indicates a lack of interest and is more likely to fail.
For example, when trading a bullish continuation pattern like an Ascending Triangle, you should see volume decrease as the triangle forms and the price range tightens. This represents a period of consolidation and indecision. The key confirmation signal is a sudden, sharp increase in volume as the price breaks out above the horizontal resistance line. This volume spike tells you that a large number of buyers have entered the market, providing the momentum needed to sustain the new upward move. If the breakout happens on weak volume, it is a warning sign that the move may lack strength and could quickly reverse. The same principle applies in reverse for bearish patterns; a breakout below support on high volume confirms strong selling pressure.
How Can Moving Averages be Used for Confirmation?
Moving averages (MAs) are excellent confirmation tools because they help identify the underlying trend and act as dynamic levels of support and resistance. You can use them to validate a breakout signal from a chart pattern. For instance, if you identify a bullish reversal pattern like a Double Bottom, you can look for additional confirmation from a moving average. A stronger signal occurs if the breakout above the pattern’s resistance level also coincides with the price crossing above a key moving average, such as the 50-period or 200-period MA. This shows that both the short-term price action (the pattern) and the longer-term trend indicator (the MA) are aligning in a bullish direction.
Another way to use moving averages is to watch for crossovers. A “golden cross” occurs when a shorter-term MA (like the 50-day) crosses above a longer-term MA (like the 200-day), which is a strong bullish signal. If this crossover happens around the same time as a breakout from a bullish pattern, it provides powerful confirmation. Conversely, a “death cross” (50-day MA crossing below the 200-day MA) can confirm a breakout from a bearish pattern like a Head and Shoulders. By combining chart patterns with moving averages, you can filter out weaker signals and focus on trades with a higher probability of success.
What Other Advanced Concepts Relate to Chart Patterns?
Advanced concepts related to chart patterns include their probabilistic reliability, common trading mistakes, ideal timeframes for identification, the key differences from candlestick patterns, and their effectiveness across various market conditions. Furthermore, a deeper understanding of these areas is what separates novice traders from experienced technical analysts who use patterns as part of a complete trading system. By moving beyond simple identification, you can apply these powerful tools with greater context and precision, improving your ability to filter high-probability setups from market noise. These related topics help build a robust framework for decision making, ensuring that chart analysis is not used in isolation but is instead integrated with sound risk management and market awareness.
How Reliable are Forex Chart Patterns?
The reliability of forex chart patterns is entirely probabilistic, meaning no single pattern guarantees a specific outcome. Think of them as indicators of higher probability, not as certainties. Their effectiveness is heavily influenced by several factors, turning pattern trading into an art of context rather than a rigid science. Market conditions play a huge role; patterns identified during strong trending periods tend to be more reliable than those appearing in choppy, sideways markets. For instance, a bullish flag is more likely to resolve to the upside when the overall market trend for that currency pair is already bullish. The timeframe you are trading on also affects reliability. Patterns on higher timeframes like the daily or weekly charts are generally more dependable because they are formed from a larger volume of transactions and represent a more significant shift in market sentiment.

To properly assess and use these patterns, traders must combine them with other forms of analysis.
- Confirmation: A pattern’s signal is stronger when confirmed by other indicators. For example, a bearish head and shoulders pattern is more convincing if the right shoulder forms on declining volume and a momentum indicator like the RSI shows bearish divergence.
- Asset Characteristics: The liquidity and volatility of a specific forex pair can influence pattern clarity. Major pairs like EUR/USD or GBP/USD often produce cleaner patterns than less liquid, exotic pairs.
- Statistical Backtesting: Experienced traders often backtest the performance of specific patterns on certain assets and timeframes to develop their own statistical models for reliability.
What are the Most Common Mistakes When Trading Chart Patterns?
One of the most frequent errors traders make is acting on a pattern before it has fully completed its formation. A trader might see what looks like a head and shoulders pattern and enter a short position before the price has decisively broken below the neckline. This premature entry, driven by a fear of missing out, often leads to losses if the pattern fails to confirm and price reverses. Another common pitfall is ignoring the importance of volume. A breakout from a triangle or rectangle pattern on low trading volume is a major red flag, suggesting a lack of conviction behind the move. A genuine breakout should ideally be accompanied by a surge in volume, which confirms institutional participation and strengthens the signal. Misidentifying patterns is also a significant issue, where traders force a pattern onto price action that doesn’t quite fit the criteria, leading to flawed analysis.

Ultimately, the biggest mistake is abandoning sound risk management principles.
- No Stop-Loss: Entering a trade based on a pattern without placing a protective stop-loss is a recipe for disaster. A stop-loss should be placed at a logical level, such as above the right shoulder in a head and shoulders pattern.
- Poor Risk-to-Reward Ratio: Some traders take trades where the potential profit, based on the pattern’s measured move, is not significantly greater than the potential loss, violating a core principle of successful trading.
- Ignoring the Broader Context: Focusing exclusively on a small pattern on a 5-minute chart while ignoring a major support or resistance level on the daily chart can lead to failed trades.
Which Timeframes are Best for Identifying Chart Patterns?
Chart patterns can be found on any timeframe, from a one-minute chart used by scalpers to a weekly chart analyzed by position traders. However, the reliability and significance of these patterns vary greatly with the timeframe. Generally, patterns identified on higher timeframes, such as the 4-hour, daily, and weekly charts, are considered more robust and dependable. This is because they are composed of more price data and represent a larger and more sustained struggle between buyers and sellers. A breakout from a multi-month consolidation pattern on a weekly chart reflects a fundamental shift in market psychology and carries far more weight than a similar pattern that forms over 30 minutes. These longer-term patterns filter out the intraday market noise, providing clearer signals about the primary trend direction.
Trading on higher timeframes allows for more strategic planning and reduces the stress associated with rapid, lower-timeframe price fluctuations.
- Clarity and Reduced Noise: Daily and weekly charts smooth out minor price movements, making the underlying patterns like triangles, wedges, and head and shoulders easier to identify correctly.
- More Significant Moves: A confirmed breakout from a pattern on a higher timeframe typically leads to a more substantial and longer-lasting price move, offering better risk-to-reward opportunities.
- Time for Analysis: Slower-moving charts give you more time to analyze a potential setup, seek confirmation from other indicators, and plan your entry, stop-loss, and take-profit levels without rushing.
What is the Difference Between Chart Patterns and Candlestick Patterns?
The primary difference between chart patterns and candlestick patterns lies in their scope and duration. Chart patterns are large-scale formations created by price swings over dozens or hundreds of candles, while candlestick patterns are small-scale signals formed by just one to a few candles. Think of chart patterns as telling the overall story of the market’s structure, revealing longer-term sentiment shifts between bulls and bears. Examples like the Head and Shoulders, Double Top, or Triangle patterns can take weeks or even months to develop on a daily chart. Their purpose is to forecast major trend reversals or continuations and provide price targets for large moves. They represent the “macro” view of price action, showing where key structural battles have been fought.

Candlestick patterns, in contrast, provide a “micro” view. They offer short-term insights into the immediate momentum and psychology of the market. A pattern like a Hammer, Doji, or Bullish Engulfing signals a potential price turn over the next few price bars. These patterns are tactical tools often used by traders to time their entries and exits with more precision. For example, a trader might wait for a bullish candlestick pattern to form near the support trendline of a larger ascending triangle chart pattern before entering a long position. In this way, the two types of patterns work together harmoniously.
This symbiotic relationship is key to effective technical analysis.
- Chart Patterns (Strategic): Identify the overall market structure and potential long-term direction (e.g., a large symmetrical triangle suggesting an impending breakout).
- Candlestick Patterns (Tactical): Provide the specific entry trigger within that larger structure (e.g., a bullish engulfing candle at the triangle’s lower trendline).
- Time Scale: Chart patterns analyze collective price action over an extended period, while candlestick patterns analyze the price action of just a few sessions.
Are Chart Patterns Effective in All Market Conditions?
Chart patterns are not universally effective; their reliability is highly dependent on the prevailing market condition. They are most powerful and predictive in markets that are either clearly trending or experiencing high volatility. In a strong uptrend or downtrend, continuation patterns like flags, pennants, and wedges are extremely useful for identifying high-probability entry points to join the trend after a brief pause. Similarly, reversal patterns like double tops and bottoms are most effective at the peak of a long trend, as they signal exhaustion and a potential major shift in direction. Volatility is also a key ingredient because it creates the significant price swings necessary to carve out clean, recognizable patterns. Without meaningful price movement, the structures cannot form properly.
Conversely, chart patterns tend to be far less reliable in low-volatility, ranging, or “choppy” markets. When price is stuck in a tight, directionless consolidation, patterns can be ill-defined and produce frequent false signals. A breakout from a small triangle in a sideways market may lack the momentum to follow through, quickly reversing and trapping traders. In these environments, price action is often random and noisy, making it difficult to discern any meaningful structure. Traders may find that other tools, such as oscillators like the Relative Strength Index (RSI) or Stochastics, are better suited for identifying overbought and oversold conditions within the range.
The effectiveness of chart patterns is tied directly to market behavior.
- Trending Markets: Ideal for continuation patterns (flags, pennants) and reversal patterns at the trend’s conclusion.
- Volatile Markets: Necessary for creating the clear price highs and lows that form the building blocks of any pattern.
- Ranging Markets: Patterns are often poorly formed and produce unreliable breakouts. Range-bound trading strategies are generally more suitable here.