

Blog
How to Trade Forex Using the Fibonacci Retracement Tool?

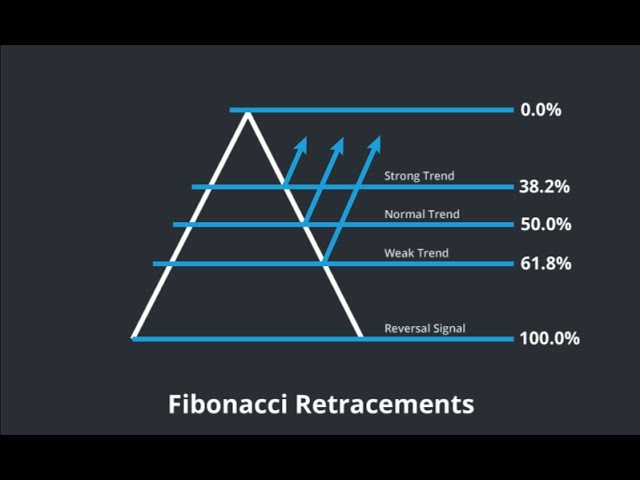
To trade Forex using the Fibonacci retracement tool, you first identify a clear trend, draw the tool from the beginning of a price move (Swing Low) to the end of the move (Swing High) in an uptrend, and then wait for the price to pull back to a key Fibonacci level like 38.2% or 61.8% before entering a trade in the direction of the original trend. This method helps traders find high-probability entry points during temporary price corrections within a larger market trend. It relies on the idea that markets rarely move in a straight line and these predictable pullbacks offer opportunities to join the prevailing momentum at a better price.
The most widely used Fibonacci retracement levels in Forex are 23.6%, 38.2%, 50%, 61.8%, and 78.6%. While the 50% level is not an official ratio from the Fibonacci sequence, traders include it because of its psychological importance as a halfway point of a price move, often acting as a strong area of support or resistance. The 61.8% level, also known as the “Golden Ratio,” is often considered the most significant retracement level for spotting potential trend reversals or continuations.
To draw the tool correctly, you must first identify a distinct and sustained price move, known as a swing. In a clear uptrend, you connect the tool from the lowest point of the move (the Swing Low) to the highest point (the Swing High). Conversely, in a downtrend, you connect it from the highest point (Swing High) to the lowest point (Swing Low). This correct application ensures the horizontal lines representing the key Fibonacci levels appear on your chart in the path of the price correction.
Using this tool provides a structured framework for making trading decisions. It helps remove emotional guesswork by providing clear, mathematically derived zones where buying or selling pressure may emerge. By combining these levels with other forms of analysis, such as candlestick patterns or momentum indicators, traders can build a robust strategy for navigating the Forex markets. Let’s explore the specifics of how to apply this powerful tool from start to finish.
What Is the Fibonacci Retracement Tool in Forex Trading?
The Fibonacci retracement tool is a technical analysis indicator that uses key ratios derived from the Fibonacci sequence to identify potential support and resistance levels on a price chart. It is built on the mathematical principles discovered by Leonardo Fibonacci, where a sequence of numbers is created by adding the two preceding numbers (0, 1, 1, 2, 3, 5, 8, 13, 21, etc.). The magic happens when you divide a number in the sequence by the one that follows it, which consistently approximates 0.618, or 61.8%. This “Golden Ratio” and other related ratios form the foundation of the levels traders watch.
In detail, this tool helps traders anticipate where a price pullback might end before the main trend continues. For instance, if the EUR/USD pair is in a strong uptrend and moves from 1.0700 to 1.0800, it is unlikely to keep rising without a brief pause or a small downward correction. Traders use the Fibonacci retracement tool to project where this correction might find support before the price turns back up. The horizontal lines drawn by the tool act as potential floors (support) or ceilings (resistance) that can guide entry, stop-loss, and take-profit decisions. It is not a predictive magic wand but rather a probabilistic tool that highlights areas of high interest where a reaction in price is more likely to occur.
What Are the Key Fibonacci Retracement Levels?
The key Fibonacci retracement levels are a set of horizontal lines indicating potential areas of support or resistance. Each level corresponds to a percentage of the prior price move. The primary levels used by traders are:

- 23.6%: This is the first and shallowest retracement level. A pullback that reverses at this level often signals a very strong trend, as the market is eager to continue in its original direction without much of a price correction.
- 38.2%: This is a more moderate retracement level and is closely watched by many market participants. If the price finds support or resistance here, it suggests the underlying trend remains healthy and has a good chance of resuming.
- 50%: Although not an official Fibonacci ratio, the 50% level is included in nearly every Fibonacci tool because it represents the halfway point of a price move. It is a powerful psychological level where a balanced struggle between buyers and sellers often takes place. A bounce from this level is a common scenario in many trading strategies.
- 61.8%: Often called the “Golden Ratio,” this is arguably the most important Fibonacci level. A deep pullback that finds support or resistance at 61.8% can present a very attractive entry point, as it offers a chance to join the trend at a significant discount. A price move that goes beyond this level may indicate that the original trend is weakening.
- 78.6%: This is a deep retracement level, representing the square root of 0.618. It is often the last line of defense for the original trend. If the price pulls back this far and reverses, it can still be a valid entry. However, if the price breaks through this level, it increases the probability that the trend is reversing entirely.
Why Are These Levels Important in Trading?
These levels are important because they represent areas where the natural ebb and flow of the market may cause a price pullback to pause or reverse direction. Their power comes from a combination of mathematical theory and mass psychology. Since millions of traders, from retail investors to large institutional funds, are watching these same levels on their charts, they can become self-fulfilling prophecies. When a price approaches a key Fibonacci level, many traders will place buy or sell orders there, which in turn creates actual support or resistance.
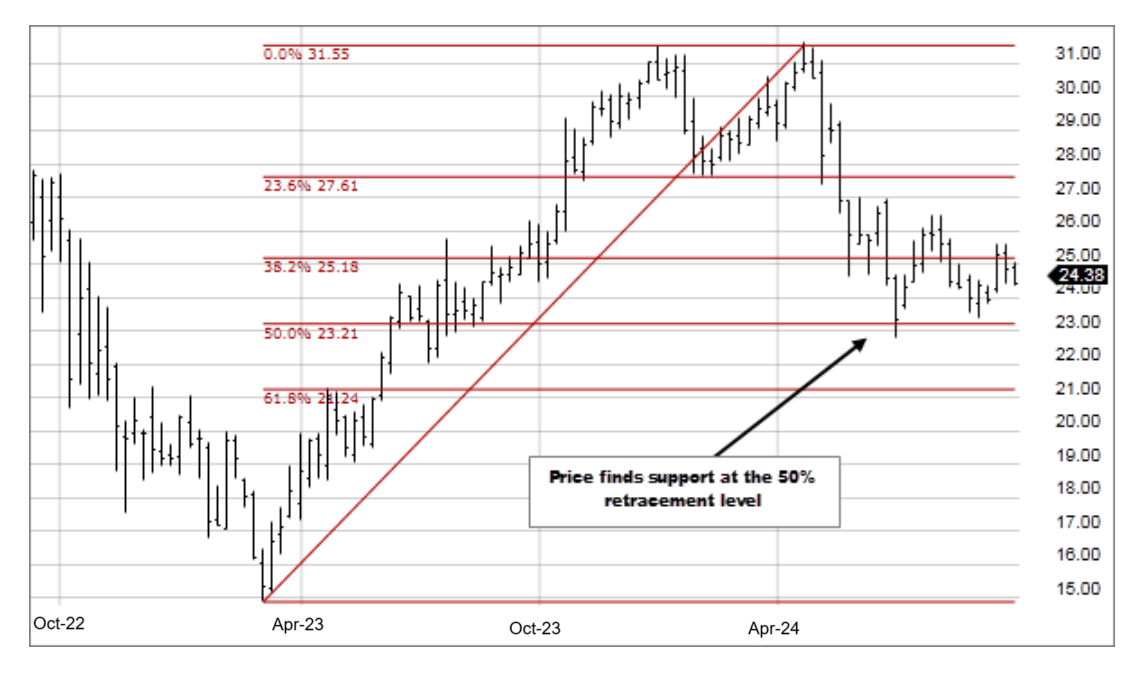
For example, during an uptrend, as the price pulls back to the 61.8% level, traders who missed the initial move up see it as a second chance to buy at a lower price. At the same time, traders who were shorting the market might use this level to take profits. This convergence of buying interest creates a floor under the price, often causing it to bounce and resume the uptrend. In a downtrend, the opposite occurs at these levels, as they become resistance points where sellers enter the market. The widespread use of these levels across different markets and timeframes adds to their reliability, making them a cornerstone of technical analysis for many traders around the world.
How Do You Draw Fibonacci Retracement Levels on a Forex Chart?
To draw Fibonacci retracement levels, you first identify a clear price trend and then connect its starting point (Swing Low) to its ending point (Swing High) in an uptrend, or vice versa in a downtrend, using your trading platform’s tool. This action overlays a grid of horizontal lines on your chart at the key Fibonacci percentages, showing potential areas for a price correction. The accuracy of these levels is entirely dependent on correctly identifying the significant price move you are measuring.
Here’s the breakdown. The core of this process is finding the right “swing” to measure. A common mistake beginners make is applying the tool to minor, insignificant price fluctuations. For the levels to be meaningful, you need to apply them to a clear, sustained, and obvious move up or down. Think of it as measuring a major wave, not the small ripples on top of it. Once you have identified this wave, using the tool is a simple two-click process on platforms like MetaTrader 4, MetaTrader 5, or TradingView. The key is knowing exactly where to place those two clicks: the absolute beginning and the absolute end of the primary price move.
How Do You Identify the Correct Swing High and Swing Low?
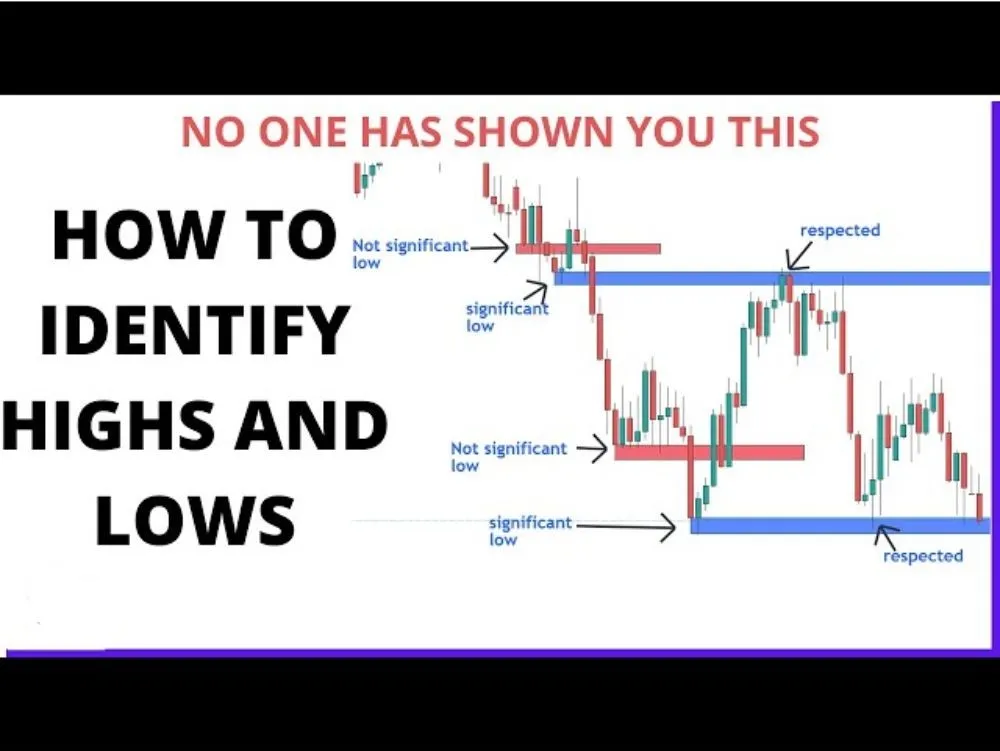
Identifying the correct Swing High and Swing Low is the most critical step for accurately applying the Fibonacci tool. A “Swing High” is a peak in the price, which is technically defined as a candle that has a lower high on both its immediate left and right sides. Visually, it looks like a small mountain peak on your chart. It represents a point where buying pressure temporarily exhausted, and sellers took control, causing the price to turn down.
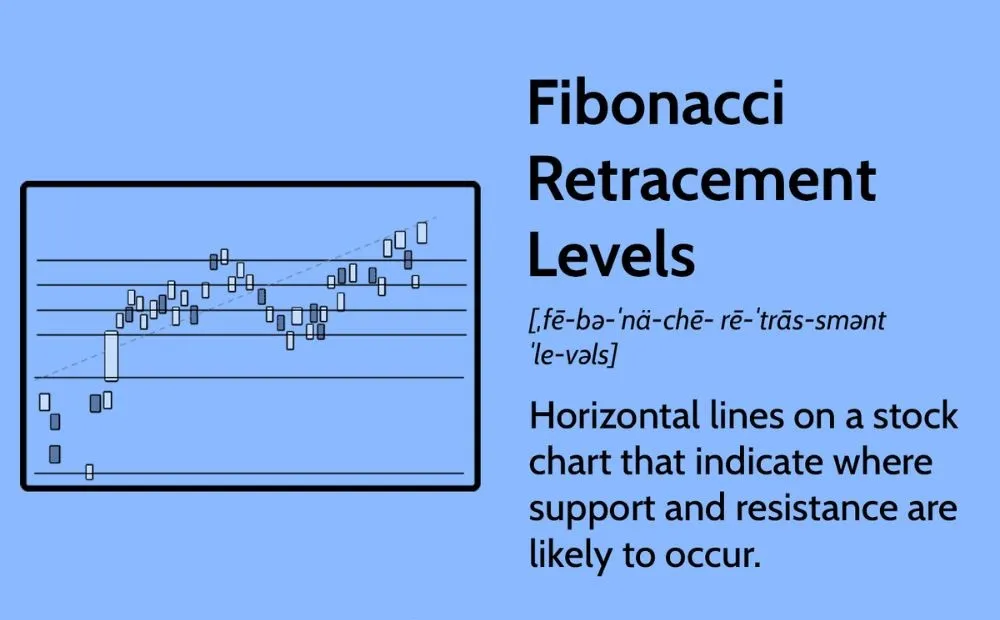
Conversely, a “Swing Low” is a trough in the price. It is defined as a candle that has a higher low on both its immediate left and right sides. On a chart, it looks like a valley. This point signifies where selling pressure was absorbed, and buyers stepped in to push the price back up. When you are looking for these points, you want to find the most prominent and obvious peaks and valleys that define the beginning and end of a clear trend leg. For example, in an uptrend, the Swing Low would be the lowest point right before the price started its strong upward move, and the Swing High would be the highest point reached before the pullback began.
How Do You Apply the Tool in an Uptrend?
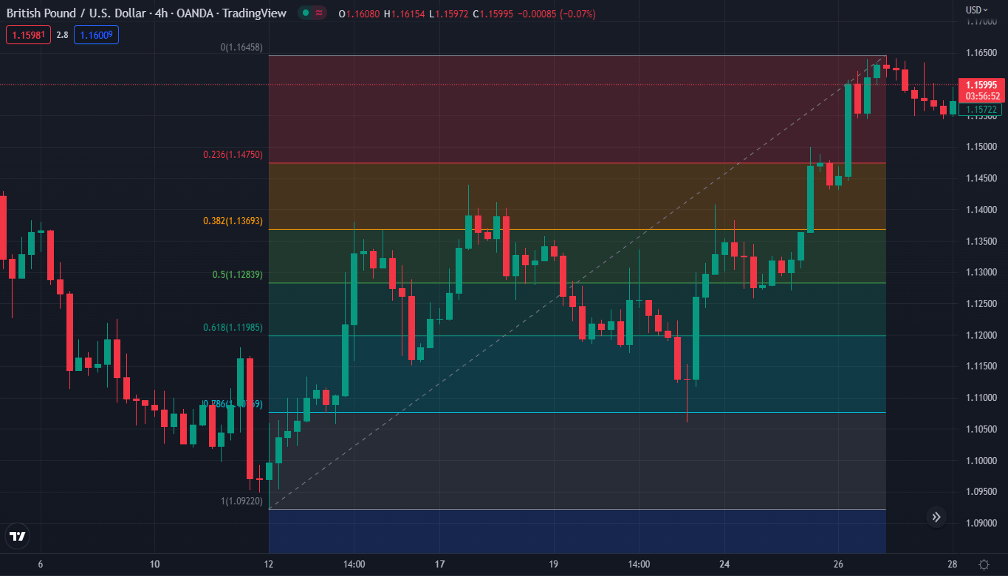
Applying the Fibonacci retracement tool in an uptrend helps you identify potential support levels where a price pullback might end, offering a buying opportunity. The process involves measuring the primary upward move to see how far the price might correct downwards. Here is a step-by-step guide:
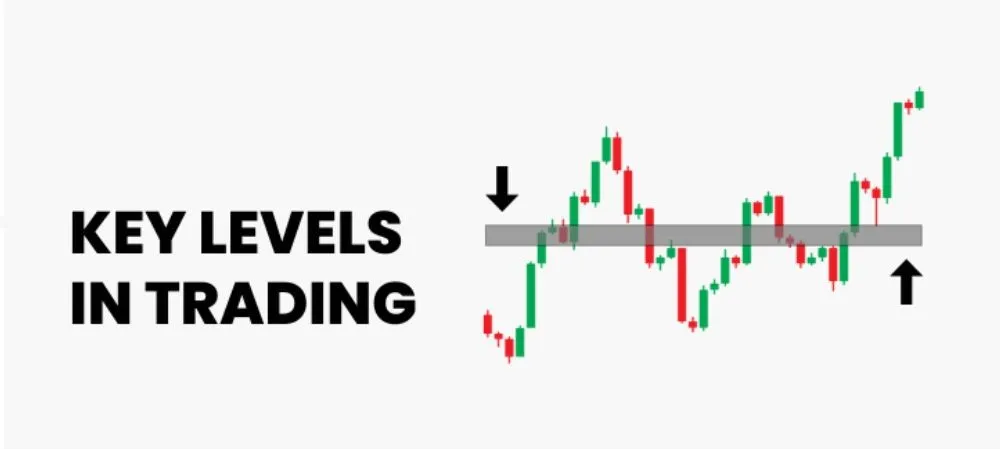
1. Confirm the Uptrend: First, ensure the market is in a clear uptrend. You can confirm this by observing a pattern of higher highs and higher lows on your chart.
2. Identify the Swing Low and Swing High: Locate the most recent significant price move upwards. Find the absolute bottom of this move, which is your Swing Low. Then, find the absolute top of the same move, which is your Swing High.
3. Select the Fibonacci Tool: In your trading platform, select the Fibonacci Retracement tool from the drawing toolbar.
4. Draw from Low to High: Click your mouse on the exact low point of the Swing Low candle (including the wick). While holding the mouse button, drag your cursor up to the exact high point of the Swing High candle (including the wick) and release.
Once you release the mouse button, the platform will automatically draw the horizontal Fibonacci levels (23.6%, 38.2%, 50%, etc.) between the Swing Low and Swing High. These levels are now your potential support zones to watch for a buy entry.
How Do You Apply the Tool in a Downtrend?
In a downtrend, the process is reversed. You use the Fibonacci tool to identify potential resistance levels where a temporary rally might stall, offering a selling opportunity. You are measuring the primary downward move to project where a corrective bounce might run out of steam. Follow these steps:
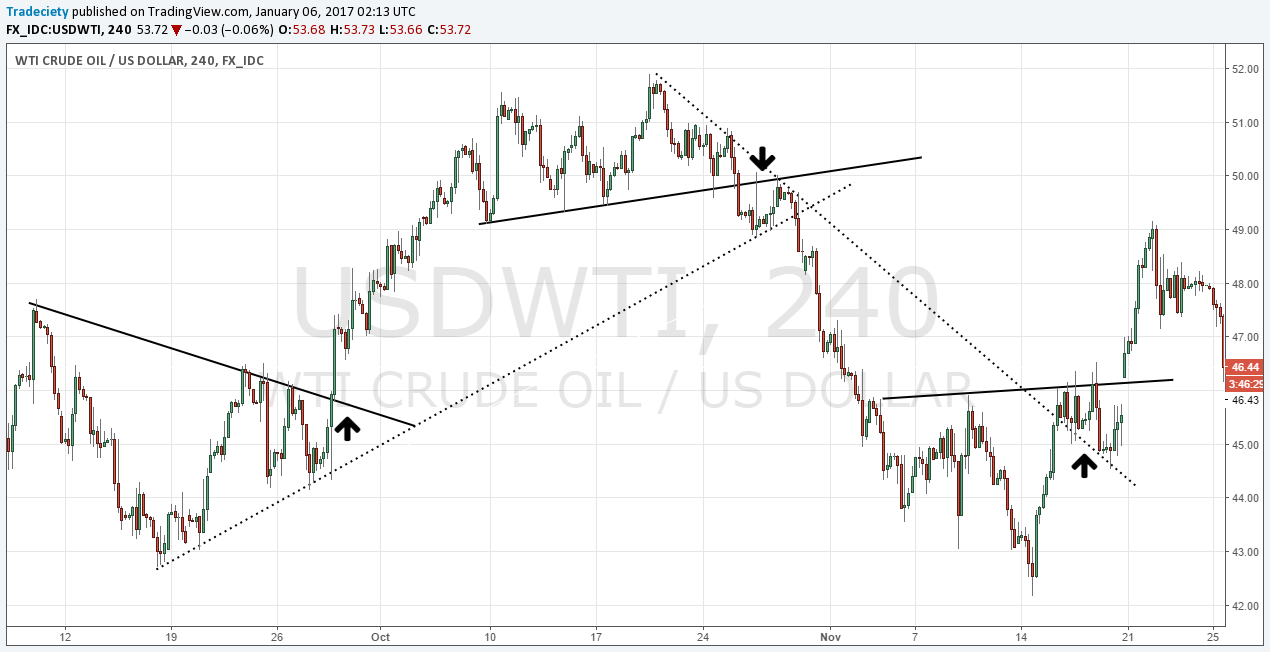
1. Confirm the Downtrend: Look for a clear pattern of lower lows and lower highs on your chart to confirm the market is in a downtrend.
2. Identify the Swing High and Swing Low: Locate the most recent major price move downwards. Find the absolute top of this move, which is your Swing High. Then, find the absolute bottom of the same move, which is your Swing Low.
3. Select the Fibonacci Tool: Choose the Fibonacci Retracement tool from your platform’s menu.
4. Draw from High to Low: Click your mouse on the exact high point of the Swing High candle. Hold the mouse button and drag your cursor down to the exact low point of the Swing Low candle, then release.
The platform will now display the Fibonacci retracement levels across the price range you measured. These lines represent potential resistance zones where you can look for an opportunity to enter a short (sell) trade, anticipating that the downtrend will resume.
What Is a Basic Fibonacci Retracement Trading Strategy?
A basic Fibonacci retracement strategy involves identifying a strong trend, waiting for price to pull back to a key Fibonacci level, and entering a trade in the direction of the trend upon seeing a price action confirmation signal. This approach is a trend-following strategy at its core, designed to help you enter the market during a “dip” in an uptrend or a “rally” in a downtrend. The goal is not to predict tops or bottoms but to join an existing, established trend at a more favorable price.
To understand this better, the strategy has three main components. First is Trend Identification. You must be able to recognize whether the market is generally moving up or down. This can be done by looking at the chart for higher highs and higher lows (uptrend) or lower lows and lower highs (downtrend), or by using an indicator like a moving average. Second is Entry Identification, which is where the Fibonacci tool comes in. You apply the tool to the most recent price swing to map out potential pullback zones. The third and final component is Trade Confirmation. You do not blindly enter a trade just because the price touches a Fibonacci level. Instead, you wait for additional evidence, like a specific candlestick pattern, to confirm that the pullback is likely over and the trend is ready to resume.
How Do You Find a Bullish (Long) Entry Signal?
Finding a bullish (long) entry signal with the Fibonacci tool is a systematic process that combines trend analysis with price action. Here are the specific conditions you should look for before entering a long trade:

1. Establish the Uptrend: First, confirm that the currency pair is in a clear and healthy uptrend. The price should be making a consistent series of higher highs and higher lows.
2. Draw the Retracement Levels: Once the price has made a new Swing High and starts to pull back, apply the Fibonacci retracement tool. You will draw it from the beginning of the upward move (the Swing Low) to the end of the move (the Swing High).
3. Wait for a Pullback to a Key Level: Patiently watch as the price retraces downwards towards one of the key Fibonacci levels. The most common zones for a reversal are the 38.2%, 50%, and 61.8% levels. Price action at these levels is of high interest.
4. Look for a Bullish Confirmation Candle: This is the crucial trigger for your entry. Do not enter the trade as soon as the price touches a level. Instead, wait for the price to show a sign that buyers are stepping back in. Look for a bullish candlestick pattern to form right on or near the Fibonacci support level. Examples include:
* Hammer: A candle with a long lower wick and a small body at the top, indicating that sellers tried to push the price down but buyers regained control.
* Bullish Engulfing Pattern: A large green candle that completely “engulfs” the previous smaller red candle, signaling a strong shift in momentum to the upside.
* Doji: A candle with a very small body, indicating indecision that often precedes a reversal.
When you see one of these patterns form at a Fibonacci support level, it provides a strong signal that the pullback is over and the uptrend is likely to continue.
How Do You Find a Bearish (Short) Entry Signal?
The process for finding a bearish (short) entry signal is simply the mirror image of the bullish setup. You are looking for an opportunity to sell during a temporary rally within a larger downtrend. Here are the conditions for a short entry:
1. Establish the Downtrend: First, confirm that the market is in a distinct downtrend, characterized by a series of lower lows and lower highs.
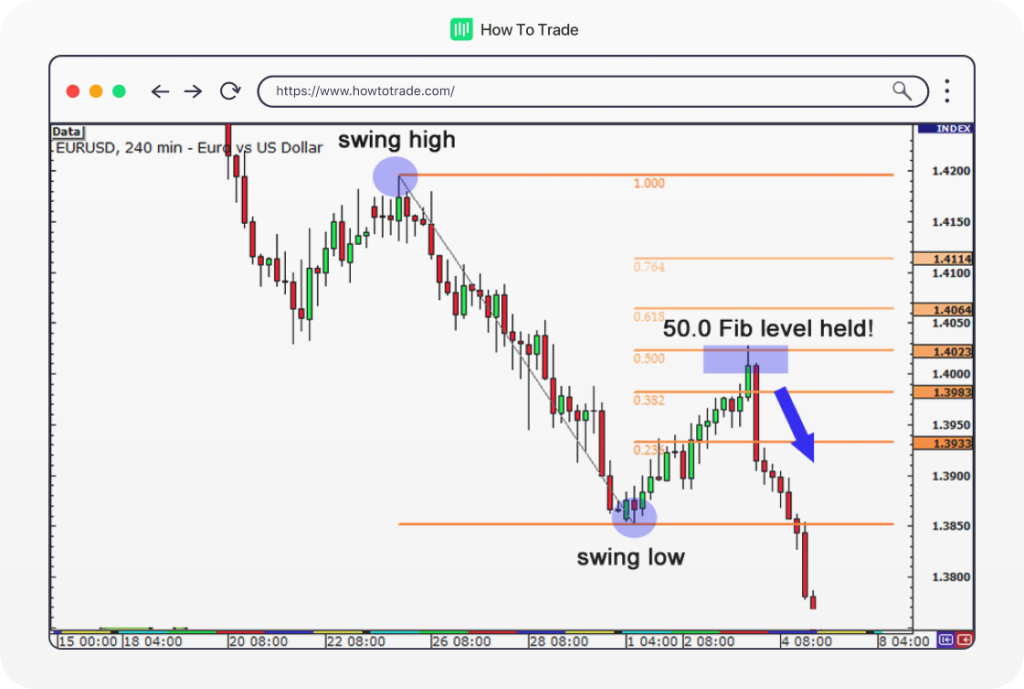
2. Draw the Retracement Levels: After the price makes a new Swing Low and begins to rally upwards, apply the Fibonacci tool. This time, you draw it from the top of the downward move (the Swing High) down to the bottom (the Swing Low).
3. Wait for a Rally to a Key Level: Watch as the price corrects upwards towards the Fibonacci resistance levels. The 38.2%, 50%, and 61.8% levels are again the primary zones to monitor.
4. Look for a Bearish Confirmation Candle: To trigger your entry, wait for a bearish candlestick pattern to appear on or near one of these resistance levels. This confirms that selling pressure is returning to the market. Common bearish confirmation signals include:
* Shooting Star: The opposite of a hammer, this candle has a long upper wick and a small body at the bottom, showing that buyers tried to push the price up but sellers overwhelmed them.
* Bearish Engulfing Pattern: A large red candle that completely covers the previous smaller green candle, indicating a powerful shift to the downside.
* Hanging Man: Similar in shape to a hammer but appearing at the top of a rally, it signals a potential reversal downwards.
Seeing one of these patterns at a Fibonacci resistance level gives you a high-probability signal to enter a short trade, anticipating a continuation of the downtrend.
How Do You Manage Risk When Trading with Fibonacci Levels?
You manage risk when trading with Fibonacci levels by placing stop-loss orders just beyond the retracement level of your entry and setting take-profit targets at logical price points like the previous swing high or low. The Fibonacci tool is not just for finding entries. It also provides a logical framework for defining your exact exit points, for both cutting losses and securing profits. This structured approach to risk management helps prevent emotional decisions and protects your trading capital.
Let’s explore this. Trading without a predefined stop-loss is like driving without brakes. The Fibonacci levels give you clear reference points to place these crucial orders. Similarly, having a profit target stops you from getting greedy and watching a winning trade turn into a loser. By using the same swing high and low points that you used to draw your retracement levels, you can establish objective and rational exit strategies. Combining Fibonacci levels with sound money management rules, such as risking only a small percentage of your account on any single trade, is fundamental to long-term success.
Where Should You Place a Stop-Loss Order?
Placing a stop-loss order correctly is your primary defense against significant losses. When using Fibonacci retracements, there are a few common and logical places to set your stop.

For a bullish (long) trade:
- Below the Next Fibonacci Level: A popular method is to place your stop-loss just below the Fibonacci level that is directly underneath your entry level. For instance, if you enter a long trade at the 38.2% level, you might place your stop-loss a few pips below the 50% level. This gives the trade some room to breathe in case the price dips slightly lower before reversing.
- Below the Swing Low: A more conservative and often safer approach is to place your stop-loss just below the Swing Low that you used to draw the Fibonacci tool. The logic here is simple: if the price breaks below the starting point of the entire upward move, the uptrend structure is invalidated, and you want to be out of the trade anyway.
For a bearish (short) trade:
- Above the Next Fibonacci Level: If you enter a short trade at the 38.2% resistance level, you could place your stop-loss just above the 50% level. This protects you if the rally extends a bit further than anticipated before turning down.
- Above the Swing High: The most conservative placement for a short trade’s stop-loss is just above the Swing High from which you drew the tool. If the price moves above the starting point of the entire downward swing, the downtrend is likely over, and the trade idea is no longer valid.
Where Should You Set Take-Profit Targets?
Setting take-profit targets is about defining where you will exit a winning trade to realize your gains. With Fibonacci trading, you have several clear options for setting these targets.

The most common and straightforward profit target is the start of the retracement.
- For a long trade, your primary take-profit target would be the Swing High that you used to draw the tool. Reaching this level confirms that the uptrend has resumed.
- For a short trade, your first target would be the Swing Low of the move you measured.
For traders looking for larger gains when the trend is strong, Fibonacci extension levels can be used. These levels project potential price targets beyond the original swing. Standard extension levels include 127.2% and 161.8%. You can add these levels to your Fibonacci tool in your platform’s settings. When the price breaks past the initial Swing High (in an uptrend) or Swing Low (in a downtrend), these extension levels become your next logical profit targets. Many traders use a multi-target approach, closing a portion of their position at the initial swing point and leaving the rest to run towards an extension level to maximize profit potential.
What Are Some Advanced Fibonacci Trading Concepts?
Advanced Fibonacci concepts involve combining the tool with other indicators, understanding related tools like extensions, avoiding common pitfalls, and identifying high-probability setups like confluence zones. Moreover, mastering these advanced applications allows traders to move beyond basic retracement entries and develop a more nuanced and effective trading strategy. By layering additional forms of analysis onto Fibonacci levels, you can filter out weak signals and focus on trades with a higher probability of success. These techniques help confirm the validity of potential support or resistance zones, providing greater confidence in trade execution and management.
How Can You Combine Fibonacci Retracement with Other Indicators?
Combining the Fibonacci retracement tool with other technical indicators is a powerful way to increase the probability of a successful trade. Fibonacci levels identify potential support and resistance zones, but they do not guarantee a price reversal. Other indicators can provide the necessary confirmation that a reversal is actually occurring at one of these key levels. This approach helps filter out false signals and strengthens your trading decisions by ensuring multiple analytical tools point to the same conclusion. By seeking this confirmation, you move from speculative trading to a more strategic, evidence-based approach that can improve consistency over time.

This synergistic method relies on several popular combinations.
- Moving Averages: When a key Fibonacci level, such as the 61.8% retracement, aligns with a significant moving average like the 50-day or 200-day MA, it creates a very strong support or resistance zone. This alignment signals that both short-term and long-term traders are watching the same price area.
- Relative Strength Index (RSI): If the price pulls back to a Fibonacci support level while the RSI indicator shows an oversold condition (below 30), it suggests that selling pressure is exhausted. This combination provides a strong signal that a bullish reversal is likely.
- Candlestick Patterns: The appearance of a decisive candlestick pattern, such as a hammer or a bullish engulfing pattern at a Fibonacci support level, provides powerful visual confirmation that buyers are taking control from sellers.
What Is the Difference Between Fibonacci Retracement and Fibonacci Extension?
While both tools are based on the same mathematical sequence, Fibonacci retracement and Fibonacci extension serve two distinct and complementary purposes in trading. The primary difference is that retracements measure potential pullback levels within a trend, while extensions project potential profit targets after a pullback ends. Retracements help answer the question, “Where might the price find support or resistance during a correction?” Conversely, extensions help answer, “How far might the price move in the direction of the trend after the correction is over?” Understanding this distinction is fundamental to using both tools correctly for entries and exits.
To clarify their roles, consider their specific applications.
- Fibonacci Retracement: This tool is used on a completed price swing (from a low to a high in an uptrend, or high to low in a downtrend) to identify potential entry points. Key levels like 38.2%, 50%, and 61.8% indicate areas where a counter-trend move might pause and reverse back in the direction of the primary trend.
- Fibonacci Extension: This tool requires three points to draw: the start of a trend, the end of that trend, and the end of the subsequent retracement. It then projects future price levels, such as 127.2% and 161.8%, which act as logical areas to take profit.
- Analogy: Think of a retracement as predicting where a rubber band will stop when it snaps back, while an extension predicts how far it will fly forward after being released.
What Are the Most Common Mistakes to Avoid When Using Fibonacci?
Traders often make several common mistakes when using the Fibonacci tool, which can lead to poor analysis and losing trades. One of the most frequent errors is drawing the swing points incorrectly. In a clear uptrend, the tool must be drawn from the significant swing low to the subsequent swing high. In a downtrend, it must be drawn from the swing high to the swing low. Reversing this application will produce invalid and misleading levels, rendering the entire analysis useless. Another major pitfall is treating Fibonacci levels as absolute buy or sell signals without seeking additional confirmation.

To improve accuracy and avoid these errors, traders should be mindful of the following.
- Trading Without Confirmation: A price reaching a Fibonacci level is not a signal in itself. It is an area of interest where a reaction might occur. Always wait for confirmation from price action, such as a strong candlestick reversal pattern, or from another indicator before entering a trade.
- Using it in Ranging Markets: The Fibonacci retracement tool is designed for trending markets. Applying it in a sideways or choppy market will generate unreliable levels and frequent false signals, as there is no clear directional momentum for the price to resume.
- Ignoring the Broader Context: Focusing solely on a Fibonacci setup on a low timeframe while ignoring major support or resistance levels on a higher timeframe is a recipe for failure. Always analyze the market context across multiple timeframes.
Does the Fibonacci Tool Work for Different Forex Pairs and Timeframes?
Yes, the Fibonacci tool is universally applicable across virtually all liquid forex pairs and timeframes. Its effectiveness stems from the fact that Fibonacci ratios are mathematical constants that reflect patterns in market psychology and herd behavior, which are present regardless of the specific currency pair or the chart’s timeframe. Whether analyzing the EUR/USD on a 5-minute chart for a scalping opportunity or the GBP/JPY on a weekly chart for a long-term position, the core principles of identifying retracements and extensions remain the same. The tool’s versatility is one of its greatest strengths, allowing traders to incorporate it into any trading style.

However, traders should make certain adjustments based on the market conditions.
- Volatility Adjustments: For highly volatile pairs, like many emerging market or exotic pairs, price action can be more erratic. Price might overshoot key Fibonacci levels more frequently. In these cases, it is wise to use wider stop losses or wait for stronger confirmation signals.
- Timeframe Considerations: On lower timeframes (e.g., 1-minute or 5-minute charts), market noise is more prevalent, which can lead to more false signals. Here, combining Fibonacci with other indicators is especially important. On higher timeframes like the daily or weekly charts, Fibonacci levels tend to be more respected and represent more significant price zones.
- Liquidity: The tool performs best on pairs with high liquidity, as the price action is smoother and more predictable. On illiquid pairs, sudden price spikes can disrupt the patterns.
What Is a Fibonacci Confluence Zone?
A Fibonacci confluence zone is a specific price area where multiple Fibonacci levels calculated from different price swings overlap. This convergence creates a much stronger and more reliable support or resistance level than any single Fibonacci level would on its own. The basic idea is that if different sets of traders looking at different time swings all identify the same price area as important, that area gains significance. For example, a 38.2% retracement level from a long-term uptrend might align perfectly with a 61.8% retracement level from a more recent, shorter-term upward move. This intersection is a Fibonacci confluence zone.
Identifying these zones can greatly enhance a trading strategy.
- Increased Probability: Trades taken at a confluence zone generally have a higher probability of success because the level is reinforced by multiple layers of analysis. The more Fibonacci levels that cluster together, the stronger the potential for a price reaction.
- Drawing from Different Swings: To find these zones, a trader might draw a retracement on the primary trend and then draw another on a secondary, more recent swing within that same trend. The point where a level from the first set intersects a level from the second set forms the confluence.
- Combining with Other Tools: A Fibonacci confluence zone becomes even more powerful when it aligns with other technical indicators, such as a major moving average, a pivot point, or a previously established horizontal support or resistance line. This creates an area of “technical perfection” that attracts significant buying or selling pressure.