

Blog
How to Read and Apply the MACD Indicator in Forex Trading?

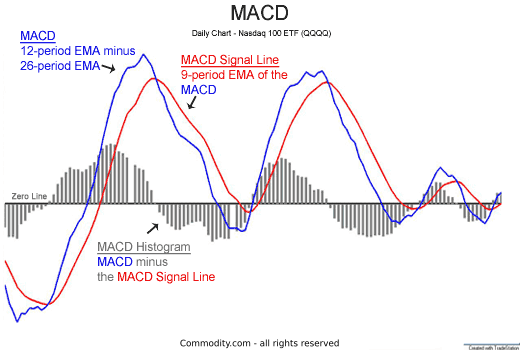
Reading and applying the MACD indicator in forex trading involves identifying three primary signals to gauge market momentum and potential trend changes. To read the MACD, you watch for crossovers between the MACD line and its signal line, divergences between the indicator and price action, and centerline crosses above or below zero. To apply it, you can use these signals as triggers for entering or exiting trades. For instance, a bullish crossover (MACD line crossing above the signal line) can be used as a buy signal, while a bearish divergence (price making a new high while the MACD makes a lower high) can be used as an early warning to exit a long position or consider a short entry.
The MACD, which stands for Moving Average Convergence Divergence, is a popular trend-following momentum indicator that shows the relationship between two exponential moving averages (EMAs) of a currency pair’s price. Its purpose is to help traders identify the direction and strength of market momentum. By plotting the difference between a faster EMA and a slower EMA, the MACD provides a visual representation of whether bullish or bearish momentum is increasing or decreasing.
The three main signals generated by the MACD indicator are crossovers, divergences, and centerline crosses. Crossovers occur when the MACD line intersects its signal line, suggesting a potential shift in short-term momentum. Divergences happen when the indicator’s movement conflicts with the price’s movement, often signaling a potential trend reversal. Centerline crosses occur when the MACD line moves above or below the zero line, indicating a broader shift in the overall trend direction.
Mastering these signals provides a powerful tool for your forex trading arsenal. While the MACD is straightforward to read on a chart, applying it effectively requires understanding the context of each signal within the broader market structure. This guide will break down each component and signal, providing you with a clear framework for both reading the indicator and integrating it into a practical trading strategy.
What Is the MACD Indicator?
The MACD is a trend-following momentum indicator that illustrates the relationship between two exponential moving averages (EMAs) of a security’s price, designed to reveal changes in trend strength, direction, momentum, and duration. In detail, it takes the difference between a longer-term EMA and a shorter-term EMA to create its primary value, the MACD line. This line oscillates above and below a central zero line, providing a clear visual cue about the market’s current state. When the MACD line is above zero, it generally indicates that upward momentum is in control. Conversely, when it is below zero, it suggests that downward momentum is prevailing. Its core purpose is to help traders spot potential buy and sell opportunities by highlighting shifts in market dynamics that might not be immediately obvious from looking at price alone. Unlike indicators that are bound within a specific range, like the RSI which moves between 0 and 100, the MACD is an unbound oscillator, meaning its values have no theoretical upper or lower limit. This makes it better suited for gauging momentum rather than identifying overbought or oversold conditions. It is a lagging indicator because it is based on past price data, but its signals, particularly divergence, can offer early warnings of potential trend reversals.
What are the Three Main Components of the MACD?
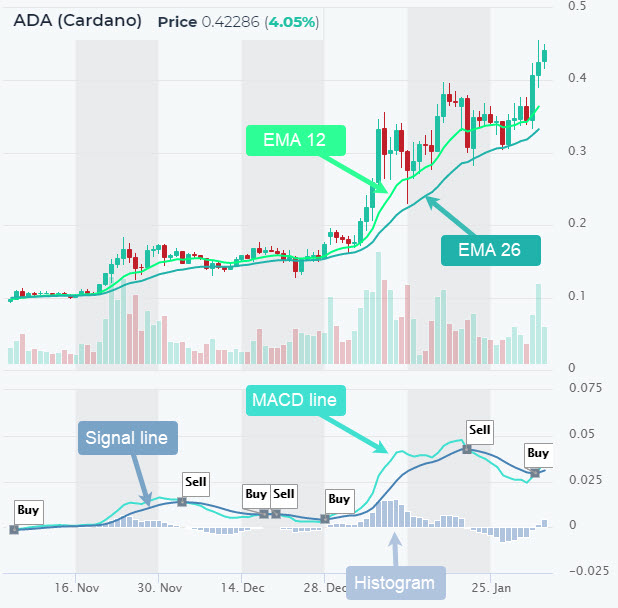
The MACD indicator is composed of three distinct visual elements that work together on your trading chart. Each component provides a unique piece of information about market momentum and trend.
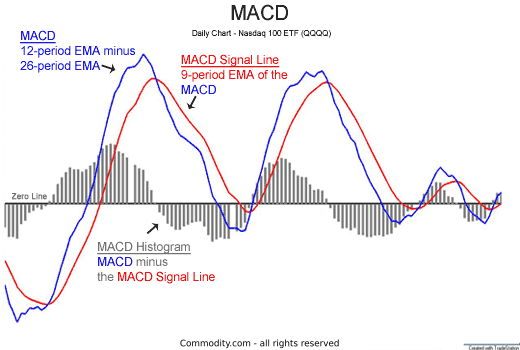
First is the MACD Line, often referred to as the “fast line.” This is the core of the indicator. It is calculated by subtracting the 26-period Exponential Moving Average (EMA) from the 12-period EMA. Because it uses shorter-term moving averages, it reacts relatively quickly to recent price changes. When the 12-period EMA pulls away from the 26-period EMA, the MACD line moves further from the zero line, indicating strengthening momentum. When the two EMAs move closer together, the MACD line approaches zero, signaling weakening momentum.
Second is the Signal Line, also known as the “slow line.” This line is a 9-period EMA of the MACD line itself. Its purpose is to smooth out the MACD line, making it easier to identify significant movements. Because it is an average of the MACD line, it moves more slowly. The interactions between the faster MACD line and the slower Signal line are what generate one of the most common trading signals: the crossover.
Third is the Histogram. The histogram is a simple bar chart that visually represents the difference between the MACD line and the Signal line. When the MACD line is above the Signal line, the histogram will have a positive value and its bars will appear above the zero line. When the MACD line is below the Signal line, the histogram will have a negative value and its bars will be below the zero line. The height or depth of the bars indicates the degree of separation between the two lines, providing an at-a-glance view of momentum. When the bars are growing taller, momentum is accelerating. When they are shrinking, momentum is decelerating.
How is the MACD Indicator Calculated?
Understanding the calculation behind the MACD provides deeper insight into how it functions, though you will never need to calculate it manually. Modern trading platforms like MetaTrader 5 or TradingView automatically plot the indicator for you. The calculation involves three simple steps corresponding to its three components.
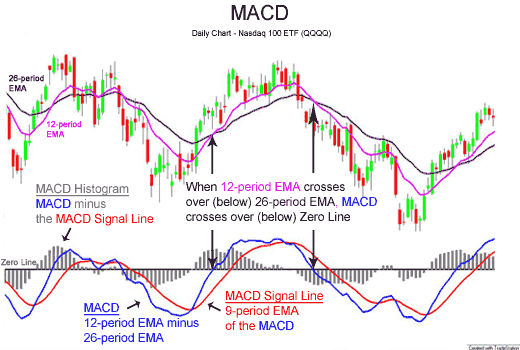
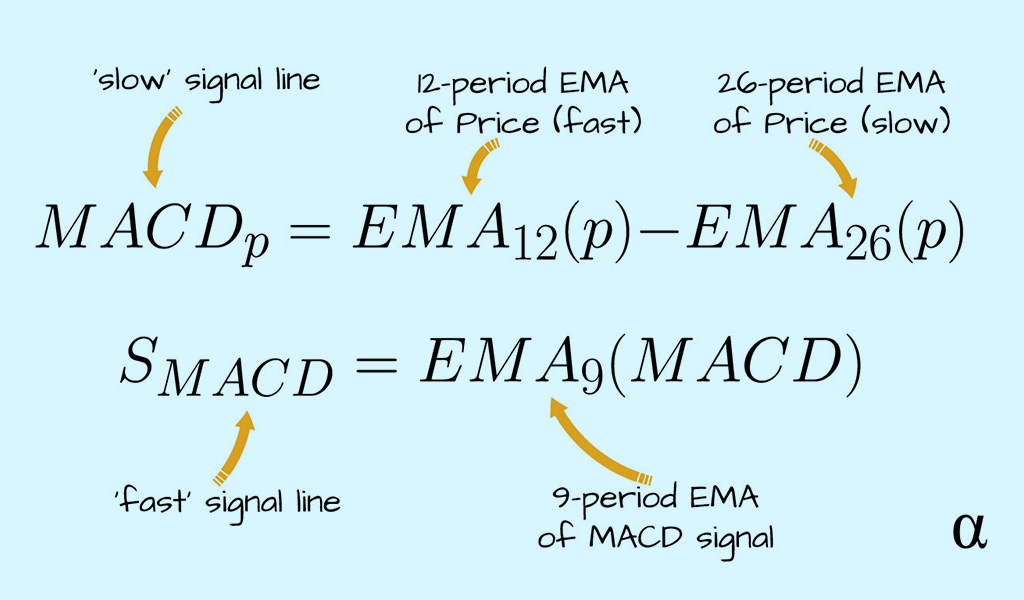
The first component, the MACD Line, is derived from two exponential moving averages (EMAs). The standard formula is:
MACD Line = 12-Period EMA – 26-Period EMA
The 12-period EMA is the “fast” moving average, reacting more quickly to price changes, while the 26-period EMA is the “slow” one. Subtracting the slow EMA from the fast EMA results in an oscillator that fluctuates around a zero level.
The second component, the Signal Line, is calculated to smooth out the MACD line and generate trade signals. Its formula is:
Signal Line = 9-Period EMA of the MACD Line
This means it is an average of the last nine values of the MACD line. Because it is an average, it lags behind the main MACD line, setting the stage for the crossover signals that traders watch closely.
The third and final component, the Histogram, provides a visual shortcut for interpreting the relationship between the first two lines. Its formula is:
Histogram = MACD Line – Signal Line
The result is a bar chart that shows the exact distance between the MACD line and the Signal line. This makes it easy to see when bullish or bearish momentum is strengthening (histogram bars get longer) or weakening (histogram bars get shorter).
How Do You Read the Primary MACD Signals?
You read the primary MACD signals by observing three key events on the indicator: crossovers between the MACD and signal lines, divergence between the indicator and price, and crosses of the MACD line over the central zero line. These events are the foundation for interpreting market momentum and identifying potential trading opportunities. Each signal offers a different perspective on the market’s behavior. Crossovers are often used for timing entries and exits based on short-term momentum shifts. Divergence acts as a potential warning sign that the current trend may be losing steam and could be poised for a reversal. Centerline crosses provide a broader confirmation of the dominant trend direction, helping to filter out weaker, short-lived signals. By learning to identify and differentiate these three signals, you can build a more complete picture of the market dynamics presented by the MACD. Let’s explore how to interpret each of these visual cues on your trading chart.
What is a MACD Crossover?
A MACD crossover is the most frequent and fundamental signal generated by the indicator, occurring when the MACD line and the Signal line intersect. There are two types of crossovers, each suggesting a different potential trading action.
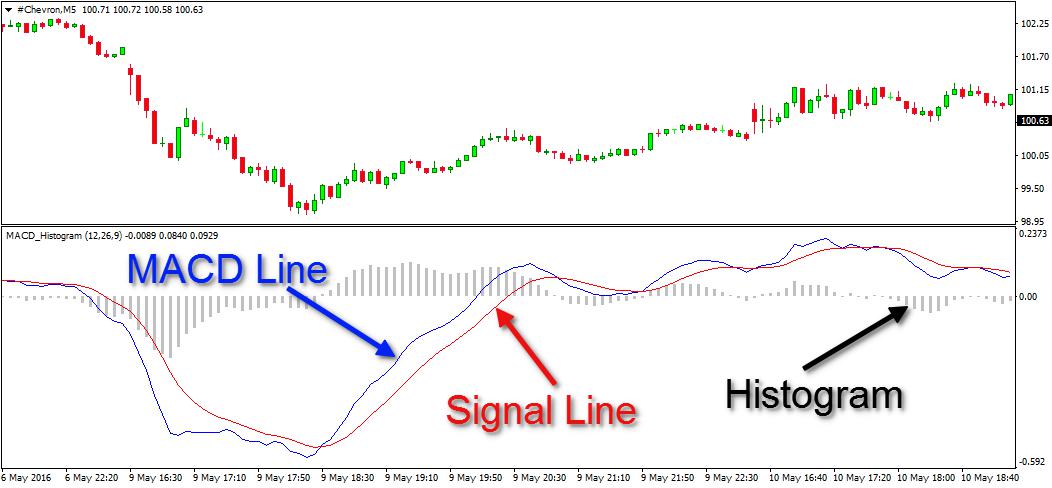
A bullish crossover happens when the faster MACD line crosses above the slower Signal line. This event suggests that short-term momentum is turning positive and potentially gaining strength relative to the longer-term trend. Traders often interpret this as a potential buy signal. For example, if a currency pair like EUR/USD has been in a downtrend and you observe the MACD line crossing up and over the Signal line, it could indicate that the downward pressure is easing and buyers may be starting to take control. This signal is often confirmed when the histogram flips from negative (below the zero line) to positive (above the zero line).
Conversely, a bearish crossover occurs when the faster MACD line crosses below the slower Signal line. This indicates that short-term momentum is turning negative and that selling pressure might be increasing. This is widely interpreted as a potential sell signal. For instance, if GBP/USD has been trending upward and you see the MACD line cross down through the Signal line, it may signal that the uptrend is losing steam and a price decline could follow. Here, the histogram would flip from positive to negative, visually confirming the shift in momentum. While crossovers are popular, it is important to recognize that they can produce false signals, especially in sideways or choppy markets where the lines may cross back and forth frequently.
What is a MACD Divergence?
A MACD divergence is a more advanced and powerful signal that occurs when the MACD indicator’s movement contradicts the price action on the chart. This “divergence” between price and momentum can be an early warning that the current trend is weakening and a reversal may be on the horizon.
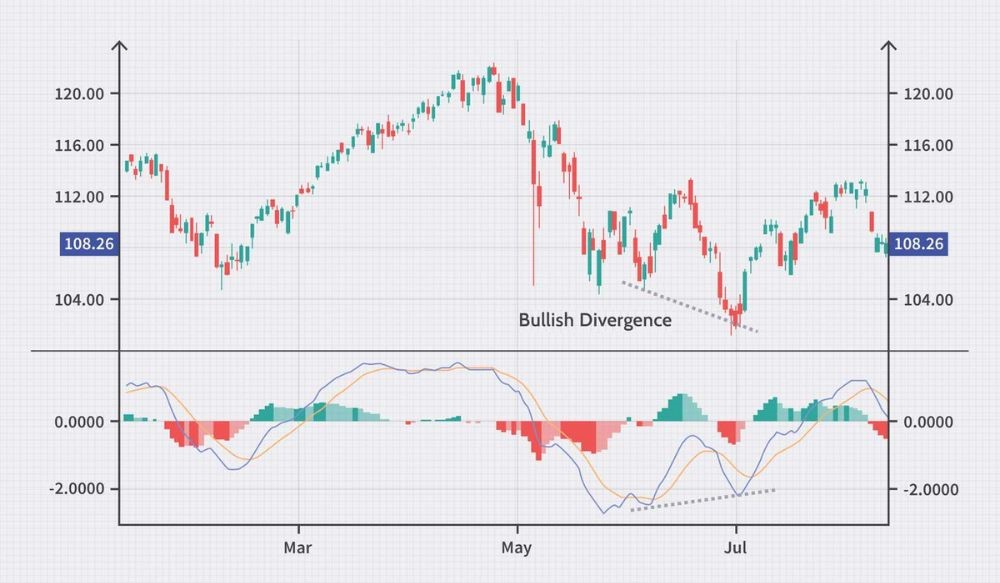
A bullish divergence forms when the price of a currency pair makes a lower low, but the MACD indicator simultaneously forms a higher low. Imagine the AUD/USD price drops to a new low, but when you look at the MACD window below, you see that the corresponding trough on the MACD is higher than the previous one. This suggests that even though the price fell, the underlying downward momentum was weaker on the second dip. This is a classic signal that sellers are losing conviction, and the downtrend might be nearing its end, presenting a potential buying opportunity.
On the other hand, a bearish divergence occurs when the price makes a higher high, but the MACD indicator makes a lower high. For example, if USD/JPY rallies to a new peak, but the corresponding peak on the MACD is lower than its previous peak, it signals a problem for the bulls. Despite the new price high, the upward momentum was not as strong as before. This indicates that buyers may be running out of steam, and the uptrend could be vulnerable to a reversal. This is often interpreted as a signal to consider selling or tightening stops on existing long positions. Divergence is a leading signal, but it doesn’t predict the exact timing of a reversal, so it’s best used with other confirmation tools.
What is a Centerline Crossover?
A centerline crossover is a MACD signal that helps define the broader, more dominant trend direction. The centerline is the zero line on the indicator, which represents the point of equilibrium where the 12-period EMA and the 26-period EMA are exactly equal. Movements across this line are significant because they indicate a more substantial shift in long-term momentum compared to the faster MACD/Signal line crossovers.
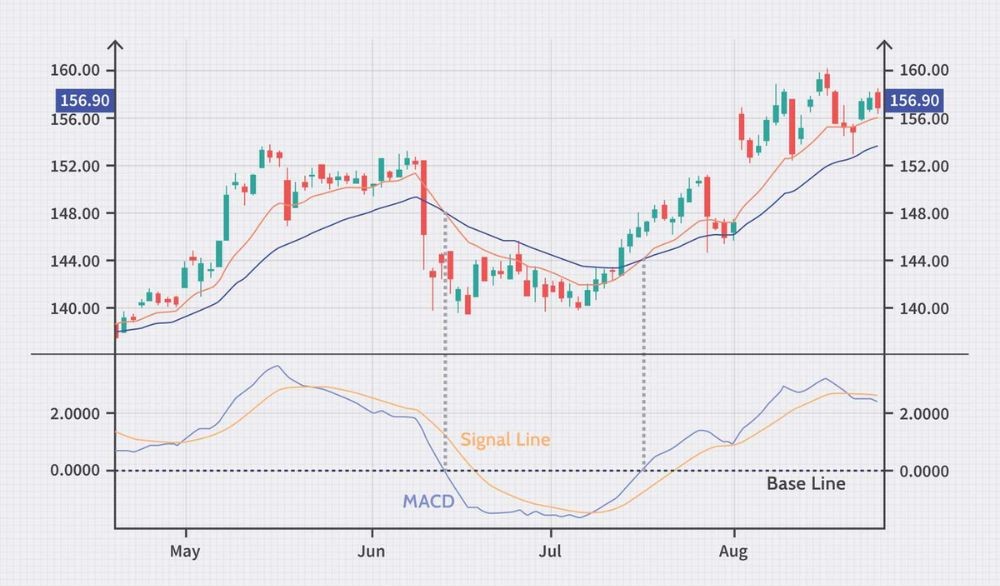
A bullish centerline crossover happens when the MACD line moves from below the zero line to above it. This crossover confirms that the shorter-term 12-period EMA has crossed above the longer-term 26-period EMA. This is a strong indication that the overall momentum has shifted from bearish to bullish. Traders often view this as confirmation that an uptrend is in place or is beginning to form. For example, if you see a bullish MACD/Signal line crossover while the indicator is still below zero, a subsequent cross above the centerline would add significant weight to the buy signal, suggesting the new upward move has legs.
In contrast, a bearish centerline crossover occurs when the MACD line moves from above the zero line to below it. This signals that the 12-period EMA has now crossed below the 26-period EMA, indicating that the overall momentum has turned from bullish to bearish. This can be used to confirm that a downtrend is establishing itself. If you were considering a short trade based on a bearish MACD/Signal line crossover that happened above the zero line, the MACD then crossing below zero would serve as a powerful confirmation of your bearish bias. Centerline crossovers are slower to react than signal line crossovers, but they are generally more reliable for identifying the primary trend direction.
How Do You Apply the MACD in a Forex Trading Strategy?
To apply the MACD in a forex trading strategy, you should use its primary signals, such as crossovers and divergences, as triggers for entering or exiting trades while integrating sound risk management principles like stop-losses and take-profit targets. The key is to transform the indicator’s visual cues into actionable trading decisions. For instance, a basic application involves using a bullish MACD crossover as a signal to enter a long position and a bearish crossover as a signal to initiate a short position. More advanced strategies might involve waiting for divergence to signal a potential trend reversal and then using a crossover as the confirmation for trade entry. The MACD is rarely used in isolation. Its effectiveness is greatly enhanced when combined with other forms of analysis, such as identifying support and resistance levels, analyzing candlestick patterns, or confirming the trend with another indicator. Let’s look at specific, practical ways to build trading strategies around its core signals.
How Can You Trade Using MACD Crossovers?
Trading with MACD crossovers is one of the most direct ways to apply the indicator. The strategy is based on entering the market when short-term momentum shifts, as indicated by the MACD line crossing its Signal line.
Here is a simple strategy for a long (buy) trade:
1. Identify the Signal: Wait for the MACD line to cross above the Signal line. This is your bullish crossover signal. For a higher probability trade, you might want this crossover to occur when the MACD is below the zero line, suggesting a potential move from bearish to bullish territory.
2. Confirm the Entry: Enter a long position on the opening of the next candle after the crossover is confirmed.
3. Set a Stop-Loss: Place a stop-loss order below the most recent swing low. This helps protect your capital if the signal turns out to be false and the price moves against you.
4. Set a Take-Profit: Your take-profit target could be set at a nearby resistance level or based on a risk-to-reward ratio, for example, 1:1.5 or 1:2. Another exit strategy is to close the trade when a bearish crossover occurs.
For a short (sell) trade, the rules are simply reversed:
1. Identify the Signal: Wait for the MACD line to cross below the Signal line. This is your bearish crossover signal. Ideally, this occurs above the zero line.
2. Confirm the Entry: Enter a short position after the crossover candle closes.
3. Set a Stop-Loss: Place a stop-loss order above the most recent swing high.
4. Set a Take-Profit: Target a nearby support level or use a fixed risk-to-reward ratio. You could also exit the trade upon a subsequent bullish crossover. This strategy is mechanical but works best in trending markets. In choppy, range-bound markets, it can lead to frequent false signals and small losses.
How Can You Trade Using MACD Divergence?
Trading with MACD divergence is a counter-trend or reversal strategy that requires more patience and confirmation than crossover trading. Divergence signals a potential weakening of the current trend, but it does not guarantee a reversal. Therefore, it is best used as a setup, with another signal serving as the entry trigger.
Here is a strategy for trading a bullish divergence:
1. Identify the Setup: Spot a bullish divergence on the chart. This means the price has printed a lower low, but the MACD indicator has formed a higher low. This is your warning that the downtrend may be losing momentum. Do not enter a trade yet.
2. Wait for Confirmation: After the divergence is clear, wait for a confirmation signal. This could be a bullish candlestick pattern, such as a hammer or a bullish engulfing candle. Alternatively, you could wait for a bullish MACD crossover (MACD line crossing above the Signal line) to occur after the divergence has formed.
3. Enter the Trade: Once you get your confirmation signal, enter a long (buy) position.
4. Set a Stop-Loss: Place your stop-loss just below the final price low that formed the divergence.
5. Set a Take-Profit: Target previous resistance levels or a major moving average.
For a bearish divergence trade, the process is mirrored:
1. Identify the Setup: Find a bearish divergence where the price makes a higher high, but the MACD creates a lower high. This signals that the uptrend could be weakening.
2. Wait for Confirmation: Look for a confirming signal, such as a bearish candlestick pattern like a shooting star or a bearish engulfing pattern. Another strong confirmation is a bearish MACD crossover happening after the divergence.
3. Enter the Trade: Once confirmed, enter a short (sell) position.
4. Set a Stop-Loss: Place the stop-loss just above the price peak that created the divergence.
5. Set a Take-Profit: Aim for previous support levels as your exit points. Divergence trading is powerful but requires discipline to wait for confirmation before acting.
What Else Should Forex Traders Know About the MACD?
Beyond its basic signals, forex traders should understand the MACD’s limitations as a lagging indicator, its ideal timeframes, how it compares to the RSI, and which indicators complement it for stronger analysis. Furthermore, knowing how to adjust its settings can help you tailor the indicator to a specific trading style or currency pair, moving beyond a one-size-fits-all approach.
What are the Common Limitations of the MACD Indicator?
One of the most significant limitations is that the MACD is a lagging indicator, meaning it generates signals based on price action that has already occurred. This delay can cause a trader to enter a trend after a substantial portion of the move has already happened, potentially reducing profit potential. Another major drawback is its tendency to produce false signals in ranging or sideways markets. In a market without a clear directional trend, the MACD and signal lines will cross back and forth frequently, generating numerous buy and sell signals that lack follow-through. Acting on these signals in a non-trending market is a common way for traders to accumulate small losses.
Because of these weaknesses, the MACD should almost never be used in isolation. To improve its reliability, traders must seek confirmation from other sources.
- Price Action: Confirm a MACD crossover with a price-action signal, like a breakout from a consolidation pattern or a bounce from a key support level.
- Other Indicators: Use a complementary indicator, such as the Relative Strength Index (RSI) or Bollinger Bands, to verify the momentum or volatility behind a MACD signal.
- Multiple Timeframes: Check the MACD on a higher timeframe to ensure the signal aligns with the broader market trend.
Is the MACD a Leading or Lagging Indicator?
The MACD is definitively a lagging indicator, not a leading one. This distinction is fundamental to using it correctly. Its entire construction is based on historical price data. The indicator calculates its values using two exponential moving averages (EMAs) of past prices, which by their nature average out previous price action. As a result, the MACD can only react to what the market has already done; it cannot predict what the market will do next. A leading indicator, in contrast, attempts to forecast future price movements before they happen, often by measuring factors like market sentiment or momentum exhaustion.
This lagging nature dictates the MACD’s primary function in a trading strategy. It is best used for confirmation, not prediction. A trader might observe a potential trend developing through price action and then look to the MACD for confirmation that momentum is indeed shifting in that direction.
- Trend Confirmation: When the MACD line crosses above the zero line, it confirms that upward momentum is building, reinforcing an existing uptrend.
- Momentum Shift: A crossover of the MACD and signal lines indicates a potential short-term shift in momentum has already begun.
- Joining a Trend: It helps traders identify entry points to join a trend that is already in its early stages, rather than trying to guess the exact bottom or top.
What is the Best Timeframe for Using the MACD in Forex?
While the MACD is versatile enough to be applied to any timeframe, from one-minute charts to weekly charts, it is generally considered more reliable on higher timeframes such as the 4-hour (H4), daily (D1), and weekly (W1). The primary reason for this is the reduction of market noise. Lower timeframes, like the 5-minute (M5) or 15-minute (M15), are filled with random price fluctuations that can cause the MACD lines to generate frequent, and often misleading, crossovers. These false signals can lead to overtrading and unnecessary losses.

Using the MACD on higher timeframes helps filter out this noise and focus on more substantial market trends. The signals generated are fewer but tend to be more meaningful and carry greater weight.
- H4 and Daily Charts: These timeframes are popular among swing traders. A MACD crossover on a daily chart, for instance, often signals a multi-day or multi-week move, providing a more robust trading opportunity.
- Weekly Charts: Long-term position traders and investors use weekly charts to identify major, multi-month trends. A MACD signal here represents a very powerful shift in market sentiment.
- Lower Timeframes: Scalpers and day traders can still use the MACD on shorter timeframes, but it requires extreme caution and must be combined with other tools to filter out poor signals.
How Does the MACD Compare to the RSI Indicator?
The MACD and the Relative Strength Index (RSI) are both popular momentum indicators, but they measure different aspects of price movement and are used for different purposes. The MACD is a trend-following momentum indicator, while the RSI is a momentum oscillator used to identify overbought and oversold conditions. Understanding their differences is key to using them effectively, either separately or together. The MACD helps traders identify the direction and strength of a trend, whereas the RSI helps gauge when a trend might be exhausted and due for a reversal or pullback.

A direct comparison highlights their unique characteristics.
- Calculation: The MACD is calculated by subtracting a longer-term EMA (26-period) from a shorter-term EMA (12-period). The RSI calculates the magnitude of recent price changes to evaluate overbought or oversold conditions.
- Scale: The MACD is an unbounded indicator, meaning its lines can theoretically move infinitely up or down. The RSI is an oscillator bounded between 0 and 100, with levels above 70 typically considered overbought and below 30 considered oversold.
- Primary Signals: The MACD’s main signals are signal line crossovers, centerline crossovers, and divergence. The RSI’s primary signals are entering overbought or oversold territory and divergence.
What are the Best Indicators to Use with the MACD?
To compensate for the MACD’s weaknesses, such as its lagging nature and its tendency to produce false signals in ranging markets, it is best to combine it with non-correlated indicators that measure different market dynamics. Pairing the MACD with indicators that track trends, volatility, or volume can create a more robust trading system by requiring multiple conditions to be met before entering a trade. This process of confirmation helps filter out low-probability setups and increases confidence in the signals that are taken.
Some of the most effective combinations include pairing the MACD with a trend or volatility indicator.
- Moving Averages: Using a long-term moving average, like the 200-period Simple Moving Average (SMA), provides context for the overall trend. A trader might only take MACD buy signals that occur when the price is above the 200 SMA and only take sell signals when the price is below it.
- Bollinger Bands: This volatility indicator helps identify when the market is quiet (bands are narrow) versus when it is active (bands are wide). A MACD crossover that occurs as the Bollinger Bands are expanding suggests strong momentum is entering the market, confirming the signal’s strength.
- Relative Strength Index (RSI): Combining the MACD with the RSI can be powerful. For example, a trader could look for a bullish MACD crossover while the RSI is moving up from oversold territory, providing two different forms of momentum confirmation.
Can You Change the Default MACD Settings (12, 26, 9)?
Yes, the default MACD settings of (12, 26, 9) can be changed, and many experienced traders adjust them to suit their specific strategy, timeframe, or the volatility of the asset they are trading. These numbers represent the periods used for the EMAs: the 12-period fast EMA, the 26-period slow EMA, and the 9-period EMA of the MACD line itself (which creates the signal line). Altering these settings changes the indicator’s sensitivity to price movements.

Adjusting the settings allows you to customize the indicator’s responsiveness.
- Faster Settings: Using shorter periods, such as (5, 35, 5), makes the MACD more sensitive to recent price changes. This results in more frequent crossovers and earlier signals. While this may appeal to short-term traders or scalpers, it also significantly increases the number of false signals.
- Slower Settings: Using longer periods, such as (21, 55, 9), makes the MACD less sensitive. This smooths out the MACD lines, resulting in fewer crossovers and filtering out minor price fluctuations. Long-term trend followers may prefer these settings to focus only on major shifts in momentum.
Before implementing any custom settings in a live trading environment, it is absolutely essential to backtest them thoroughly to see how they perform on historical data for your specific currency pair and timeframe.