

Blog
What Are Forex Trend-Following Strategies That Work?

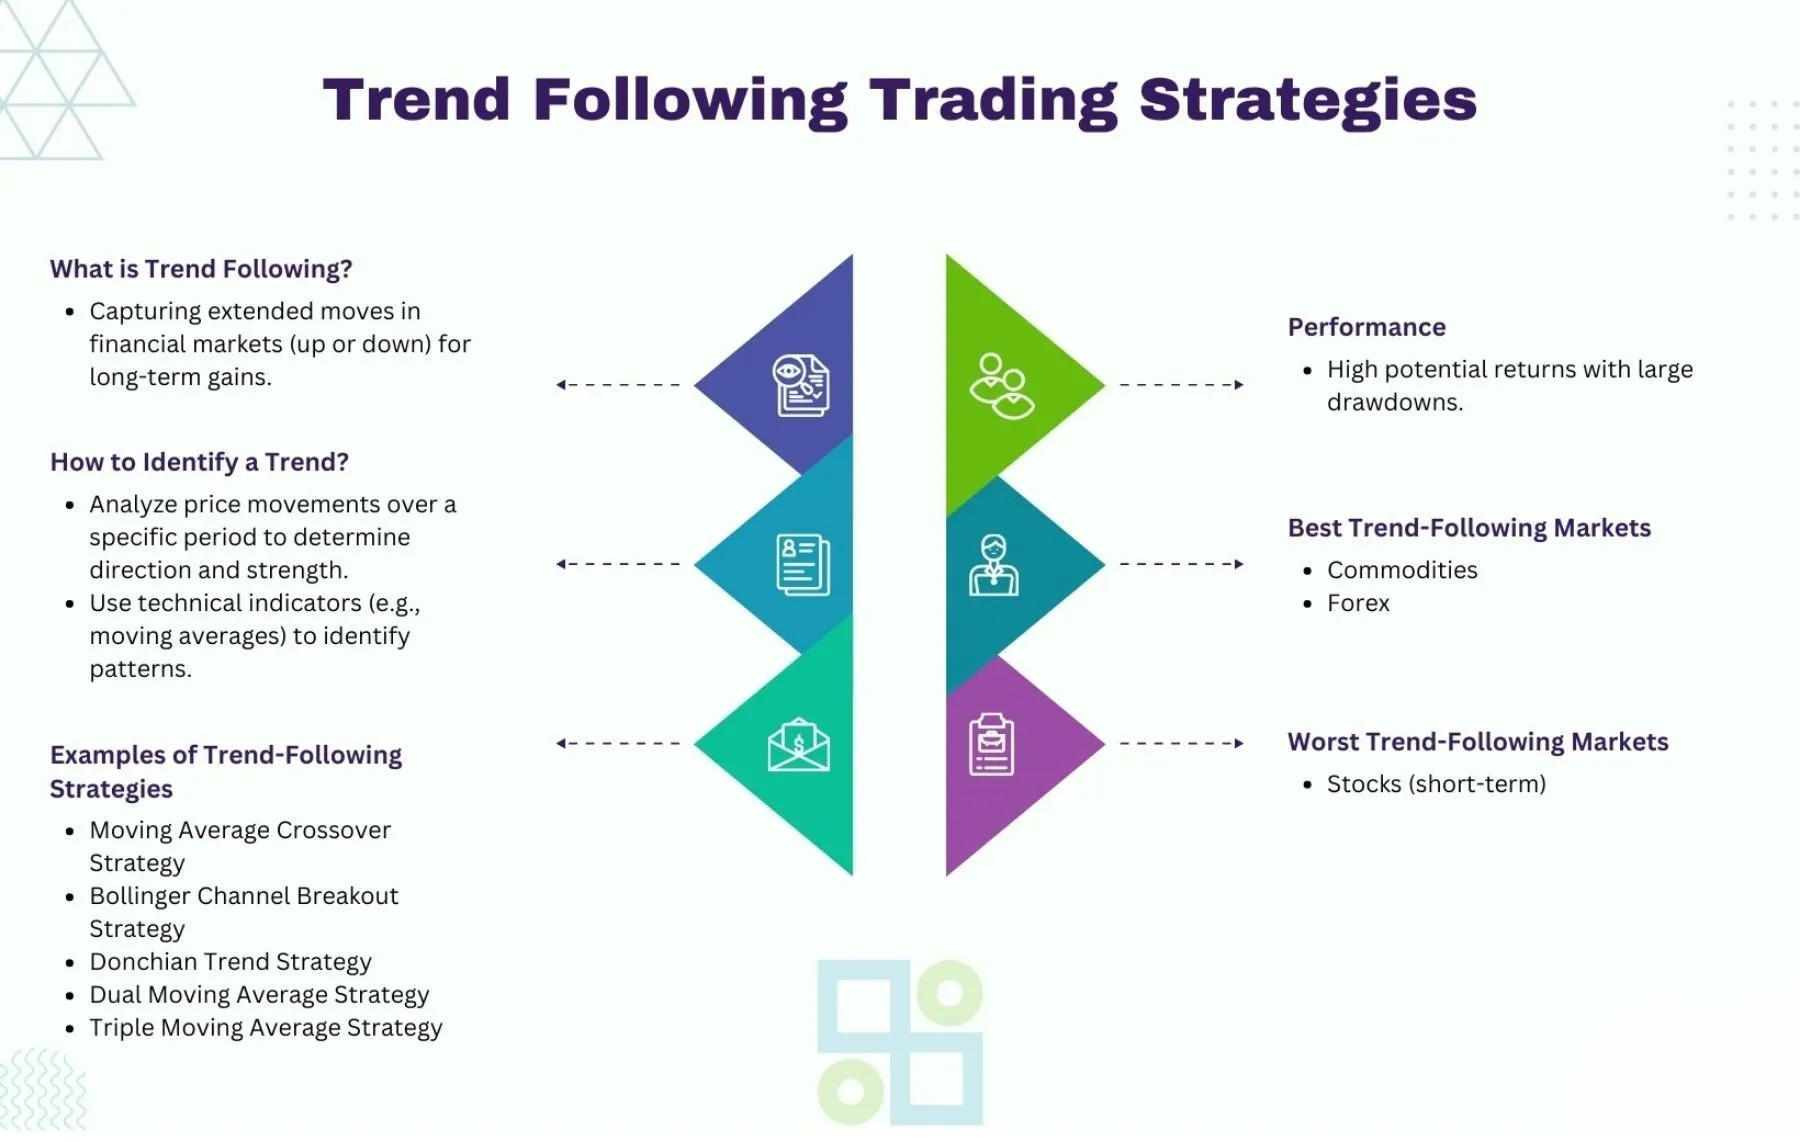
Effective forex trend-following strategies that work include the Moving Average Crossover, the Donchian Channel Breakout, and systems combining the Average Directional Index (ADX) with the Parabolic SAR. These strategies are proven because they are systematic, rules-based methods designed to capture profits from sustained price movements, or trends, in currency markets. They operate on the principle of riding momentum, aiming for large wins from long-running trends while cutting losses short on trades that fail. Success with these methods depends less on predicting market direction and more on disciplined execution of entry, exit, and risk management rules.
Trend-following systems work by identifying the dominant market direction and entering trades aligned with that momentum. The core philosophy is to “buy high and sell higher” in an uptrend or “sell low and cover lower” in a downtrend. Instead of trying to find the perfect entry at a market bottom or the perfect exit at a top, a trend follower waits for a trend to establish itself, joins it, and stays with it until the system signals the trend has likely ended. This approach accepts that many attempts to catch a trend will result in small losses when the market is not trending.
These strategies can be suitable for beginners due to their clear, mechanical rules, which remove guesswork and emotional decision-making. The logic is straightforward: if condition A happens, you buy; if condition B happens, you sell. However, their psychological demands can be challenging. A trader must be comfortable with a low win rate, often below 50%, and possess the discipline to hold onto a winning trade through minor pullbacks, trusting the system to capture a large move. This requires patience and a firm belief in the strategy’s long-term positive expectancy.
The reason these strategies remain popular is their ability to capitalize on the fundamental nature of financial markets, which often move in extended trends driven by economic cycles, central bank policies, and investor sentiment. By adhering to a well-defined plan, traders can systematically participate in these major moves. Let’s explore the mechanics, specific strategies, and underlying principles that make trend following a durable approach to the forex market.
What Is a Trend-Following Strategy in Forex?
A trend-following strategy in forex is a trading methodology that seeks to profit by analyzing the momentum of a currency pair in a particular direction. To understand this better, these strategies are built on the idea that once a price trend is established, it is more likely to continue than to reverse. Traders using this approach do not try to forecast market tops or bottoms. Instead, they use technical indicators to identify an existing uptrend or downtrend and then place trades in the same direction. The goal is to ride the trend for as long as possible, capturing a significant portion of the move. This approach is often summarized by the old trading adage, “the trend is your friend.” By aligning with the market’s dominant force, traders aim to secure large profits from major price swings, which they hope will more than offset the smaller, more frequent losses that occur when the market is not trending.
What Is the Core Principle Behind Trend Following?
The core principle behind trend following is the assumption that markets are driven by momentum and that existing trends have a statistical edge to persist over time. This philosophy is a direct contrast to “mean reversion” strategies, which bet on prices returning to their historical average. A trend follower believes in participating in the established flow of the market. The guiding idea is not to predict the future but to react to what the market is doing right now. This leads to the principles of “buy high, sell higher” during an uptrend and “sell low, cover lower” during a downtrend.
For instance, when the EUR/USD pair is in a strong uptrend, a trend follower isn’t concerned that the price might seem “too expensive.” Instead, they see the upward momentum as a sign of strength and a signal that buyers are in control. They will enter a long (buy) position, with the expectation that the price will continue to climb. The strategy is to ride this wave of momentum. Similarly, if the GBP/JPY is in a clear downtrend, they will enter a short (sell) position, anticipating further price declines. This reactive approach removes the need for complex economic forecasting or predicting price levels, focusing solely on the price action itself.
Are Trend-Following Strategies Suitable for Beginners?
Trend-following strategies are often considered suitable for beginners because their logic is relatively simple and rules-based, but they demand significant psychological discipline. On one hand, the mechanical nature is a huge advantage for newcomers. Rules like “buy when the 50-day moving average crosses above the 200-day moving average” are unambiguous. This eliminates emotional, impulsive decisions and provides a clear framework for action, which is something many new traders struggle with. You don’t need to guess where the market is going; you just follow the signals generated by your system. This structure can help build confidence and consistency.
On the other hand, the psychological aspect is very challenging. Trend-following systems typically have a low win rate, sometimes as low as 30% to 40%. This means a beginner must be prepared to accept a string of small losses before hitting a large winning trade. It is common to have five, six, or even more consecutive losing trades. This can be mentally taxing and can cause inexperienced traders to abandon their strategy right before it produces a big winner. Furthermore, it requires discipline to let profits run. When a trade is in profit, the natural human instinct is to close it quickly to lock in the gain. A trend follower must fight this urge and hold the position through minor price corrections, trusting the system to signal the exit when the trend truly ends. This combination of simple rules and tough psychology makes it a double-edged sword for beginners.
How Do Trend-Following Systems Work?
Trend-following systems work by using a predefined set of rules to identify a market trend, provide signals for entering and exiting trades, and manage risk. Let’s explore the mechanics of how these components come together to form a complete trading plan. A trader doesn’t just wake up and decide to buy a currency pair because it looks like it’s going up. Instead, they rely on a systematic process that is backtested and consistently applied. This process turns trading from a subjective guessing game into an objective, repeatable operation. Every action, from opening a position to placing a stop-loss, is dictated by the system’s rules, removing emotion and promoting discipline. The primary function of the system is to ensure the trader participates in major market moves while protecting their capital from significant losses during unfavorable, non-trending market conditions.
What Are the Three Key Components of a Trend-Following Strategy?
A robust trend-following strategy is built on three essential components: trend identification, entry and exit signals, and risk management. Each part plays a critical role in the system’s long-term success.
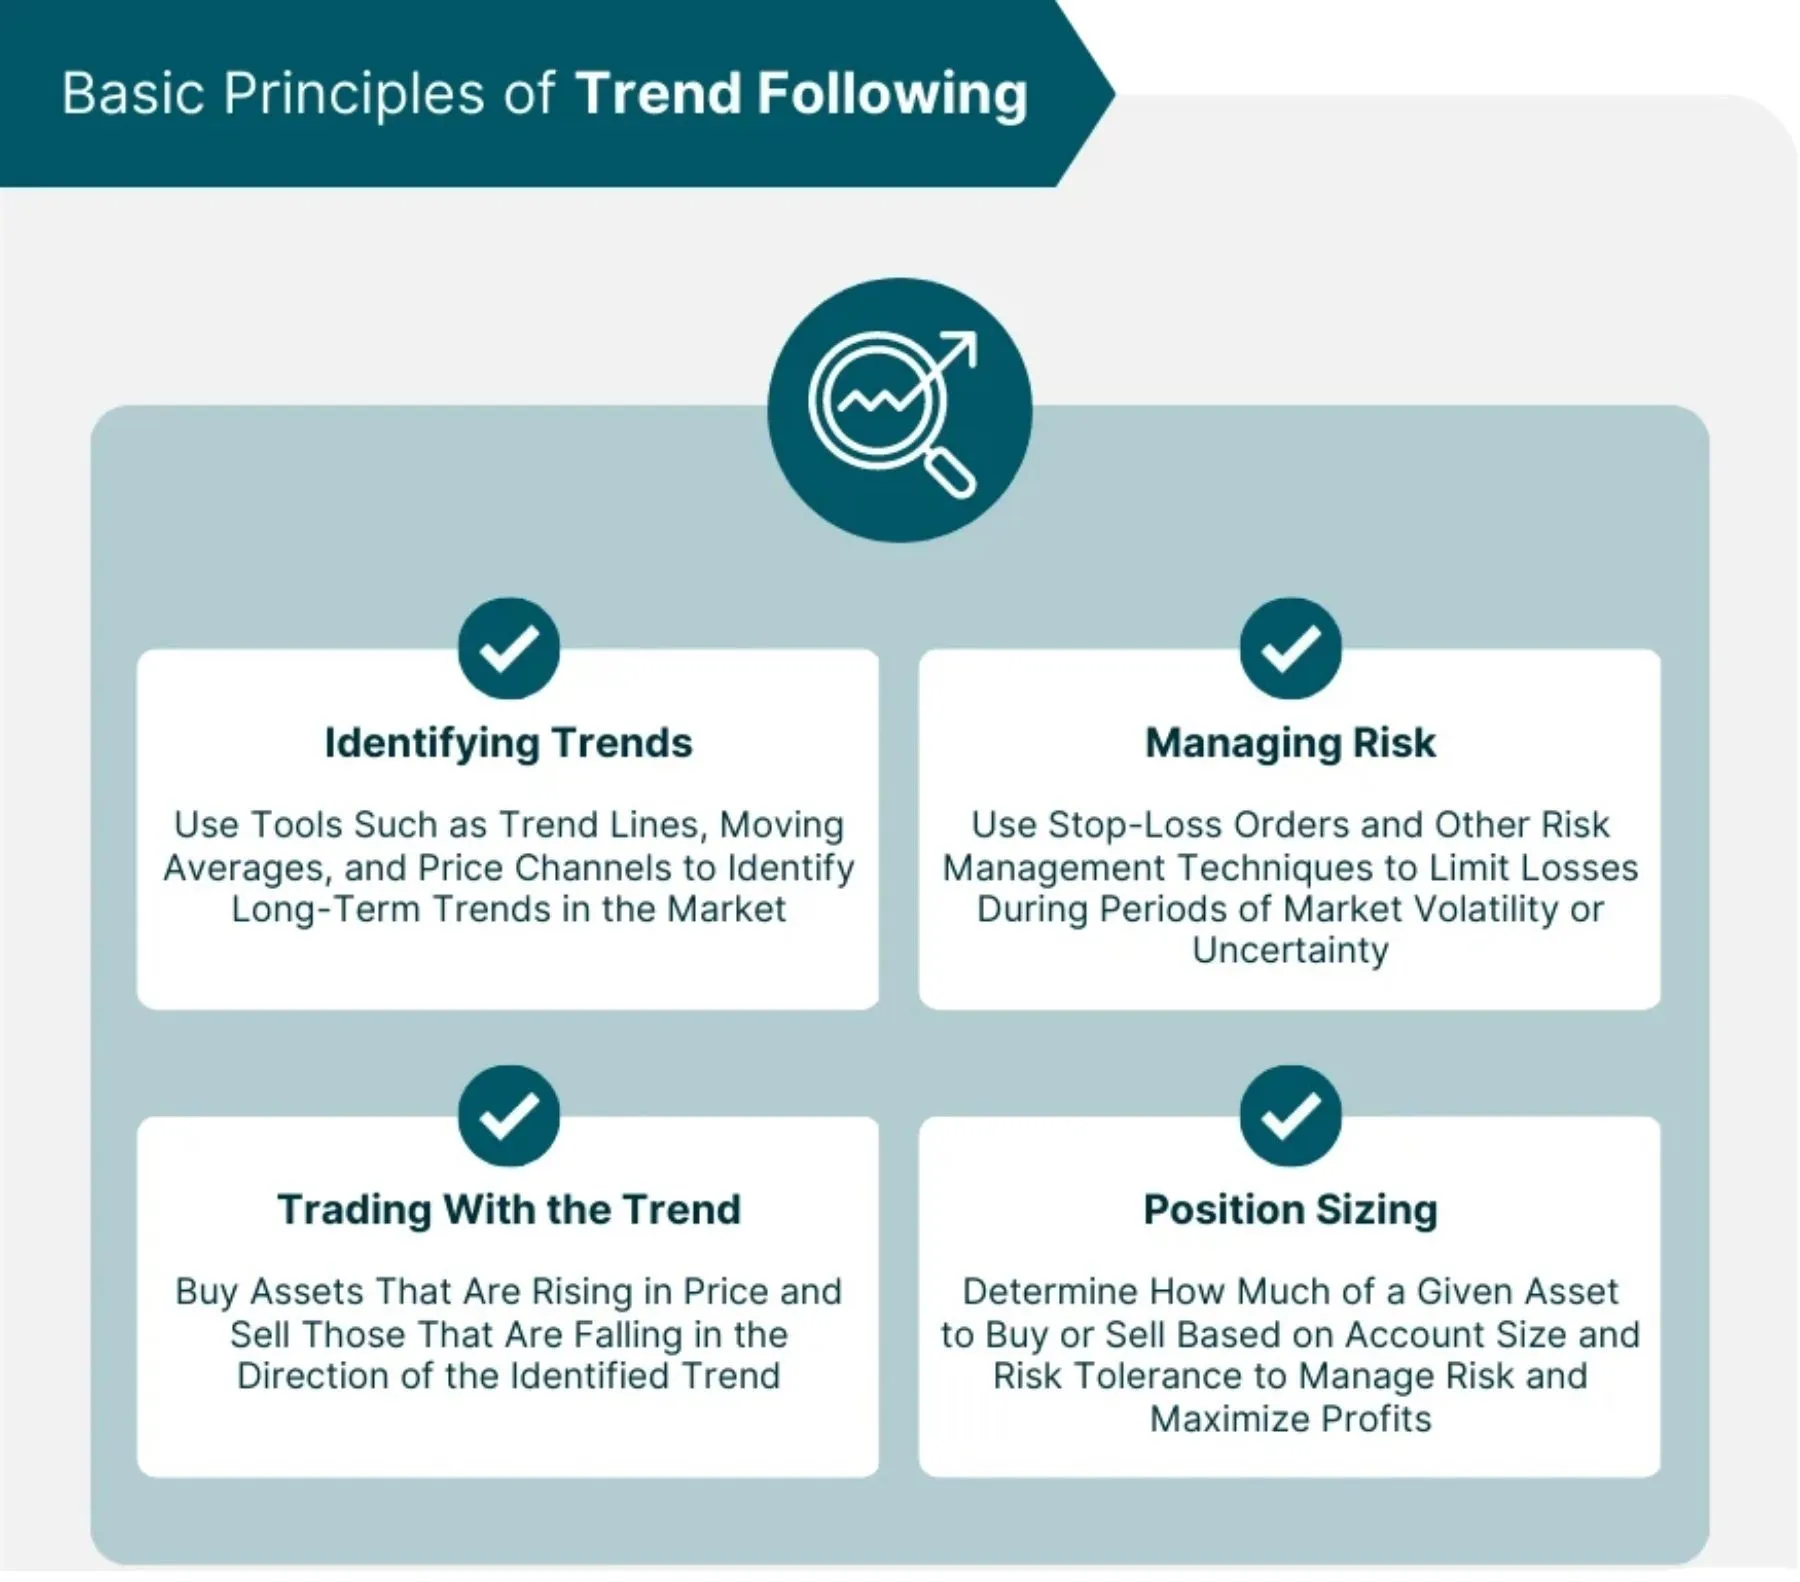
1. Trend Identification: This is the foundation. Before you can follow a trend, you must have a clear, objective rule for defining one. This removes all subjectivity. For example, a system might define an uptrend as the price being above its 200-period Simple Moving Average (SMA). If the price is below the 200 SMA, it is in a downtrend. Another method could be using the Average Directional Index (ADX), where a reading above 25 indicates a trending market. The specific tool doesn’t matter as much as the consistency of its application. This first component acts as a filter, telling you whether you should even be looking for buying or selling opportunities.
2. Entry and Exit Signals: Once a trend is identified, you need specific triggers for when to open and close a trade. These signals must be just as clear and mechanical as the trend identification rule. An entry signal for an uptrend could be a shorter-term moving average (like the 50-period SMA) crossing above a longer-term one (the 200-period SMA). An exit signal might be the reverse cross or the price closing below a certain indicator, like the Parabolic SAR. Exits are just as important as entries, as they determine when you take profits or cut a trade that is no longer working.
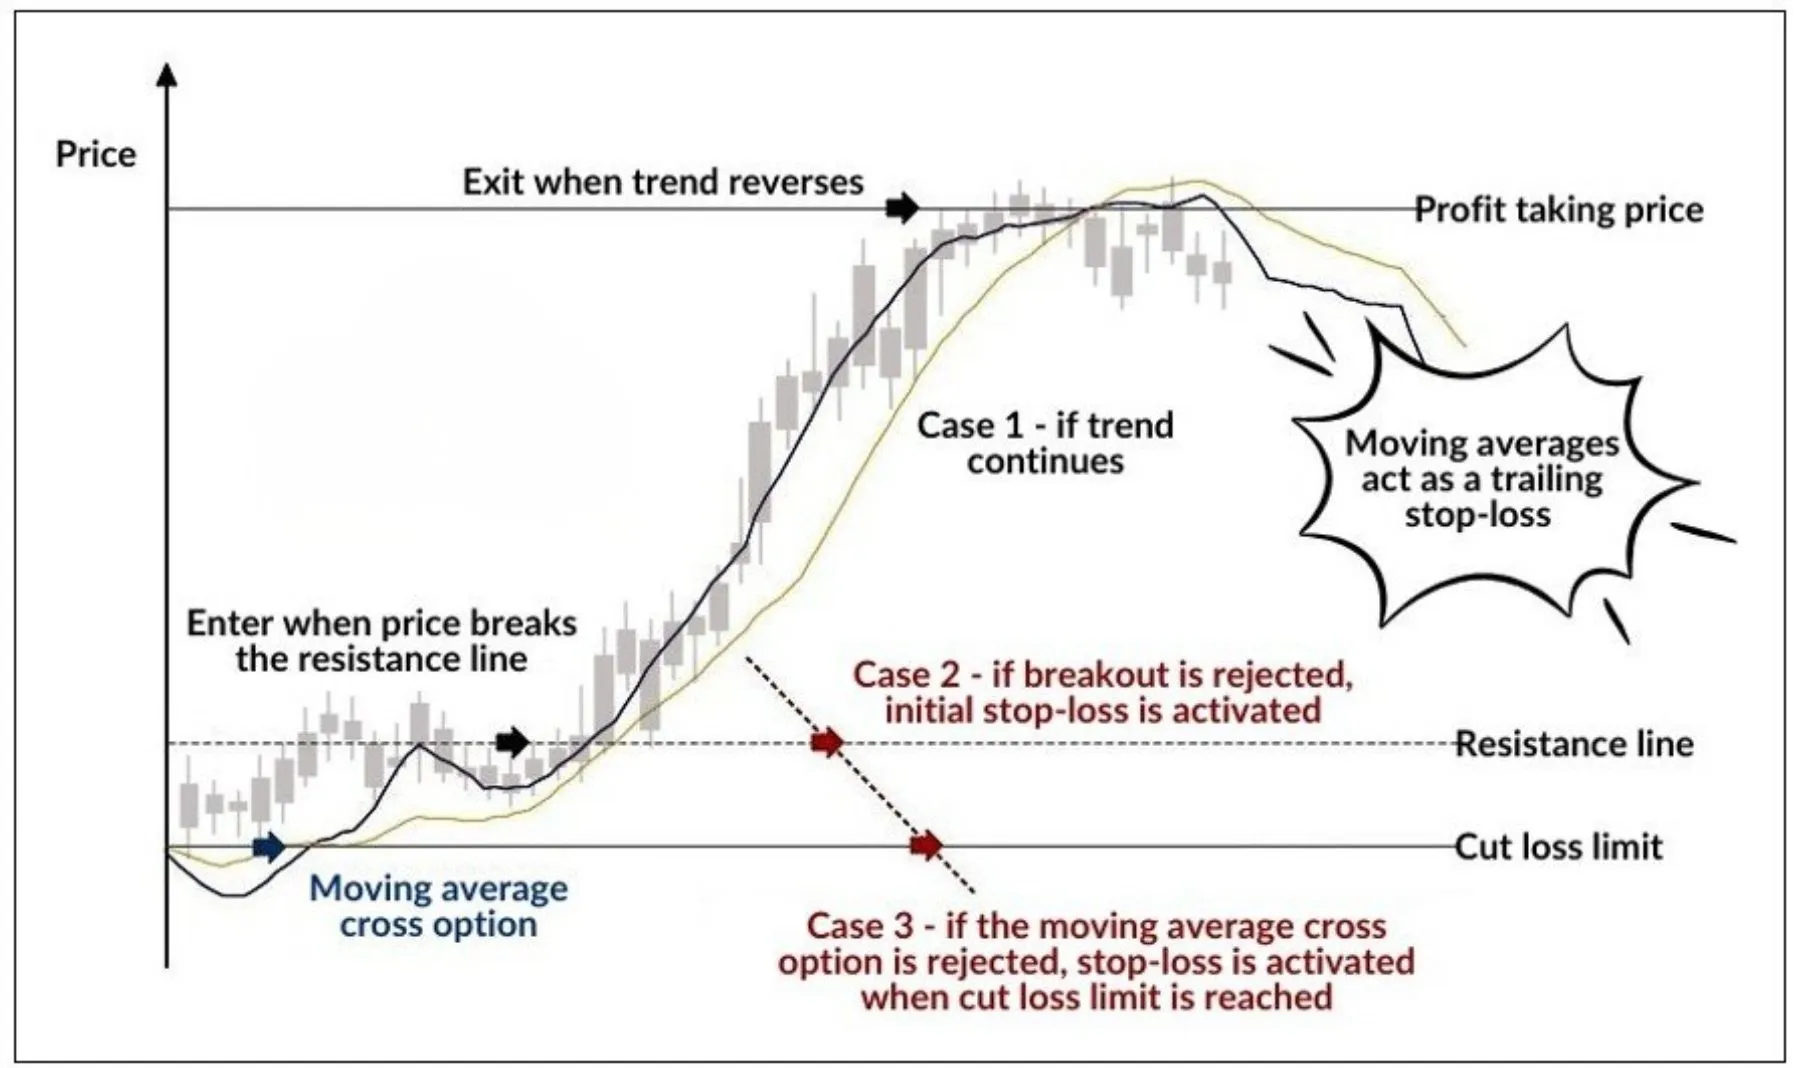
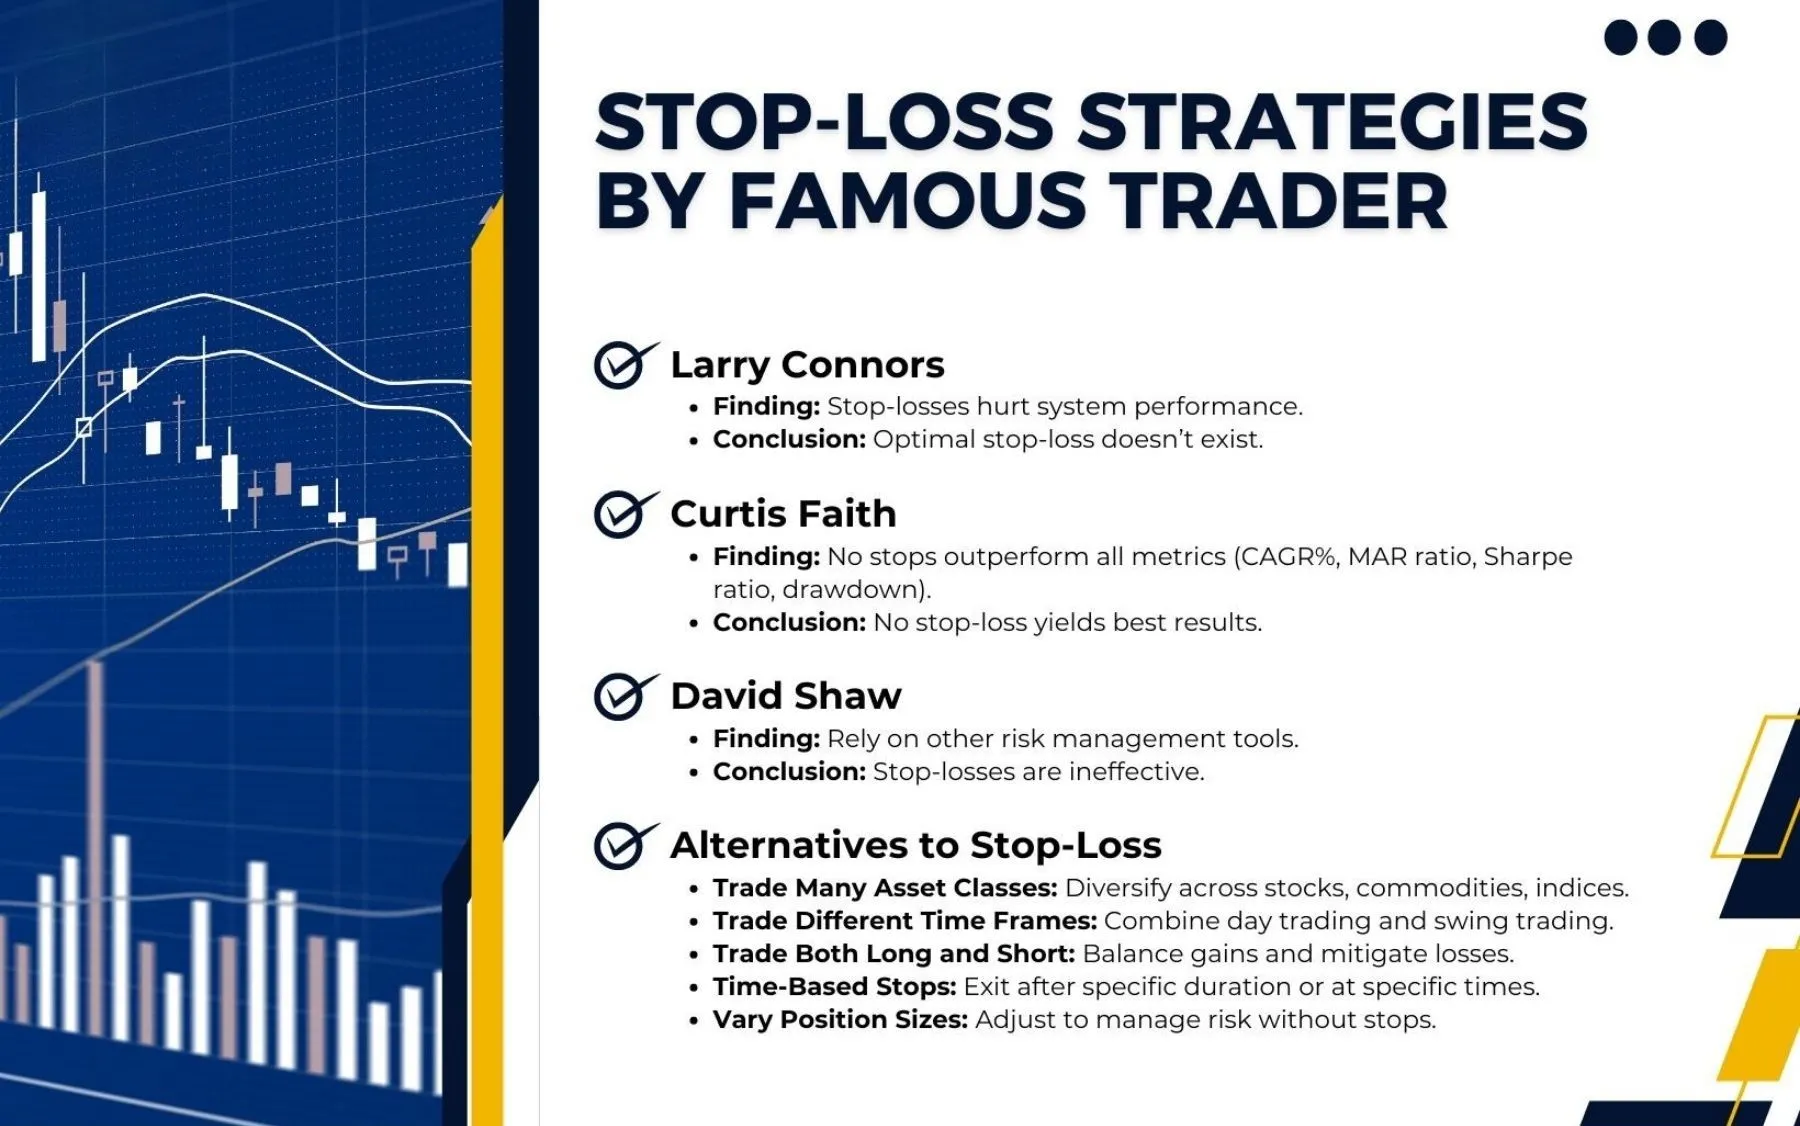
3. Risk Management: This is arguably the most important component. It dictates how you protect your capital. Risk management includes two key rules. The first is position sizing, which determines how much of your account you risk on a single trade. A common rule is to risk no more than 1-2% of your trading capital per trade. The second is the stop-loss order. This is a pre-set order to automatically close your trade at a specific price level if the market moves against you, ensuring a small loss does not turn into a catastrophic one. Without strict risk management, even a great entry and exit system will eventually fail.
What Is the Role of a Stop-Loss in Trend Following?
In a trend-following strategy, the role of a stop-loss is to enforce the core principle of “cut your losses short.” Since these systems are designed to have many small losses and a few very large wins, the stop-loss is the primary tool for keeping those losses small and manageable. Think of it as a mandatory insurance policy on every trade. Because trend-following strategies often have a low win rate (frequently under 50%), a trader will be wrong more often than they are right. Without a disciplined stop-loss strategy, the accumulation of these losing trades would quickly deplete a trading account.
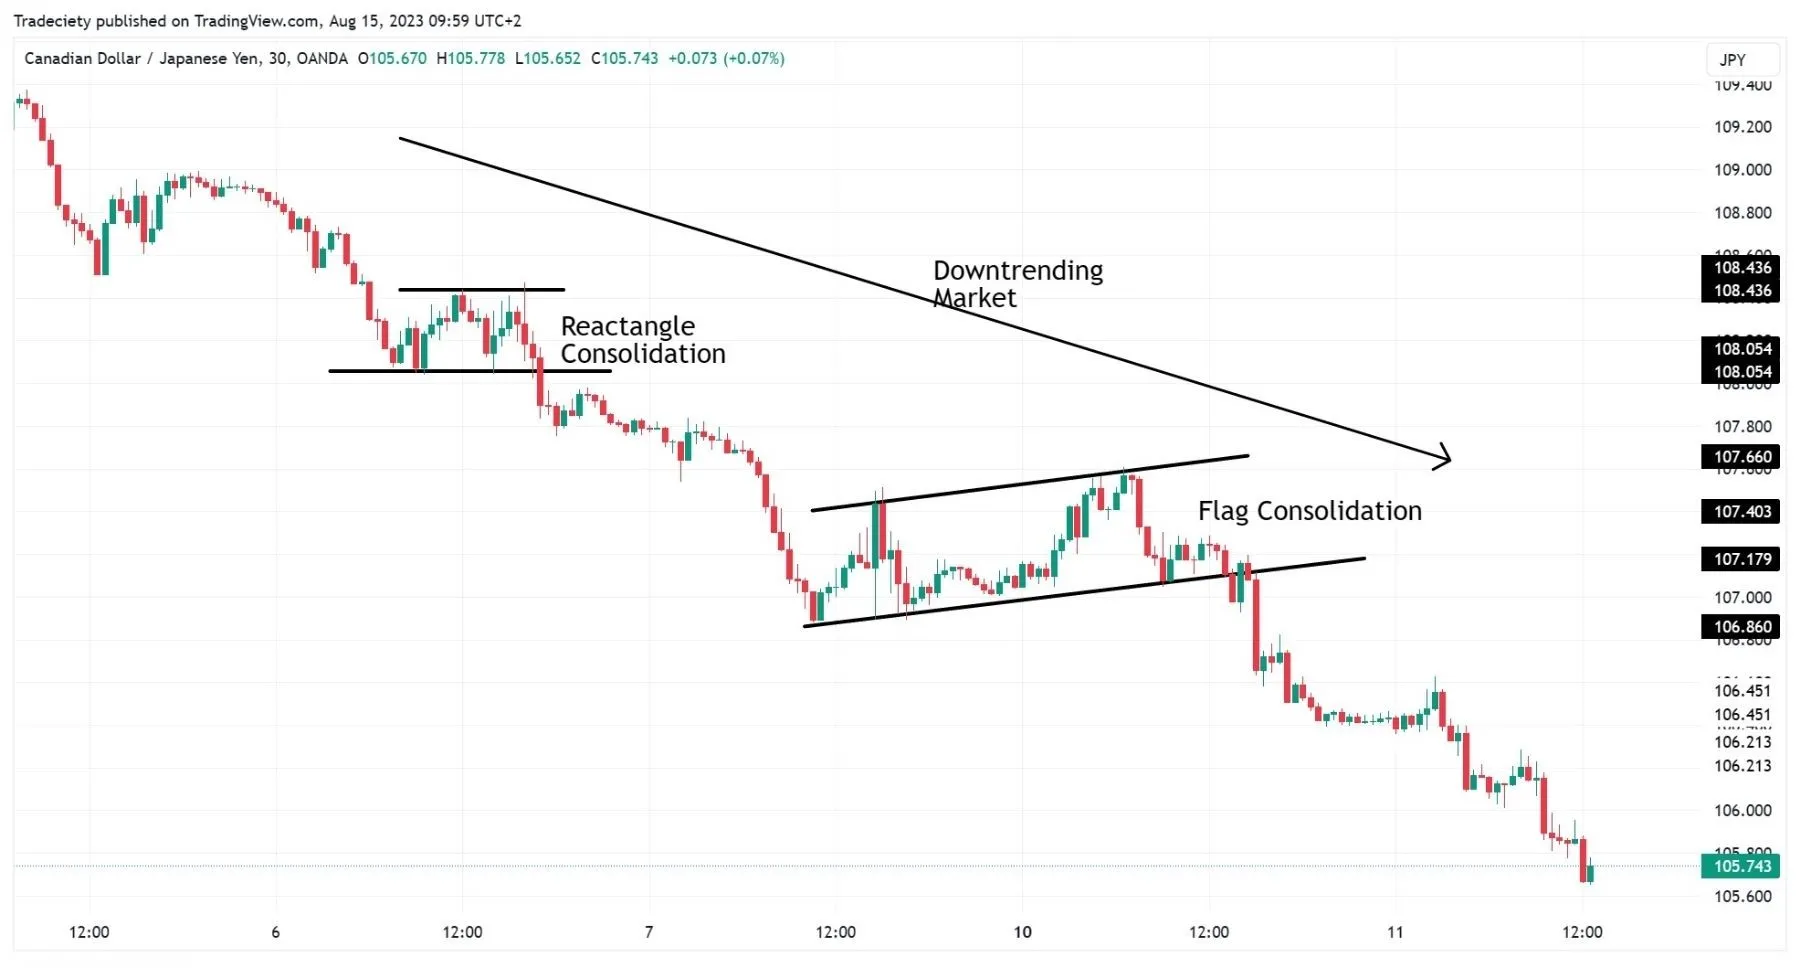
For example, a trader might enter a long position on EUR/USD because their system gave a buy signal. They immediately place a stop-loss order at a predetermined level, perhaps based on a recent price low or an indicator like the Average True Range (ATR). If the expected trend fails to materialize and the price reverses, the stop-loss order is triggered automatically, closing the position for a small, calculated loss. This is a normal and expected outcome. The system is built on the mathematical expectation that one large winning trade, which is allowed to run for weeks or months, will generate a profit large enough to cover all these small, unavoidable losses and still result in a net gain. Therefore, the stop-loss isn’t just a defensive tool; it is an essential part of the offensive strategy, ensuring the trader has enough capital left to be in the market when the next big trend comes along.
What Are Proven Trend-Following Strategies for Forex?
Proven trend-following strategies for forex include the Moving Average Crossover, the Donchian Channel Breakout, and a combination of the ADX and Parabolic SAR indicators. Here’s the breakdown of how to apply these time-tested methods. Each of these strategies provides a mechanical, rules-based approach to trading, which helps remove emotion and subjective analysis. They have remained popular for decades because they are effective at identifying and capturing profits from sustained directional moves in the currency markets. While no strategy is foolproof, these systems offer a solid foundation for building a complete trading plan centered on the philosophy of riding trends. The key to making them work is consistent application and disciplined risk management.
How Do You Use a Moving Average Crossover Strategy?
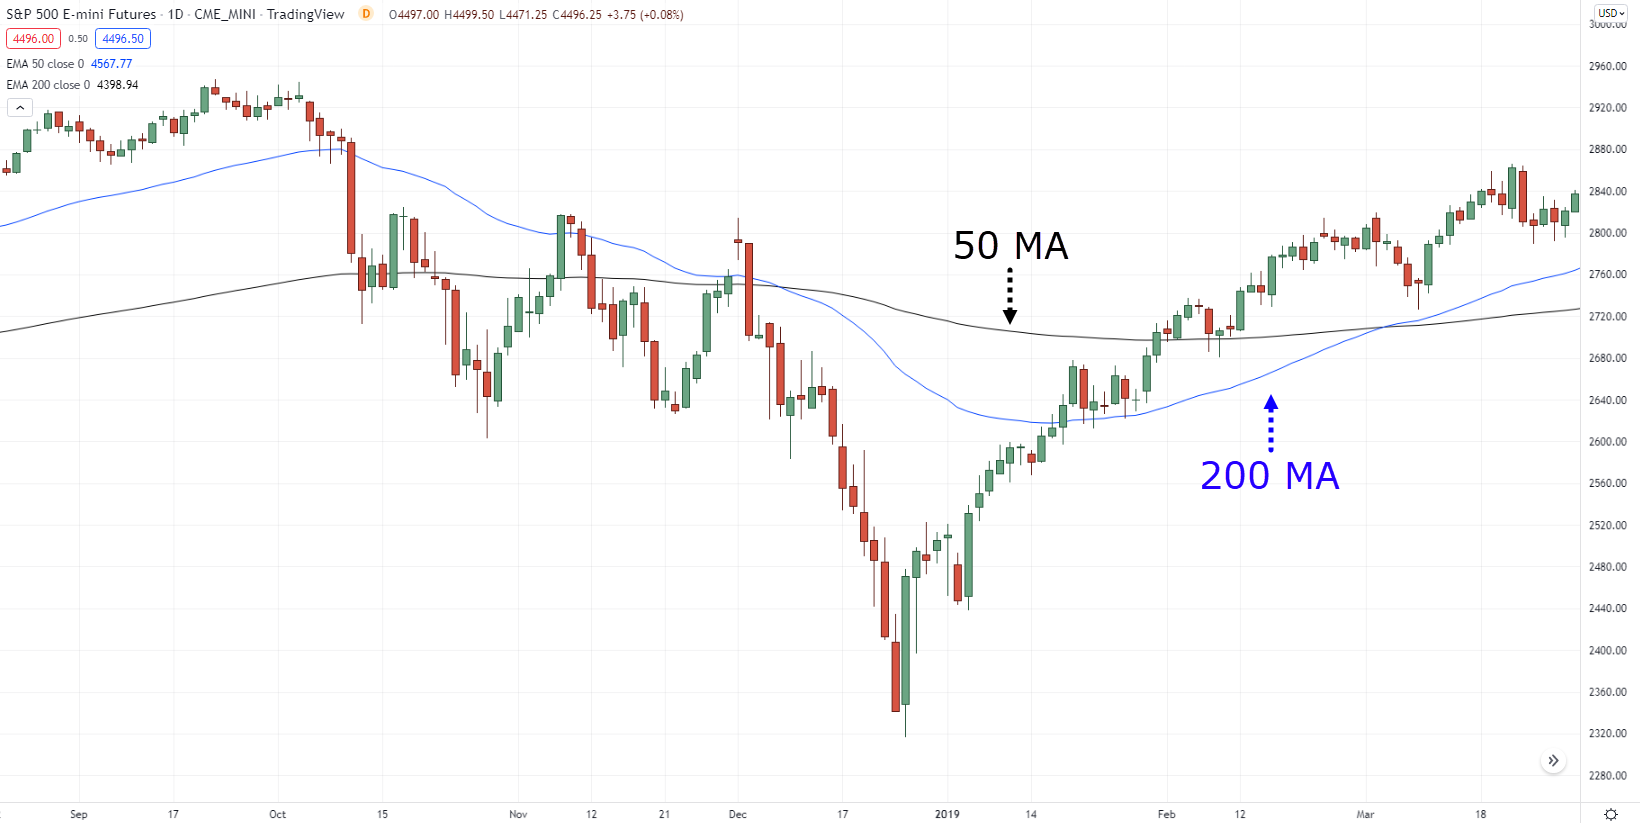
The Moving Average Crossover strategy is a classic trend-following technique that uses two moving averages, a short-term one and a long-term one, to generate trading signals. A popular combination is the 50-period Simple Moving Average (SMA) and the 200-period SMA on a daily chart. The 200 SMA acts as a long-term trend filter, while the 50 SMA identifies more recent momentum shifts.
The rules are simple and clear:
- Buy Signal (Golden Cross): A buy signal is generated when the shorter-term moving average (50 SMA) crosses from below to above the longer-term moving average (200 SMA). This indicates that recent momentum is turning positive and a new uptrend may be starting. A trader would enter a long (buy) trade after the crossover is confirmed on a closed candle.
- Sell Signal (Death Cross): A sell signal occurs when the 50 SMA crosses from above to below the 200 SMA. This suggests that momentum is shifting to the downside and a new downtrend is beginning. A trader would enter a short (sell) trade.
- Exit Strategy: The simplest exit is to close the position when the opposite signal occurs. For example, if you are in a long trade, you would exit when the 50 SMA crosses back below the 200 SMA. A stop-loss should always be used to manage risk, often placed below a recent swing low for a long trade or above a recent swing high for a short trade.
Imagine looking at a chart of the USD/JPY. For months, the 50 SMA has been below the 200 SMA as the price trended down. Then, you notice the 50 SMA beginning to curve upwards and finally crossing above the 200 SMA. This is your “golden cross” and your signal to buy, anticipating a new, sustained uptrend.
How Do You Use a Donchian Channel Breakout Strategy?
The Donchian Channel Breakout strategy is a pure price-action method made famous by the legendary Turtle Traders. It identifies trends by looking for price breakouts of recent highs or lows. The Donchian Channel indicator plots the highest high and the lowest low over a specific period, such as the last 20 trading days. This creates an upper band and a lower band around the price.
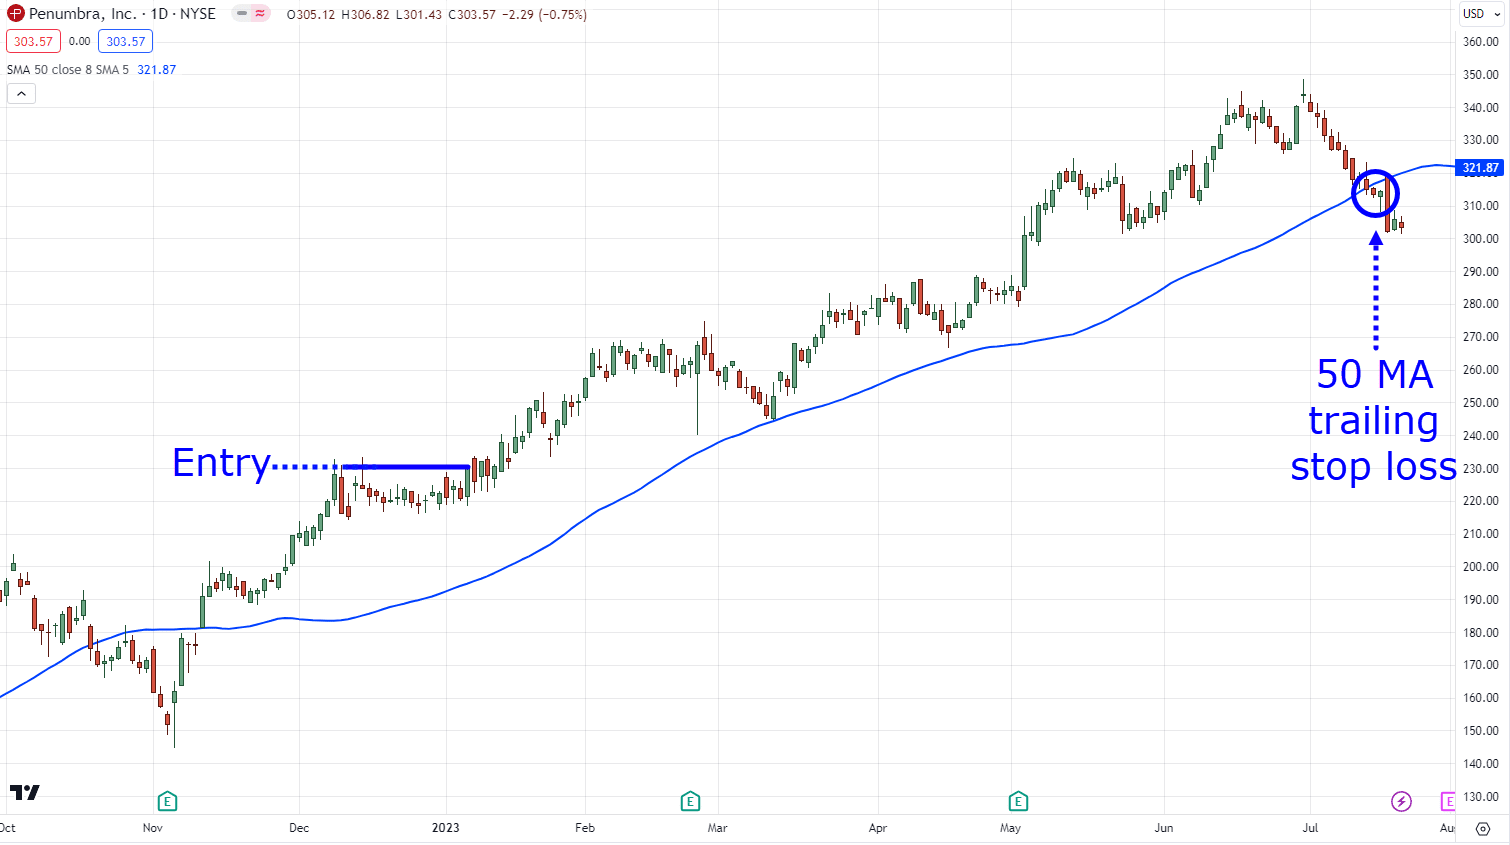
Here is how the strategy works:
- Buy Signal: A buy signal is generated when the price closes above the upper band of the Donchian Channel. For a 20-period channel, this means the price has just made a new 20-day high. This breakout signals that buying pressure is strong enough to push the market to new levels, suggesting the start or continuation of an uptrend. A trader would enter a long position on this breakout.
- Sell Signal: A sell signal occurs when the price closes below the lower band of the Donchian Channel. This means the price has made a new 20-day low, indicating strong selling pressure and a potential downtrend. A trader would enter a short position.
- Exit Strategy: An exit for a long position could be when the price touches the lower channel band. Conversely, a short position would be exited when the price touches the upper channel band. A stop-loss is typically placed based on volatility, for instance, using a multiple of the Average True Range (ATR) below the entry price for a long trade.
This strategy is powerful because it’s purely reactive. It doesn’t try to predict anything; it simply goes with the market’s flow when it shows decisive strength in one direction.
How Do You Use an ADX and Parabolic SAR Strategy?
This strategy combines two indicators to first confirm the strength of a trend and then provide precise entry and exit points. The Average Directional Index (ADX) measures trend strength, not direction, while the Parabolic SAR (Stop and Reverse) indicator provides potential entry and exit signals.
The rules for this combined system are as follows:
1. Confirm Trend Strength with ADX: First, you look at the ADX indicator. A reading above 25 is generally considered to indicate a strong trend. If the ADX is below 25, the market is likely in a range, and you would avoid taking any trend-following trades. This step acts as a filter to keep you out of choppy markets where trend strategies perform poorly.
2. Identify Trend Direction and Entry with Parabolic SAR: Once the ADX confirms a strong trend, you use the Parabolic SAR for your signal. The Parabolic SAR appears as a series of dots either above or below the price candles.
– Buy Signal: If the ADX is above 25 and the Parabolic SAR dots flip from being above the price to below the price, it signals a potential uptrend. You would enter a long (buy) trade.
– Sell Signal: If the ADX is above 25 and the Parabolic SAR dots flip from being below the price to above the price, it signals a potential downtrend. You would enter a short (sell) trade.
3. Exit Strategy: The Parabolic SAR also provides a built-in exit mechanism. You stay in the trade as long as the dots do not flip to the other side of the price. For a long trade, you would exit as soon as a dot appears above a price candle. This provides a dynamic trailing stop that helps lock in profits as the trend progresses.
Why Do Trend-Following Strategies Work in Forex?
Trend-following strategies work in forex because they capitalize on sustained, directional price movements driven by underlying economic fundamentals, central bank policies, and persistent herd behavior. In detail, these strategies are profitable over the long term not because they predict the future, but because they are designed to systematically capture the “fat tails” of market returns, which are the rare but exceptionally large price moves. Forex markets are known for creating powerful trends that can last for months or even years, often initiated by shifts in interest rate differentials, economic growth prospects, or geopolitical events. A trend-following system is built to participate in these massive moves. While it may suffer many small losses in directionless markets, a single successful trade that catches a major trend can generate profits that far outweigh all the previous losses, leading to long-term profitability.
Does Market Volatility Help or Hurt Trend Following?
Market volatility has a dual relationship with trend following; it can both help and hurt, depending on its nature. Sustained, directional volatility is the lifeblood of a trend-following strategy. When a currency pair moves decisively in one direction with strong momentum, volatility is high, and the trend follower profits handsomely. This is the ideal environment, as the strategy is designed to capture these large, extended swings. For example, a major central bank announcement that triggers a multi-month trend in EUR/USD is exactly what these systems are built for.
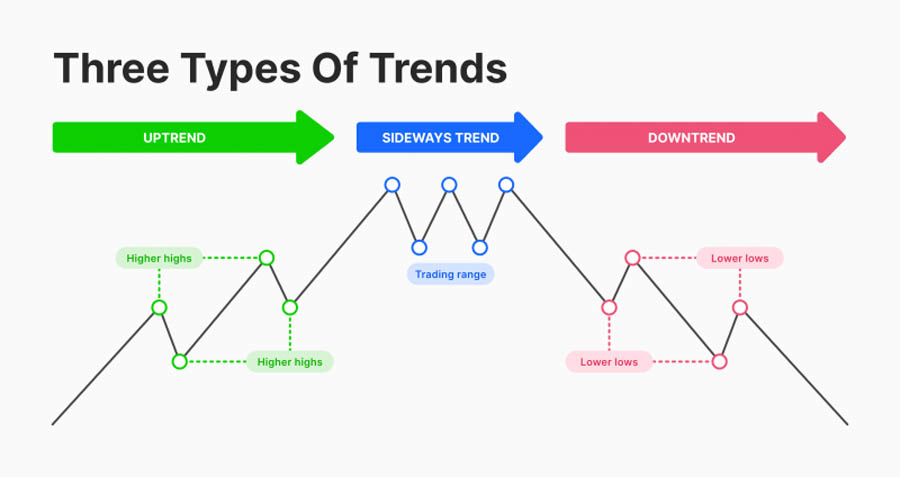
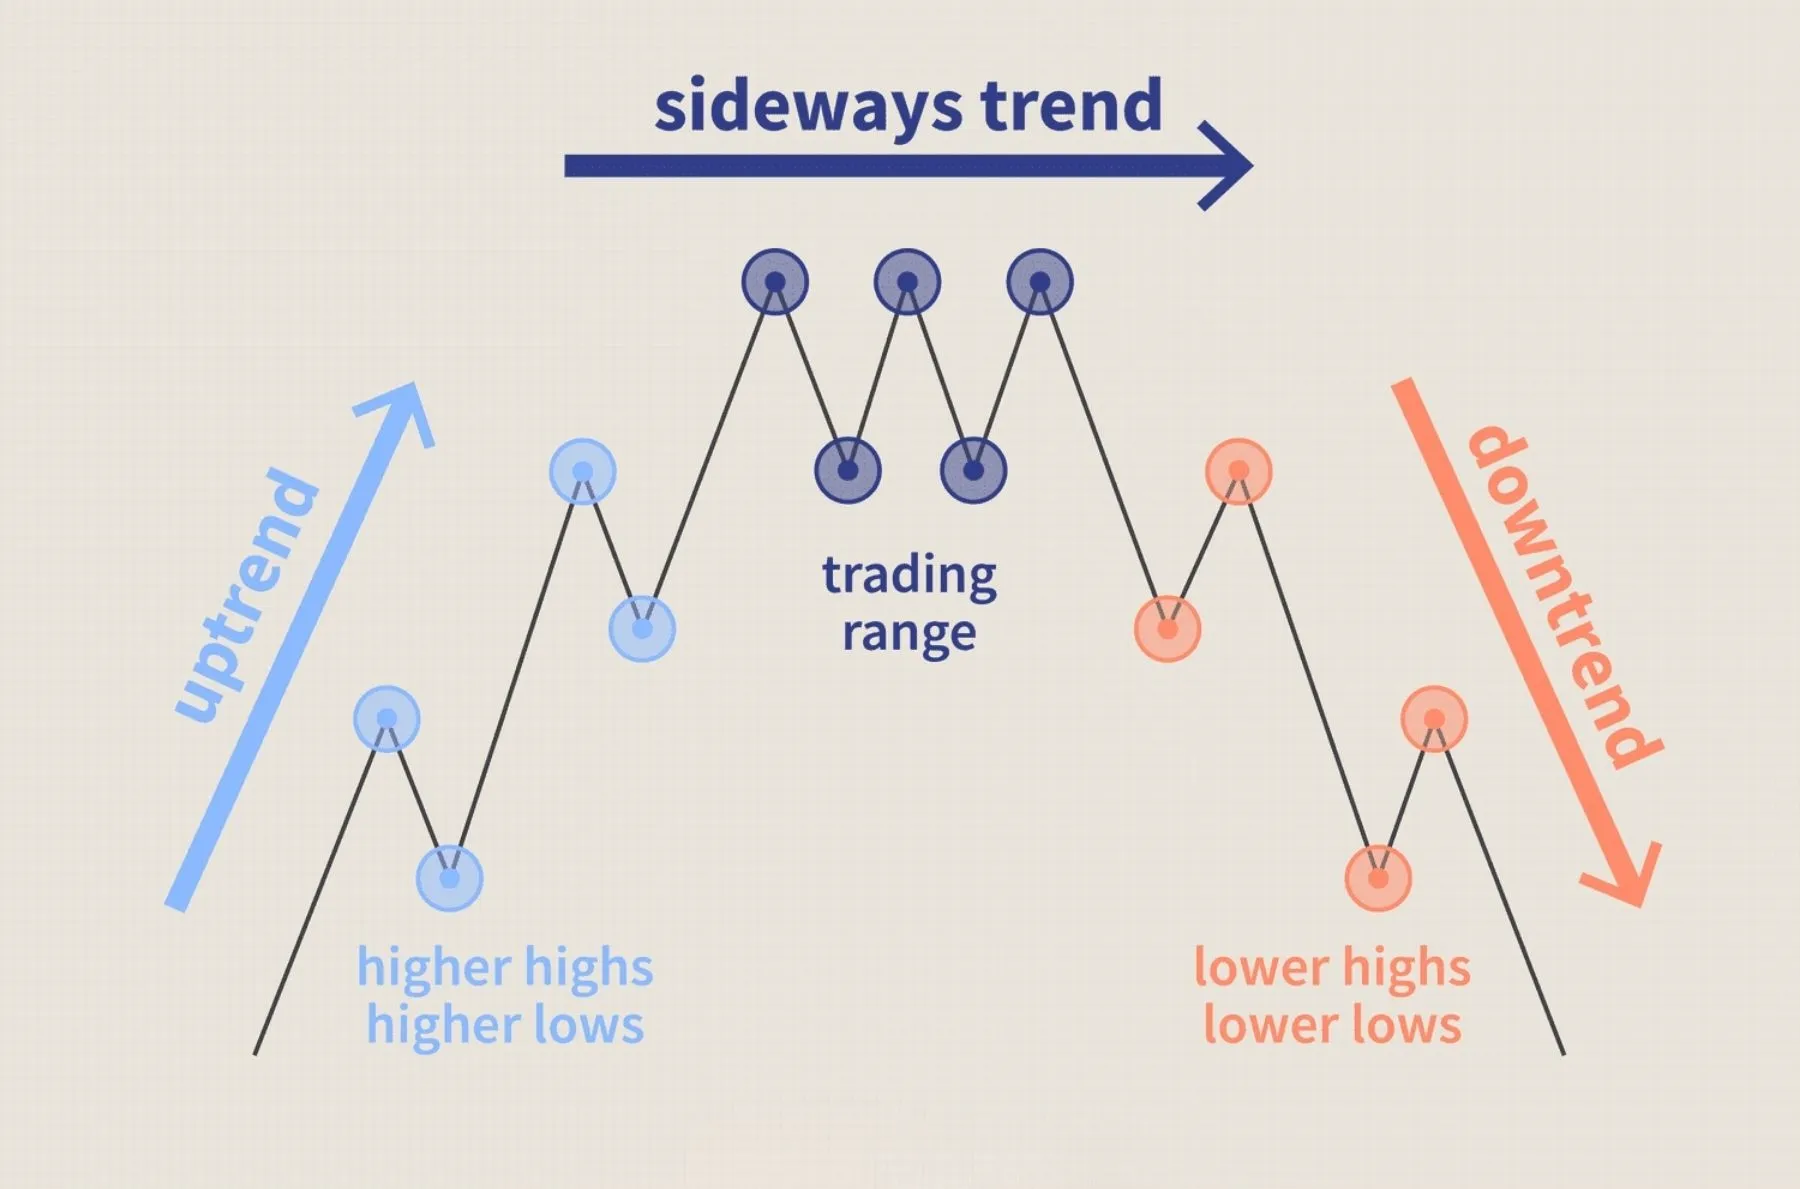
However, volatility is harmful when it is choppy and non-directional. This type of environment is known as a “ranging” or “sideways” market. In these conditions, the price fluctuates up and down within a confined range without establishing a clear direction. A trend-following system will generate frequent false signals. It might signal a buy at the top of the range just before the price reverses down, hitting the stop-loss. Then, it might signal a sell at the bottom of the range right before the price bounces back up, triggering another small loss. These rapid price swings, often called “whipsaws,” are the primary enemy of trend followers, leading to a series of frustrating but manageable losses. The success of the strategy hinges on its ability to survive these difficult periods to be ready for the next big trend.
What Is the Typical Win Rate for a Trend-Following Strategy?
The typical win rate for a trend-following strategy is often surprisingly low, frequently falling below 50% and sometimes as low as 30-40%. This is a critical concept for traders to understand and accept. The profitability of these systems does not come from being right often. Instead, it comes from the size of the winning trades being substantially larger than the size of the losing trades. This is known as having a positive expectancy or a high reward-to-risk ratio. The entire philosophy is built around a simple mathematical principle: a few massive wins will more than compensate for many small losses.
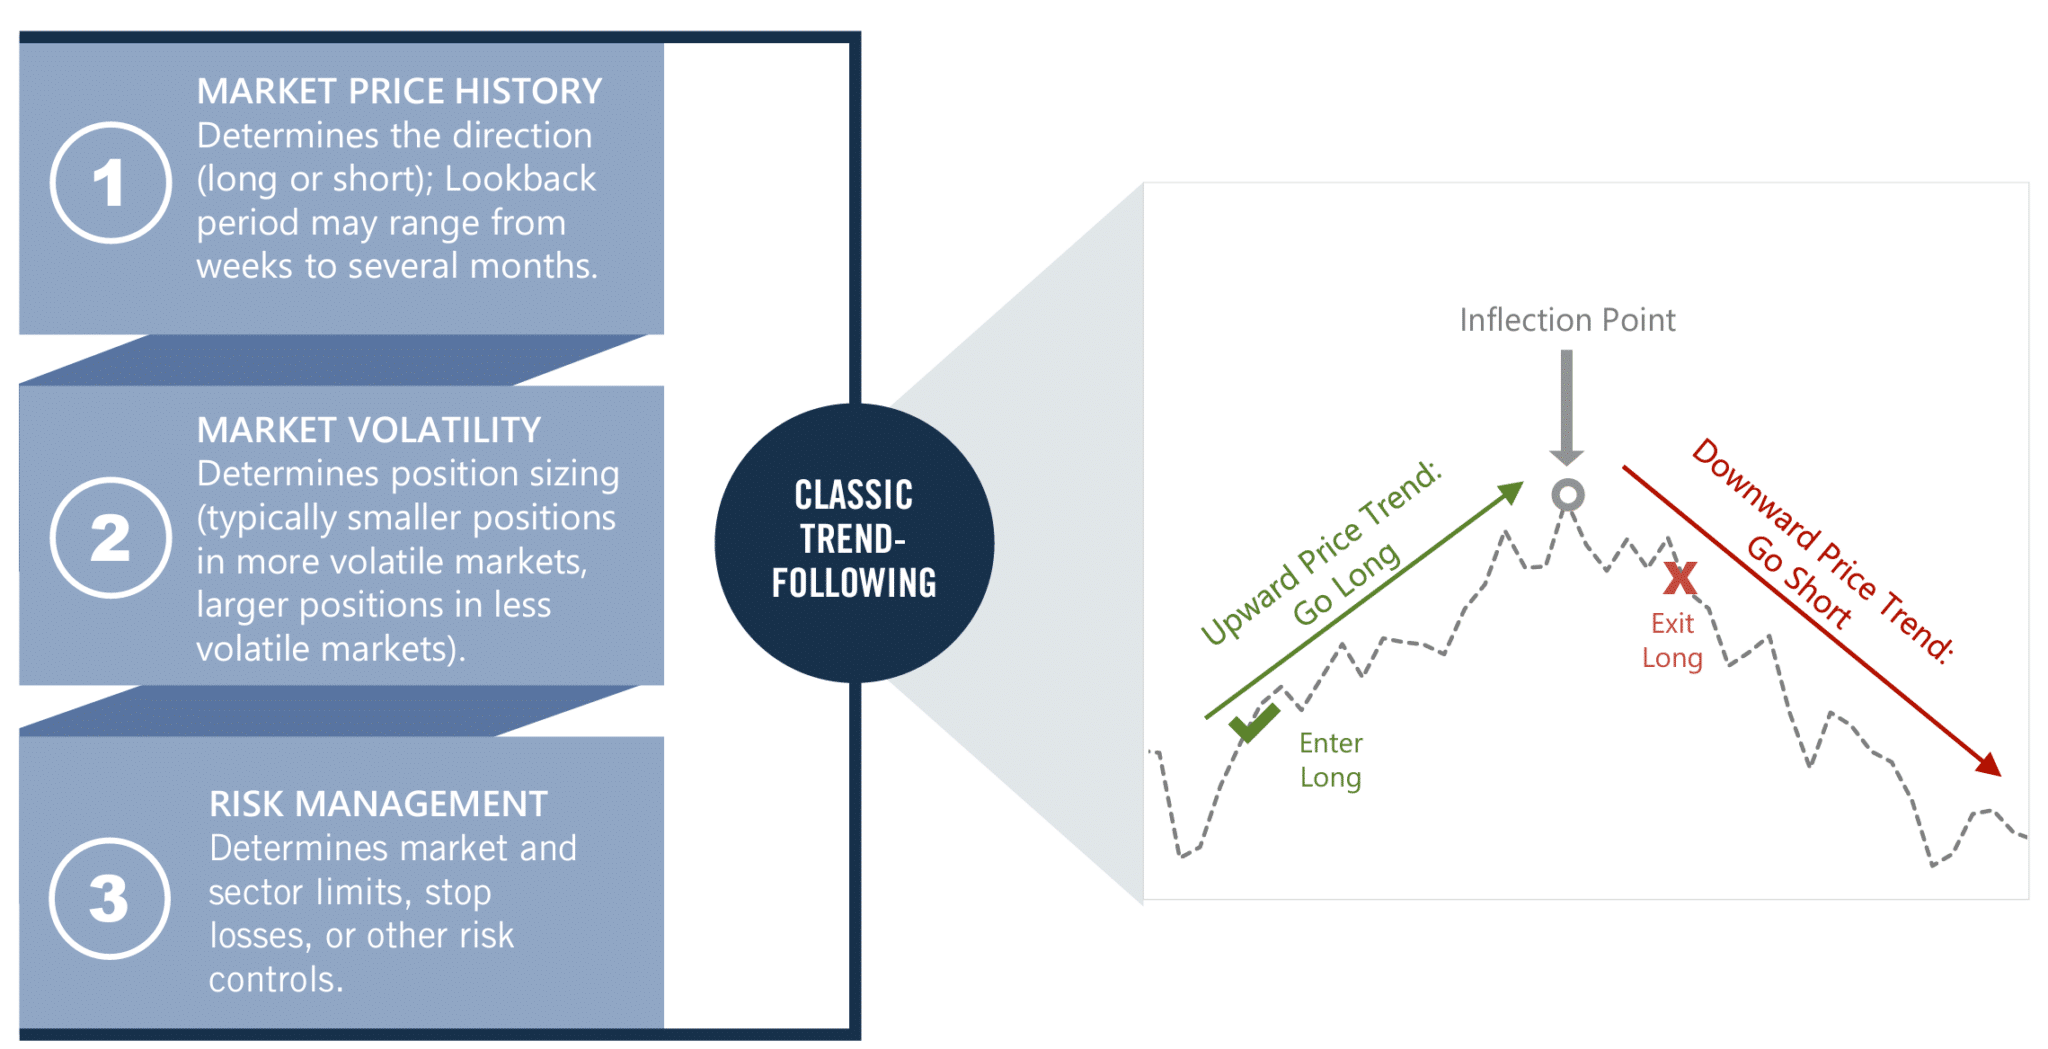
Let’s look at a simple example. Imagine a system over 10 trades:
- It has 7 losing trades, each losing $100 (a total loss of $700).
- It has 3 winning trades, but each of these wins generates $500 (a total profit of $1,500).
Despite a win rate of only 30%, the net profit is $800 ($1,500 profit – $700 loss). This illustrates the core logic perfectly. The strategy is designed to cut losing trades quickly via a stop-loss, keeping those losses small and predictable. In contrast, winning trades are allowed to run as long as the trend continues, capturing huge moves. This asymmetric return profile is what makes trend-following profitable over time, but it requires immense psychological discipline to execute a strategy that is wrong more than half the time.
What Else Should Forex Traders Know About Trend Following?
Successful trend following requires understanding its core principles, from its contrast with other strategies to the psychological discipline needed to execute it. Additionally, traders must learn to use the right indicators, timeframes, and risk management techniques to navigate different market conditions effectively. Mastering these related concepts is what separates consistently profitable trend followers from those who give up during inevitable drawdowns.
What Is the Difference Between Trend Following and Mean Reversion?
Trend following and mean reversion are two opposing trading philosophies built on different assumptions about how market prices behave. A trend follower bets on the continuation of momentum, buying into strength and selling into weakness. In contrast, a mean reversion trader bets that price will return to its historical average, buying weakness and selling strength. Trend followers believe that a market moving in one direction is likely to continue in that direction. Mean reversion traders believe that extreme price moves are temporary and unsustainable.
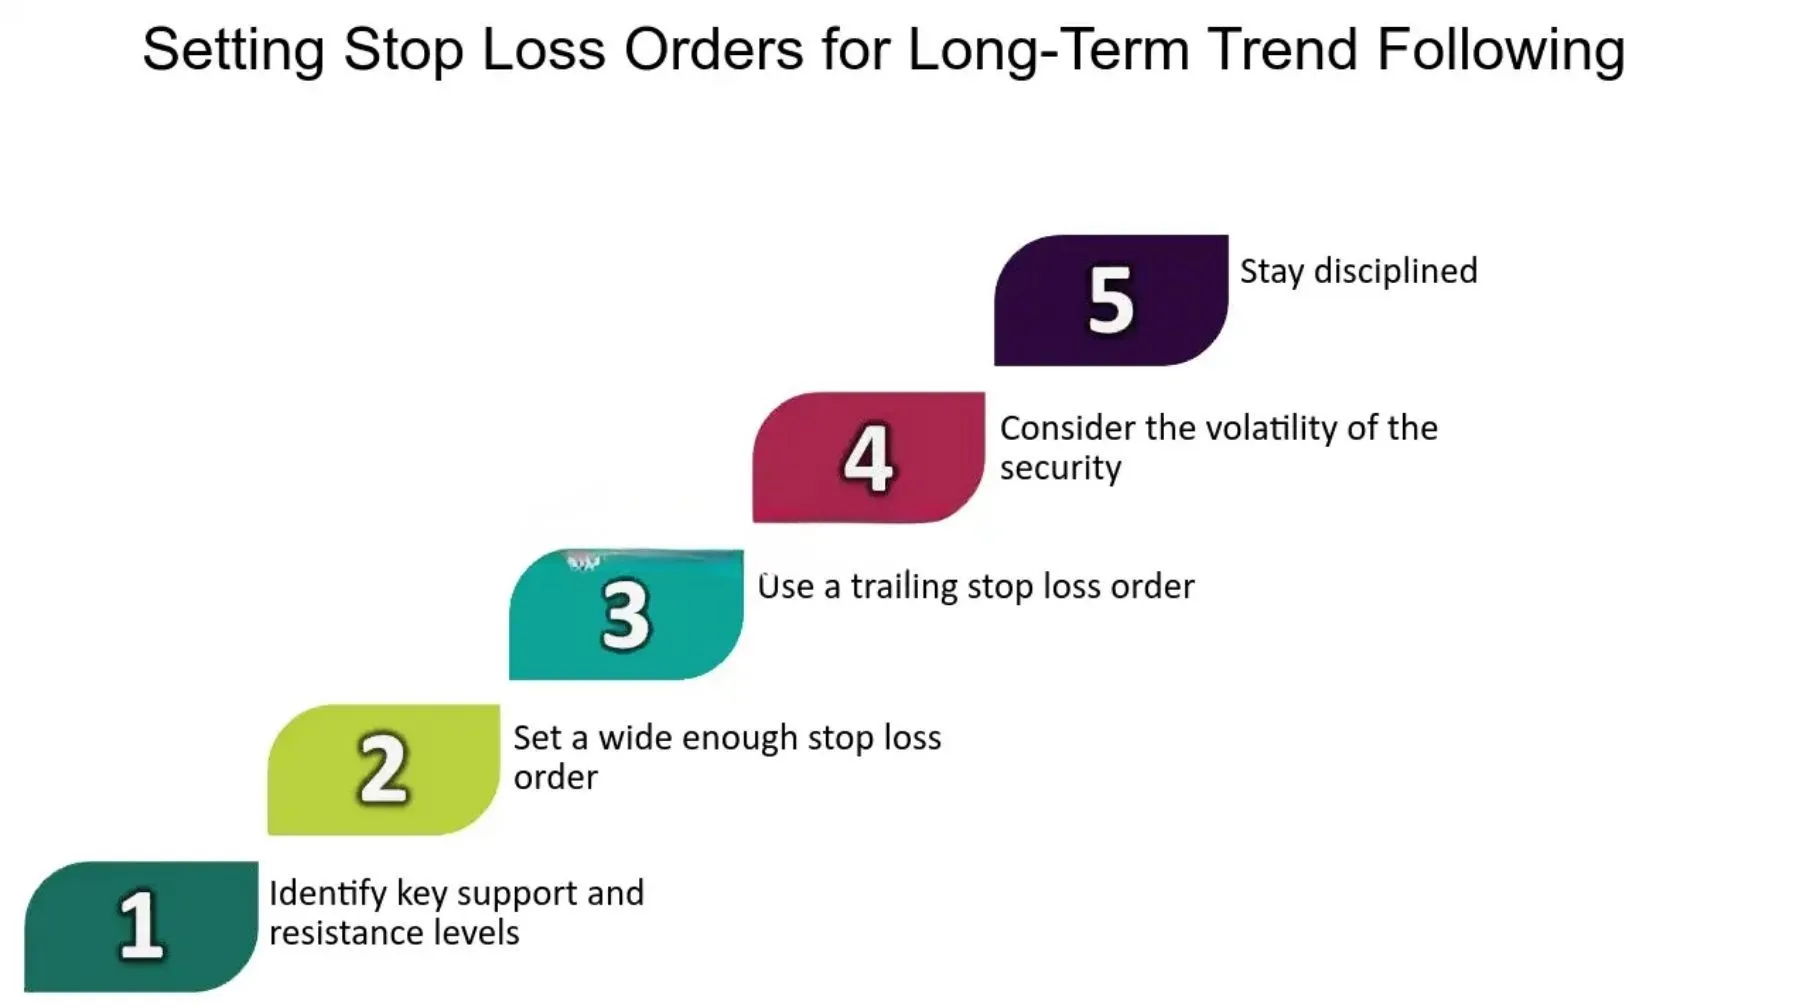
To better understand their differences, let’s compare their core characteristics.
- Market Conditions: Trend following performs best in markets with clear, sustained directional moves, such as a strong bull or bear market. Mean reversion excels in ranging or choppy markets where price oscillates between predictable support and resistance levels without a clear long term direction.
- Entry and Exit Points: A trend follower enters a trade after a trend has been established, often on a breakout to a new high or low. They exit when the trend shows signs of reversing. A mean reversion trader enters when the price is far from its average, viewing it as oversold or overbought, and exits when the price returns closer to that average.
- Risk Profile: Trend following strategies typically have a low win rate but a high reward to risk ratio. This means many small losses are offset by a few very large wins. Mean reversion has a high win rate but a low reward to risk ratio, generating many small wins but risking large losses if a new trend begins and the price does not revert as expected.
What are the Best Indicators for Identifying a Forex Trend?
While moving averages are a foundational tool, several other indicators offer deeper insights into a trend’s strength and validity. A well rounded trend follower uses a combination of tools to confirm signals and avoid false breakouts. Combining indicators that measure different aspects of price action, such as momentum, volatility, and volume, provides a more complete picture of the market.
Here are some of the most effective indicators for identifying Forex trends.
- Average Directional Index (ADX): The ADX is a popular indicator that measures the strength of a trend, not its direction. A reading above 25 typically suggests a strong trend is in place (either up or down), while a reading below 20 indicates a weak or non-existent trend. Trend followers use the ADX to filter trades, focusing only on currency pairs that show strong directional momentum.
- Ichimoku Cloud (Ichimoku Kinko Hyo): This is an all in one indicator that provides information on trend direction, momentum, and support and resistance levels. When the price is above the cloud (known as the Kumo), the trend is considered bullish. When the price is below the cloud, the trend is bearish. The thickness of the cloud also indicates the strength of support or resistance.
- On-Balance Volume (OBV): OBV is a momentum indicator that uses volume flow to predict changes in stock price. The core idea is that volume precedes price. If OBV is rising while price is rising, it confirms the uptrend. If OBV is falling while price is falling, it confirms the downtrend. Divergence between price and OBV can signal a potential trend reversal.
What Is the Best Timeframe for Trend Following?
Trend-following strategies can be applied to nearly any timeframe, but their effectiveness and implementation change depending on the chart duration. The best timeframe for trend following is typically a higher one, such as the daily or weekly chart, as it filters out market noise and reveals more reliable, sustained trends. Shorter timeframes, like the 15 minute or 1 hour charts, are filled with more random price fluctuations that can trigger false signals and lead to whipsaws, where a trader is stopped out of a position only for the market to reverse back in the original direction.
Longer timeframes offer several distinct advantages for trend followers.
- Clarity and Reliability: Trends on daily and weekly charts represent significant shifts in market sentiment and are often driven by fundamental factors. These trends tend to be more durable and produce larger price moves, leading to a higher profit potential per trade.
- Reduced Stress: Trading on higher timeframes requires less screen time and fewer decisions. A trader might only need to check their charts once per day, reducing the emotional pressure and cognitive load associated with fast paced day trading.
- Wider Stops: Because higher timeframes have greater volatility, they require wider stop-losses. This gives a trade more room to breathe and avoids premature exits due to normal market fluctuations.
How Do You Manage Risk When Trend Following?
Effective risk management is the cornerstone of any successful trend-following strategy, especially given its characteristic low win rate. Beyond placing a simple stop-loss, advanced techniques help protect capital and optimize trade size. The two most critical components of advanced risk management for trend followers are dynamic stop-loss placement using volatility and disciplined position sizing. These methods ensure that losses are always contained within a predefined comfort zone, allowing a trader to survive the inevitable strings of losing trades.

Here is how you can implement these advanced risk management concepts.
- Use the Average True Range (ATR) for Stops: Instead of a fixed percentage or pip value, use the ATR to set a dynamic stop-loss. The ATR measures market volatility. A common technique is to place a stop-loss at a multiple of the ATR, for instance, 2x ATR below your entry for a long position. This adapts your risk to current market conditions, giving trades more room during volatile periods and tightening stops during quiet periods.
- Implement Fixed Fractional Position Sizing: This method involves risking a fixed percentage of your trading capital on every single trade, typically between 1% and 2%. To calculate your position size, you first determine your risk in dollars (e.g., 1% of a $10,000 account is $100). Then, you divide that dollar amount by your stop-loss distance in pips. This ensures that no single trade can inflict catastrophic damage on your account.
What Is the Biggest Psychological Challenge for Trend Followers?
The biggest psychological challenge for trend followers is maintaining discipline during long periods of drawdown and weathering multiple consecutive losses. Trend-following systems are defined by a low win rate, meaning a trader may lose on more than half of their trades. While the few large wins are designed to outweigh the many small losses, the emotional toll of frequent losing streaks is difficult to handle. This can cause traders to abandon a perfectly valid system right before it produces a massive winning trade.
This core challenge leads to several other psychological hurdles.
- The Fear of Missing Out (FOMO): After a series of losses, a trader might hesitate to take the next valid signal, fearing another loss. If that trade becomes a huge winner without them, the feeling of regret can lead to impulsive, rule breaking behavior on future trades.
- The Temptation to Exit Winners Early: A core principle of trend following is to “let your winners run”. However, after watching a small profit grow, it is psychologically tempting to lock it in rather than risk giving it back. This cuts off the potential for the large, trend-defining wins that are necessary for the strategy’s long term profitability. Sticking to the plan and trusting the exit signal requires immense emotional fortitude.