

Blog
How to Trade a Forex Breakout Strategy: Identifying, Executing, and Managing Trades

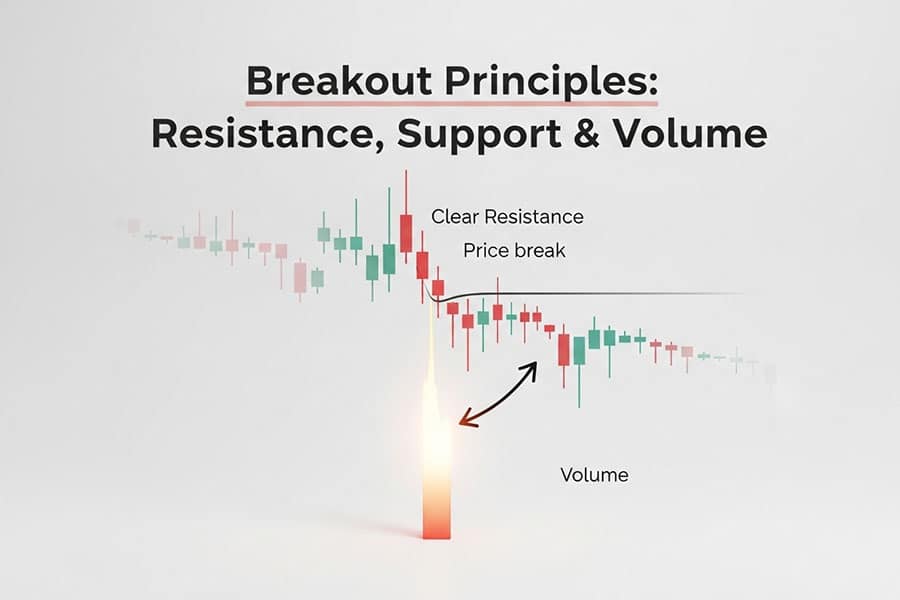
Trading a forex breakout strategy involves identifying a key support or resistance level where a currency pair is consolidating, waiting for a decisive price move beyond that level confirmed by increased volume, and then executing a trade in the direction of the breakout. Proper management requires setting a clear stop-loss on the opposite side of the broken level and establishing a take-profit target based on the prior market structure or a fixed risk-to-reward ratio. This approach allows traders to enter the market at the potential start of a new, strong directional move.
The key components of a valid forex breakout are a clearly defined support or resistance level, a period of price consolidation where buying and selling pressure are in equilibrium, and a confirmation signal, which is typically a surge in both volume and volatility as price pushes through the level. Without these elements, a price move might just be random noise rather than the beginning of a sustainable trend. Recognizing these components helps filter out low-probability setups and reduces the risk of entering a false breakout, or “fakeout.”
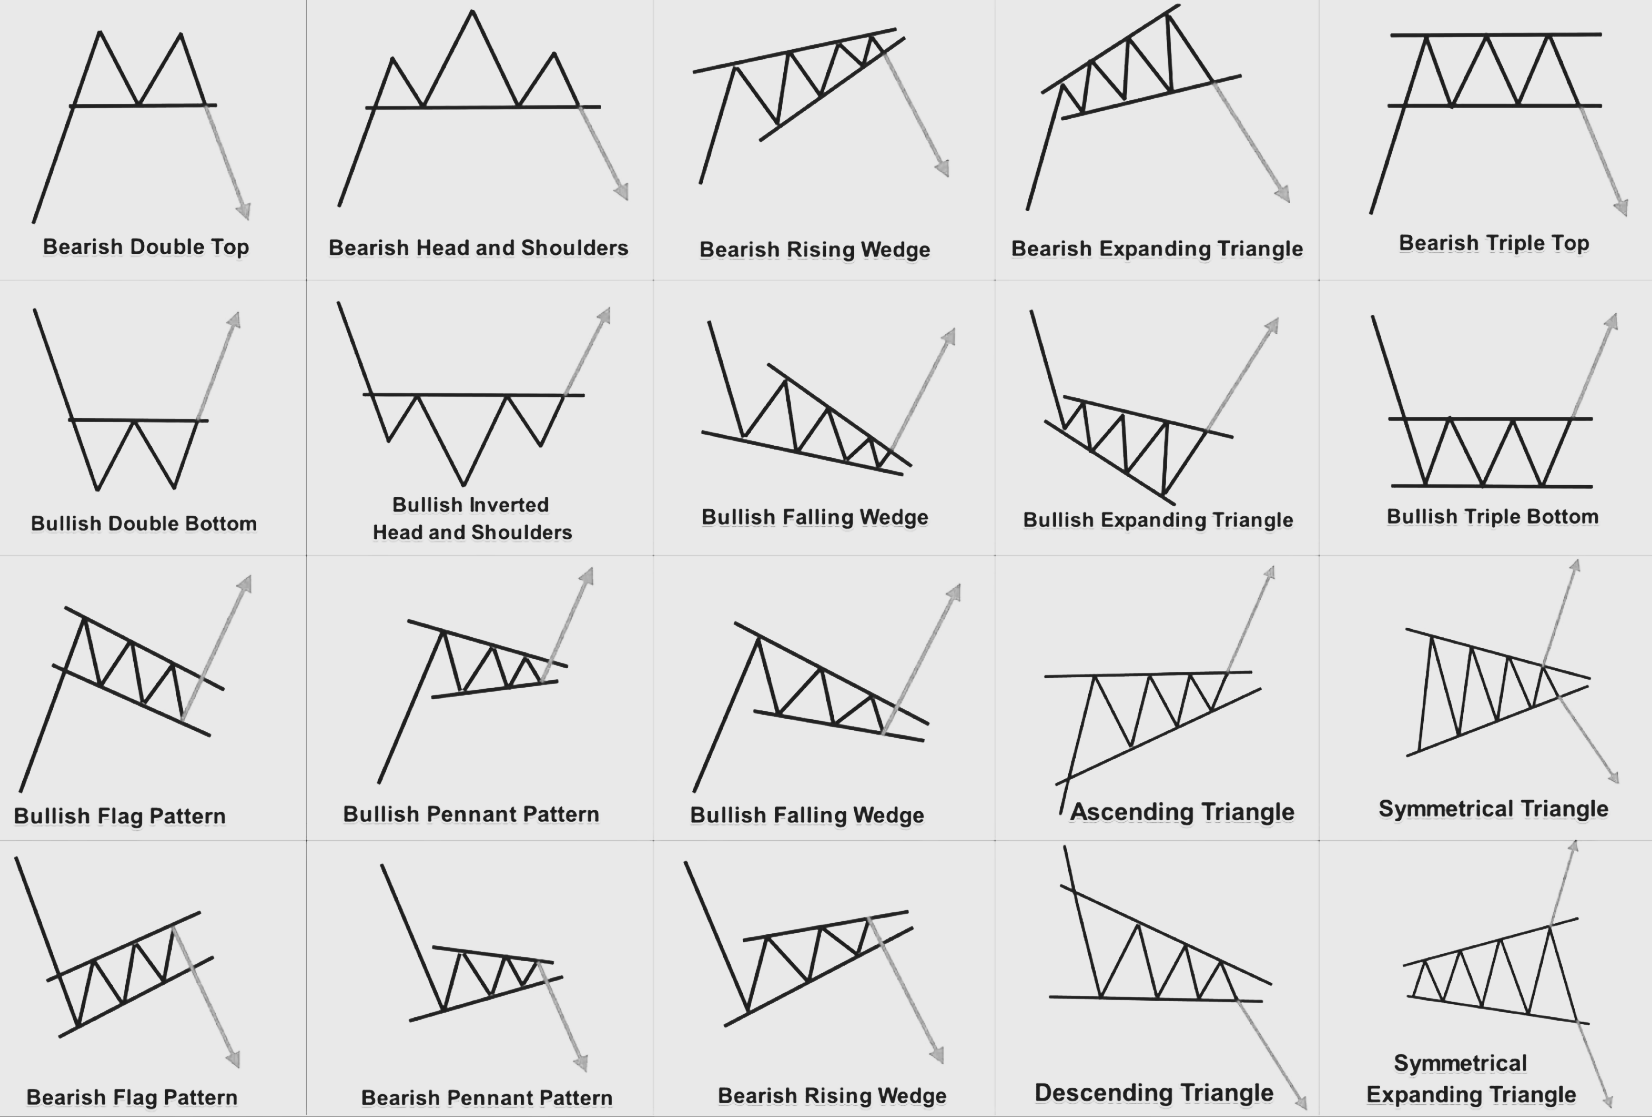
You can identify a potential breakout setup by scanning charts for common consolidation patterns like triangles, ranges (rectangles), flags, and pennants. These patterns visually represent a market in balance, coiling up energy for its next move. Once a pattern is identified, you draw the key support and resistance lines that contain the price action. The trade opportunity arises when the price finally breaks out of this containment, signaling that either buyers or sellers have gained control.
A breakout strategy is favored by many traders because it capitalizes on shifts in market sentiment and aims to capture explosive price movements. It moves away from trying to predict tops and bottoms and instead focuses on reacting to confirmed changes in market structure. The following sections will provide a detailed guide on the principles of this strategy, how to identify the best setups, and the specific rules for executing and managing your trades from start to finish.
What Is a Breakout Strategy in Forex?
A breakout strategy in forex is a trading approach where a trader enters a position after a currency pair’s price moves decisively outside a defined support or resistance level, often with increased volume. This strategy is built on the idea that these key levels represent a temporary balance between buyers and sellers, and a “breakout” signals that one side has overpowered the other, likely leading to a sustained move in that direction.
Let’s explore the core principles behind this popular strategy and how it differs from other common approaches. The main goal is to enter a trade right as the price starts to gain momentum, capturing a significant portion of the resulting trend.
What Are the Core Principles of Breakout Trading?
The underlying logic of breakout trading rests on the natural cycle of financial markets, which tend to move between periods of consolidation and periods of expansion or trending. A breakout strategy is designed to capitalize on the transition from consolidation to expansion.
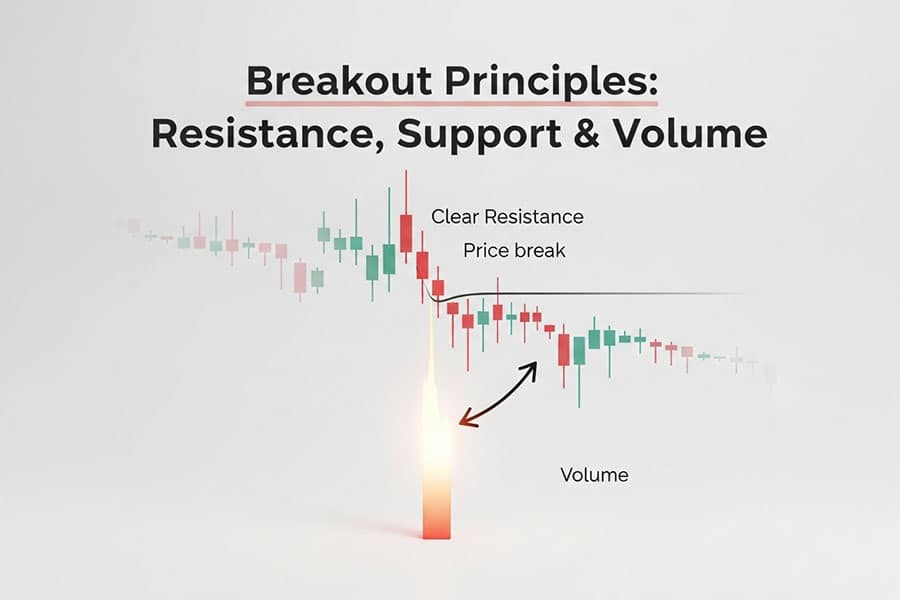
Specifically, the core principles are:
1. Consolidation Precedes Expansion: Markets do not trend forever. They often pause, with price trading within a relatively tight range. This period of consolidation, also known as a ranging market, is where buying and selling pressures are roughly equal. This balance causes the price to bounce between a definable support “floor” and a resistance “ceiling.” Breakout traders see this consolidation not as a time to sit out, but as a setup for the next big move. Energy is being built up, much like a spring being compressed.
2. Breakouts Signal a Shift in Sentiment: A breakout is the moment that equilibrium is broken. When the price pushes cleanly through a resistance level, it signals that buyers have overwhelmed sellers. Conversely, a break below a support level indicates that sellers have taken control. This event often acts as a clear signal that a new trend is beginning or an existing trend is resuming after a pause.
3. Confirmation Validates the Move: Not every price movement that pierces a level is a true breakout. A core principle is to seek confirmation. This typically comes in the form of increased trading volume and a notable expansion in volatility. A surge in volume shows that there is strong participation and conviction behind the move, making it more likely to be sustained. A breakout on weak volume is often a warning sign of a potential “fakeout,” where the price quickly reverses back into the range.
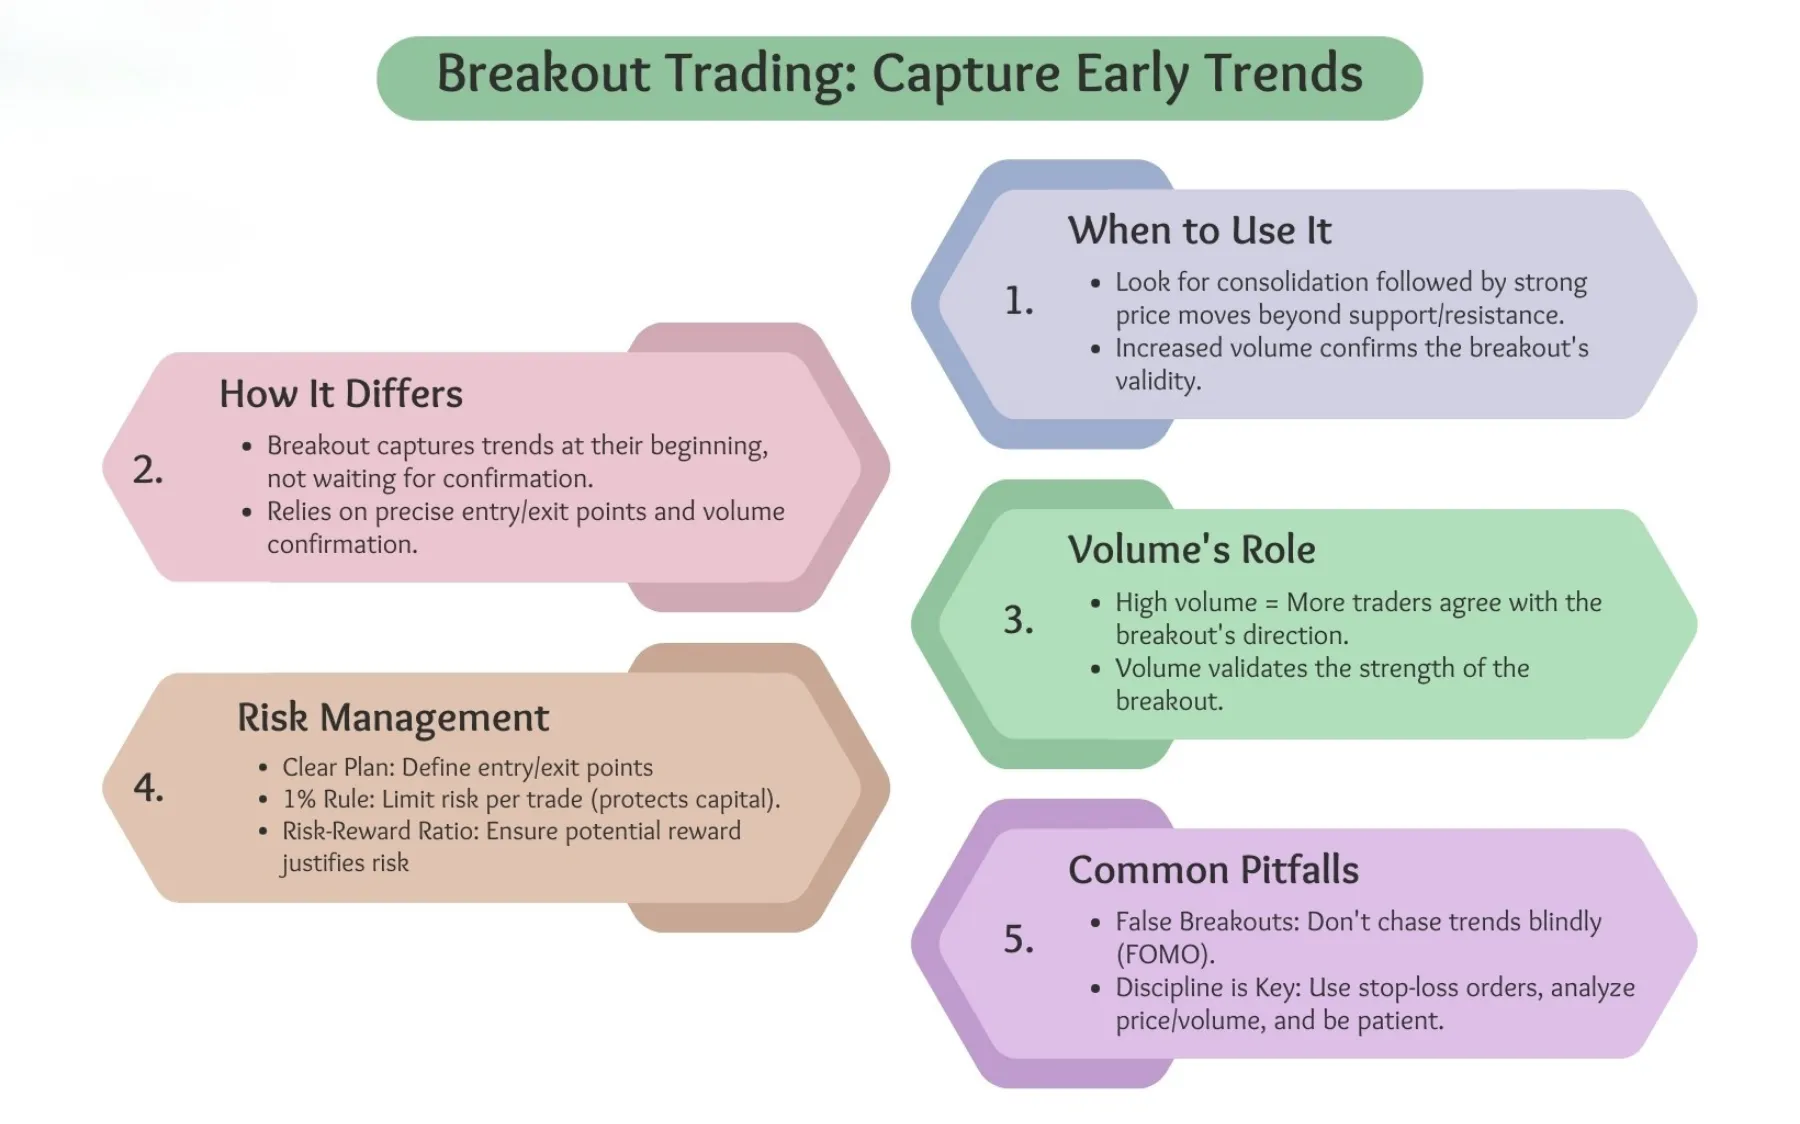
How Is a Breakout Different from a Trend-Following Strategy?
While both breakout and trend-following strategies aim to profit from market trends, they differ fundamentally in their timing and entry points. The primary distinction is that a breakout strategy aims to catch the very beginning of a new move, while a trend-following strategy joins a trend that is already established and confirmed.

Think of it this way: a breakout trader is trying to be one of the first participants in a new trend. The entry occurs at the exact moment the price breaks out of a consolidation phase. This approach has the potential for a very favorable entry price, but it also carries a higher risk of being caught in a false breakout because the new trend is not yet confirmed.
In contrast, a trend-following trader is more conservative. They wait for the price to not only break out but also establish a clear pattern of higher highs and higher lows (for an uptrend) or lower lows and lower highs (for a downtrend). They might enter on a pullback or a dip within the now-established trend. Their entry price is typically worse than a breakout trader’s, but their trade has a higher probability of success because the trend’s existence has already been validated by subsequent price action. A breakout is the event that can start a trend, while a trend-follower trades the state of the established trend.
What Are the Key Components of a Forex Breakout?
The key components of a forex breakout are well-defined support and resistance levels, a period of price consolidation, and a confirmation through a surge in volume and volatility. These three elements work together to create a high-probability trading setup. A breakout is not just a random price spike; it is a structural event on the chart that signals a potential shift in market direction.
To understand this better, let’s break down each component. Identifying these characteristics helps you distinguish between a genuine trading opportunity and market noise that could lead to a losing trade.
How Are Support and Resistance Levels Identified?
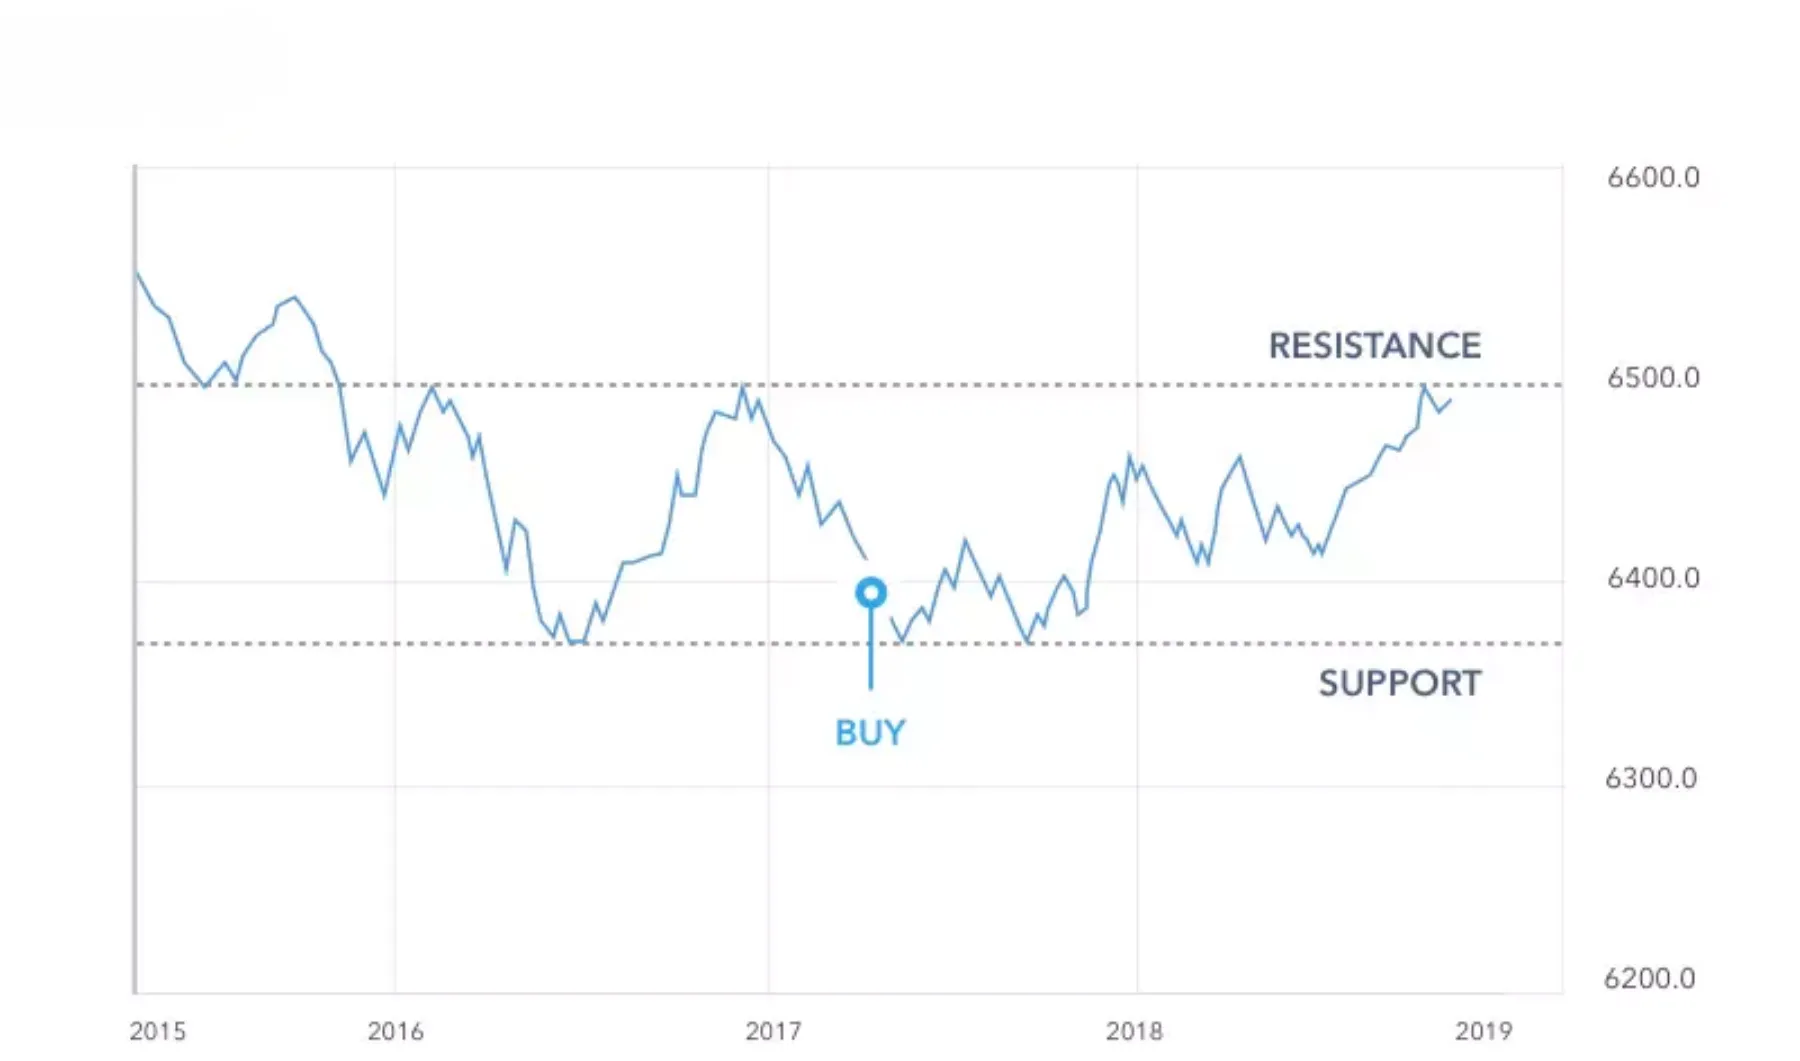
Support and resistance levels are the foundation of breakout trading. They are specific price points on a chart where the price has historically struggled to move past.
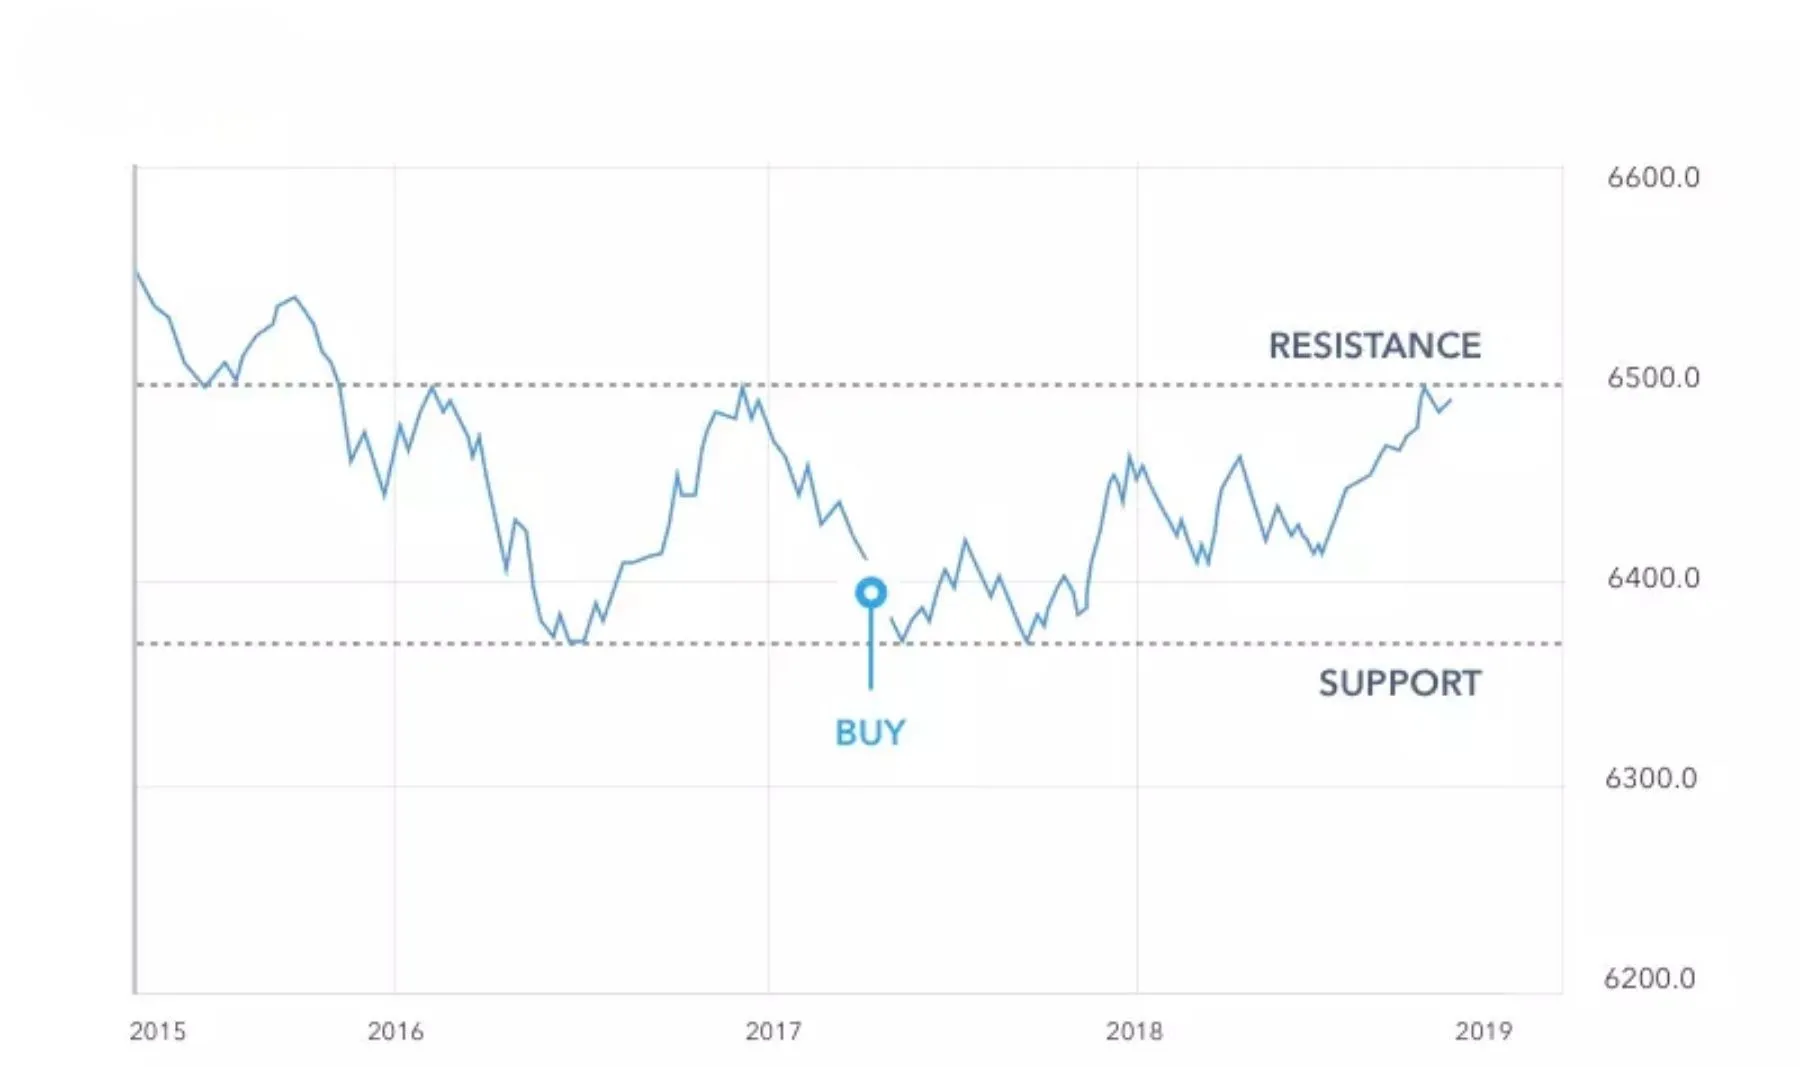
- Horizontal Support and Resistance: These are the most common and easiest to identify. A resistance level is a price ceiling where selling pressure has previously been strong enough to overcome buying pressure and turn the price back down. You can find it by connecting at least two previous swing highs with a horizontal line. A support level is a price floor where buying pressure has been strong enough to overcome selling pressure and push the price back up. It is found by connecting two or more previous swing lows with a horizontal line. The more times a level has been tested and held, the stronger it is.
- Trendlines: Price doesn’t always move horizontally. In a trending market, support and resistance can be dynamic. An uptrend line is drawn by connecting a series of higher lows, acting as a diagonal support line. A downtrend line is drawn by connecting a series of lower highs, acting as a diagonal resistance line. A breakout of a trendline can signal a potential reversal or acceleration of the trend.
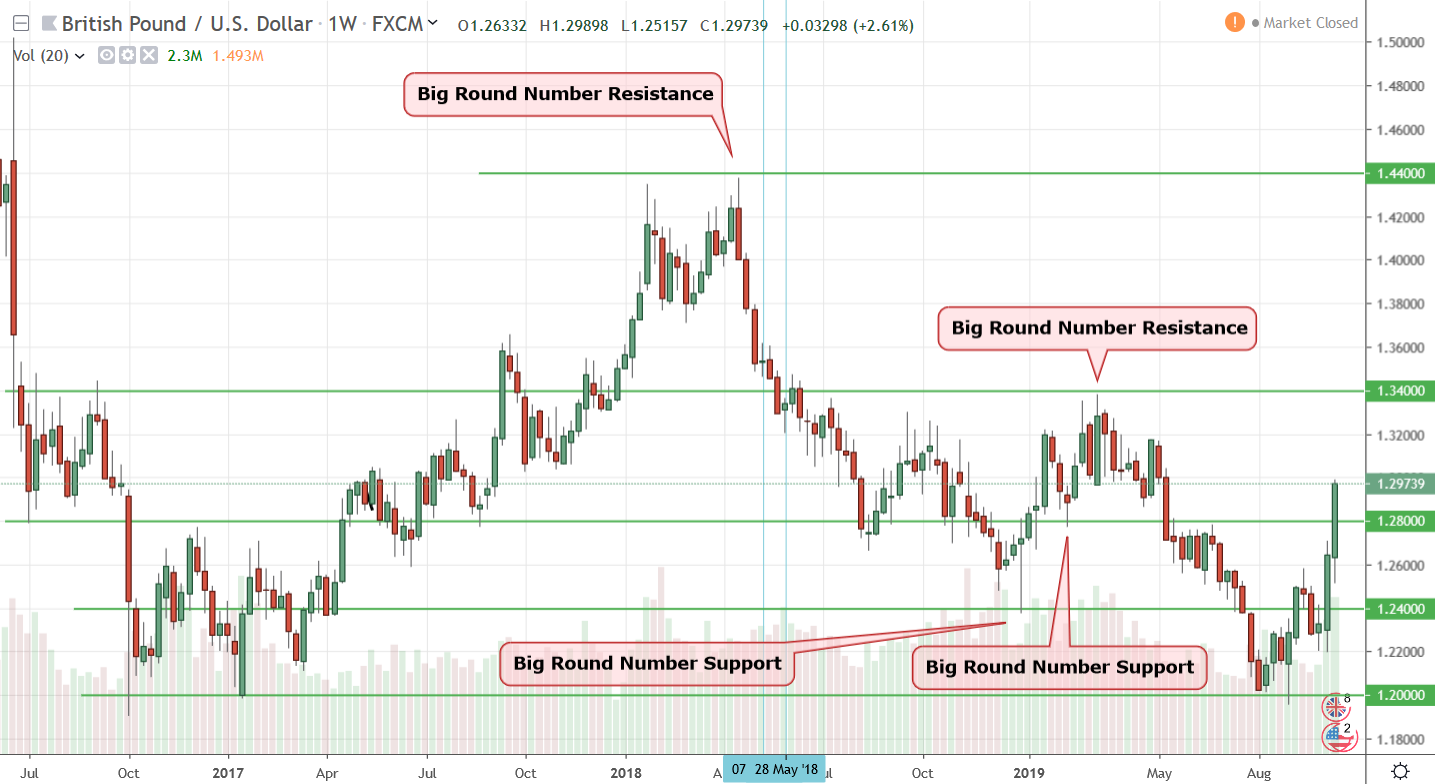
- Psychological Levels: These are levels that are not necessarily based on previous price action but are significant due to human psychology. Round numbers, such as 1.10000 on EUR/USD or 130.00 on USD/JPY, often act as invisible barriers. Traders tend to place orders around these clean numbers, creating natural support and resistance zones.
What Is the Role of Volume and Volatility in a Breakout?
Volume and volatility are the confirmation tools that give life to a breakout. A price moving through a key level without their support is often a weak signal and prone to failure.
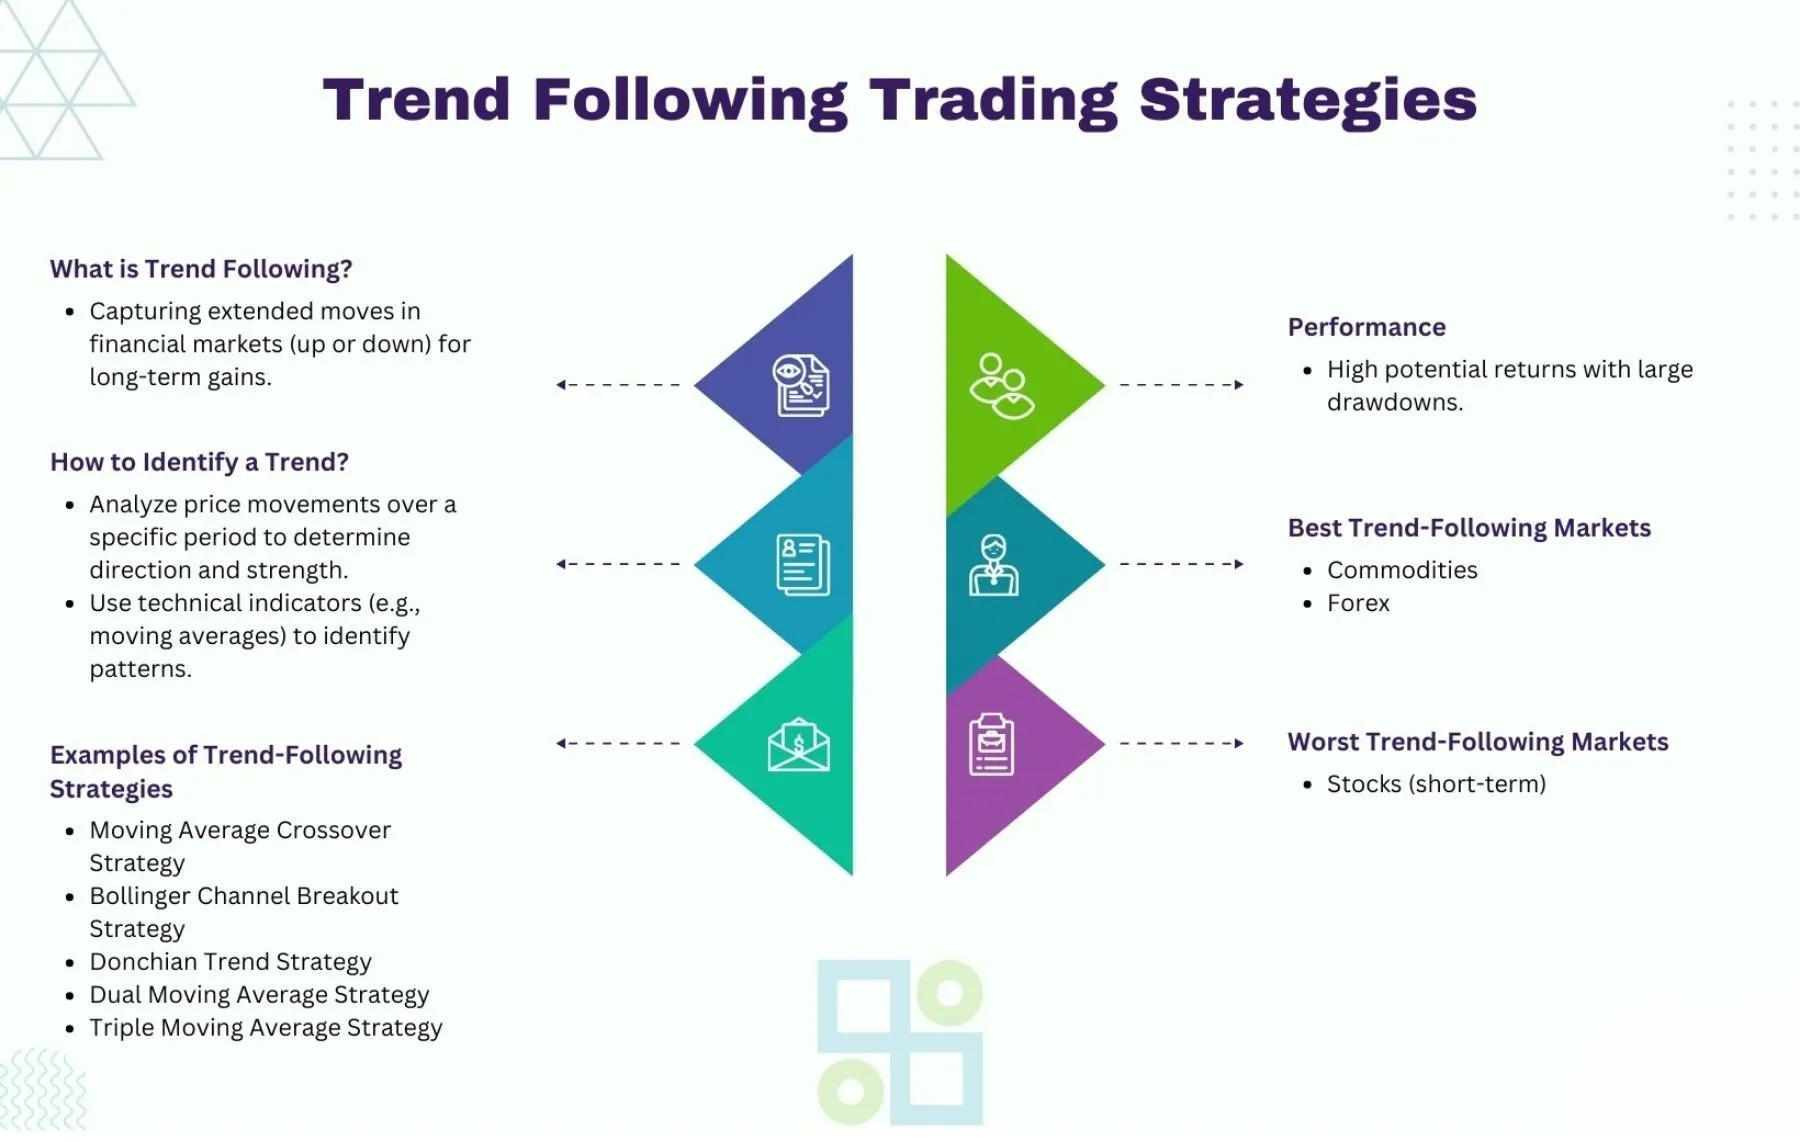
First, let’s talk about volume. In forex, true volume is not always available, so traders often use “tick volume,” which measures the number of price changes in a given period. While not perfect, it serves as a good proxy. A consolidation period is usually marked by low and declining volume, indicating trader indecision. A valid breakout should be accompanied by a significant spike in volume. This surge shows that a large number of market participants, including institutional players, are entering the market with conviction, providing the fuel needed to sustain the move. A breakout on low volume should be viewed with extreme caution.
Next, we have volatility. Volatility measures the magnitude of price fluctuations. During a consolidation phase, volatility tends to shrink as the price trades within a tight range. A breakout is, by its very nature, an expansion of volatility. The price suddenly starts moving much faster and further than it did during the consolidation. You can measure this using an indicator like the Average True Range (ATR). The ATR calculates the average trading range over a specific period. During consolidation, the ATR value will be low and flat. When a true breakout occurs, you will often see a sharp spike in the ATR, confirming the increase in market volatility and the strength of the breakout.
How Do You Identify a Potential Breakout Setup?
You identify a potential breakout setup by first spotting a consolidation phase using common chart patterns, then confirming the strength of the boundary levels, and finally watching for confirmation signals like a candle close and volume spike. This systematic process helps filter out weak signals and focuses your attention on high-probability opportunities where the market is coiling for a big move.
Here’s the breakdown of how to find these high-probability opportunities on your charts. It involves training your eyes to see specific patterns that indicate a market is taking a break before its next major directional leg.
What Are Common Chart Patterns that Signal a Breakout?
Chart patterns are visual representations of the battle between buyers and sellers. Certain patterns are exceptionally good at signaling an upcoming breakout because they show a clear period of price compression or consolidation.
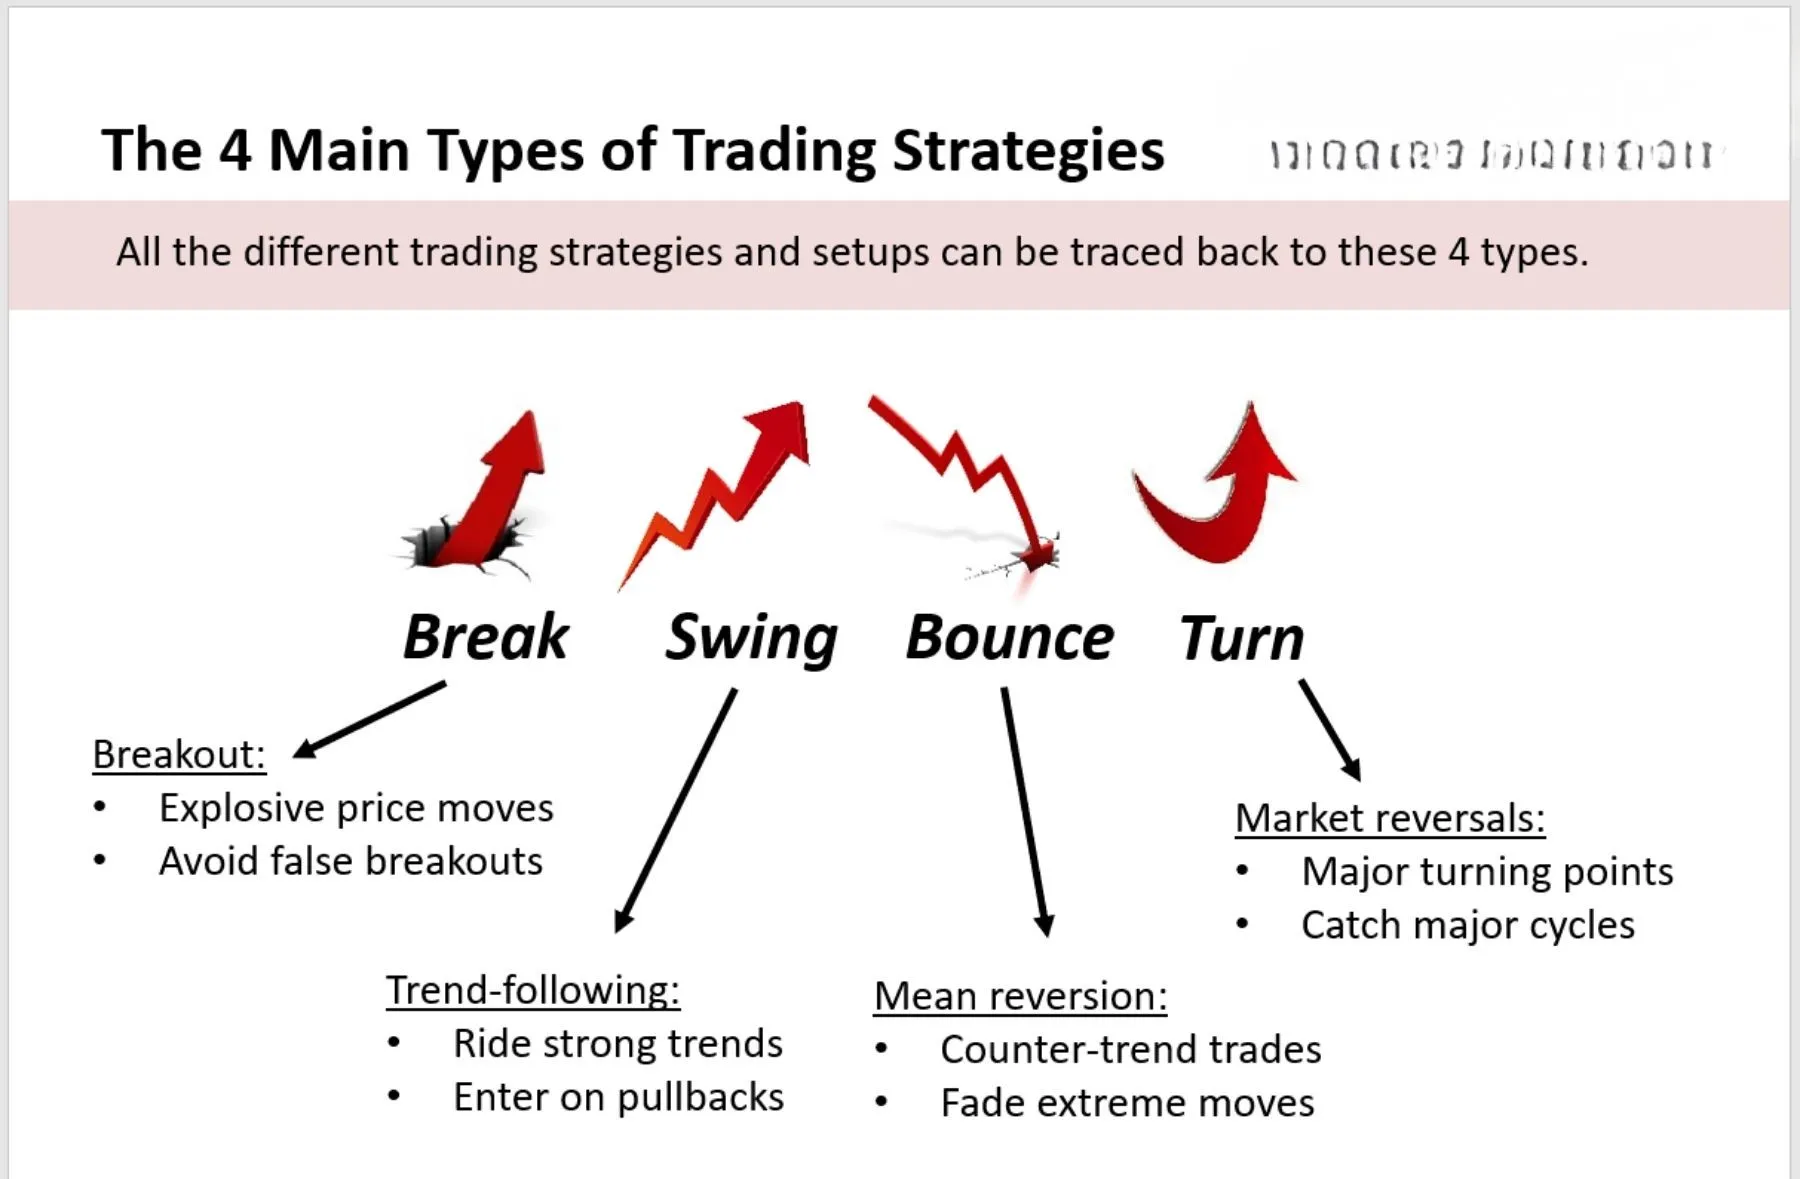
1. Ranges or Rectangles: This is the simplest breakout pattern. The price moves sideways between a clear horizontal support level and a horizontal resistance level. It looks like a box or a rectangle on the chart. The longer the price stays within this range, the more significant the eventual breakout tends to be. Traders watch for the price to break either above the resistance or below the support to initiate a trade.
2. Triangles: These patterns show price action converging into a tighter and tighter area. There are three main types:
* Symmetrical Triangle: Formed by a descending resistance line and an ascending support line. It represents market indecision, and the breakout can occur in either direction.
* Ascending Triangle: Formed by a flat horizontal resistance line and an ascending support line. This is generally a bullish pattern, as it shows buyers are becoming more aggressive, pushing the price up against a fixed supply level. A breakout above the resistance is expected.
* Descending Triangle: Formed by a flat horizontal support line and a descending resistance line. This is typically a bearish pattern, showing that sellers are pushing the price down against a fixed demand level. A breakdown below the support is anticipated.
3. Flags and Pennants: These are short-term continuation patterns that form after a strong, sharp price move known as the “pole.” A flag is a small rectangular consolidation that slopes against the direction of the initial move. A pennant is a small symmetrical triangle that forms after the pole. Both patterns indicate a brief pause before the trend is expected to continue in its original direction.
How Can You Confirm a Valid Breakout?
Spotting a pattern is only the first step. The next, and arguably more important step, is confirming that the breakout is real and not a “fakeout” designed to trap eager traders.
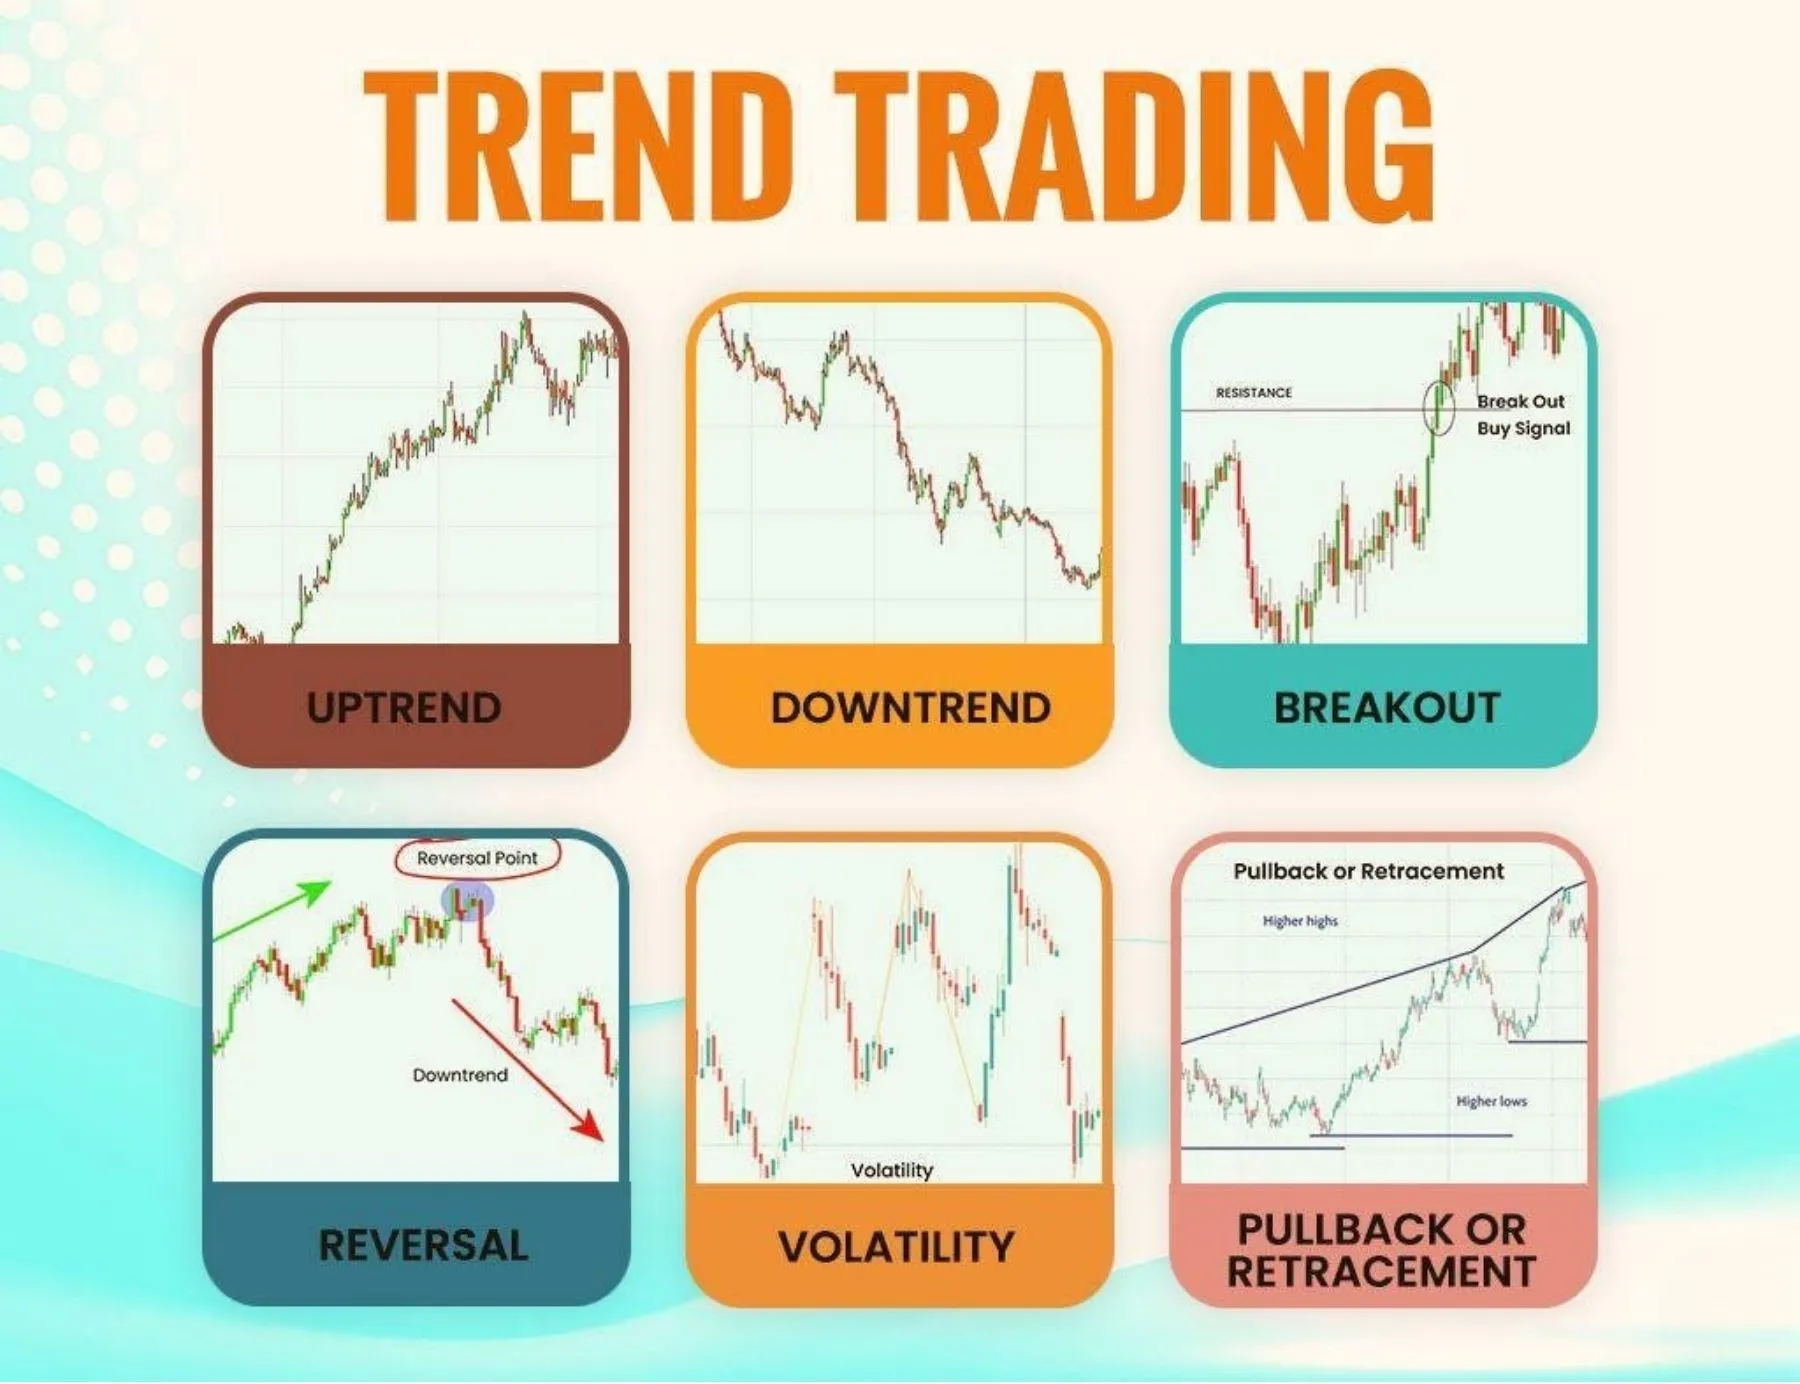
The most common confirmation method is the candle close. Instead of jumping into a trade the moment the price pierces a level, patient traders wait for the current price candle to close. For a bullish breakout, you would wait for a candle (for example, on a 4-hour chart) to close decisively above the resistance level. For a bearish breakout, you’d wait for a candle to close below the support level. This simple filter helps you avoid situations where the price pokes through a level momentarily (creating a long wick) only to snap back inside the range by the end of the period.
Another critical confirmation is, as mentioned earlier, volume. A true breakout should be accompanied by a noticeable increase in trading volume. On your trading platform, look at the volume indicator at the bottom of your chart. On the breakout candle, you should see a volume bar that is visibly taller than the preceding bars. This shows strong participation and confirms the market’s commitment to the new direction. A breakout without a volume spike is weak and has a higher chance of failing.
How Do You Execute and Manage a Forex Breakout Trade?
You execute a breakout trade by placing an entry order as price breaches a key level or on its retest, and you manage it by setting a firm stop-loss on the other side of the structure and a take-profit target based on the previous range’s size. A successful breakout strategy depends just as much on disciplined execution and risk management as it does on identifying the right setup.
Let’s explore the practical steps for entry and risk management. Having clear, non-negotiable rules for where to get in, where to get out if you’re wrong, and where to take profits if you’re right is what separates professional traders from amateurs.
Where Should You Place Your Entry Order?
There are two primary methods for entering a breakout trade, each with its own pros and cons. The method you choose will depend on your risk tolerance and the specific market conditions.
1. The Aggressive Entry (Breakout Entry): This method involves entering the trade the moment the price breaks through the support or resistance level. For a bullish breakout, you would place a buy order as soon as the price moves a few pips above the resistance line. This is an aggressive approach because you are getting in at the earliest possible moment. The main advantage is that if the breakout is powerful and moves quickly, you will be on board for the entire move. The disadvantage is a higher risk of being caught in a false breakout, or “fakeout,” where the price quickly reverses. This entry style is often best used when accompanied by a very strong surge in volume right at the moment of the break.
2. The Conservative Entry (Retest Entry): This method requires more patience. After the price breaks out of the consolidation pattern, you wait for it to pull back and “retest” the level it just broke. For a bullish breakout, the old resistance level should now act as new support. You would place your buy order when the price comes back down, touches this new support level, and shows signs of bouncing off it. The main advantage is that it provides a secondary confirmation that the breakout is valid, leading to a higher probability trade. It also often offers a better risk-to-reward ratio, as your entry is further from your target and closer to your stop-loss. The downside is that in very strong breakouts, the price may not retest the level, and you could miss the trade entirely.
How Do You Set a Stop-Loss and Take-Profit?
Proper risk management is essential. Your stop-loss and take-profit levels should be determined before you enter the trade.
Stop-Loss Placement: Your stop-loss is your exit plan if the trade goes against you. Its placement should be logical and based on the market structure. For a breakout trade, the stop-loss should be placed on the other side of the consolidation pattern.
- For a bullish breakout (price breaks above resistance), your stop-loss should be placed just below the broken resistance level, or even better, below the most recent swing low within the previous consolidation range.
- For a bearish breakout (price breaks below support), your stop-loss should be placed just above the broken support level, or above the most recent swing high inside the range.
Placing your stop-loss here means that if the price returns deep inside the previous range, your trade idea is invalidated, and it is time to exit with a small, managed loss.
Take-Profit Placement: Your take-profit is your target for exiting a winning trade. A common and effective method is the measured move.
1. Measure the height of the consolidation pattern. For a range, this is the distance in pips between the support and resistance levels. For a triangle, it is the height of the widest part of the pattern.
2. Project that same distance from the breakout point in the direction of the trade. This gives you a logical price target based on the energy built up during the consolidation.
Another method is to identify the next significant support or resistance level on the chart and set your take-profit just before that level. Finally, always be mindful of your risk-to-reward ratio. A good rule of thumb is to only take trades that offer a potential reward that is at least twice the potential risk (a 1:2 risk-to-reward ratio or better).
What Are the Advanced Concepts and Risks of Breakout Trading?
Advanced breakout trading involves identifying false signals, using confirming indicators, and applying specialized risk management techniques for high-volatility conditions. Furthermore, traders can explore different types of breakouts and alternative entry methods to refine their approach and improve their probability of success.
How Can You Avoid Trading a False Breakout (Fakeout)?
A false breakout, often called a “fakeout,” occurs when the price temporarily moves beyond a support or resistance level but fails to continue in that direction, quickly reversing back into its previous range. These events are designed to trap traders who enter on the initial move. To avoid these traps, you need to look for confirmation that the breakout has genuine momentum behind it. One of the most effective methods is to analyze the breakout candlestick itself. A strong breakout is typically characterized by a long, full-bodied candle that closes far away from the broken level. In contrast, a candle with a small body and a long wick indicates indecision and a higher probability of a reversal. Another powerful technique is to monitor trading volume. A legitimate breakout is almost always accompanied by a significant spike in volume, showing strong participation from buyers or sellers. If a price breaks a level on low or declining volume, it is a major warning sign that the move lacks conviction and may soon fail.

To practically apply these concepts, traders should use a confirmation checklist before entering a trade.
- Candlestick Confirmation: Did the breakout candle close decisively beyond the level, or did it show a long wick suggesting rejection?
- Volume Confirmation: Was there a noticeable increase in volume during the breakout candle compared to the preceding candles?
- Follow-Through: Does the next candle continue in the direction of the breakout, or does it immediately reverse course? Waiting for one or two subsequent candles to confirm the direction can help filter out many false signals.
What Are the Best Indicators for a Breakout Strategy?
While pure price action is central to breakout trading, several technical indicators can provide valuable confirmation and context. The best indicators help measure momentum and volatility, which are the two key ingredients for a successful breakout. Bollinger Bands are an excellent tool for identifying periods of consolidation that often precede a breakout. When the bands contract and move closer together, it is known as a “squeeze,” signaling low volatility. A price move that closes outside of the squeezed bands can indicate the start of a new, powerful trend. Another essential indicator is the Relative Strength Index (RSI), a momentum oscillator. For a bullish breakout, a rising RSI that crosses above 50 and heads toward 70 adds confirmation. Conversely, a bearish breakout is stronger if the RSI falls below 50 toward 30. If the price breaks out but the RSI is flat or moving in the opposite direction (a divergence), the breakout is less likely to succeed.

In addition to volatility and momentum indicators, volume-based tools offer direct insight into market conviction.
- On-Balance Volume (OBV): This indicator uses volume flow to predict price changes. A rising OBV during a bullish breakout confirms that volume is flowing into the asset, supporting the upward move.
- Volume Profile: This advanced charting tool shows the amount of trading activity at different price levels. A breakout from a high-volume area (a point of control) is often more reliable than a breakout from a low-volume zone.
- Standard Volume Bars: Simply observing the volume bars at the bottom of the chart can be very effective. A breakout candle that is accompanied by a volume bar significantly taller than the recent average provides strong confirmation of institutional participation.
What Is the Difference Between a Volatility Breakout and a Trendline Breakout?
Although both strategies involve trading a price break, volatility breakouts and trendline breakouts are based on different market structures and signals. A volatility breakout is triggered when price moves out of a period of low volatility and price consolidation. This consolidation often forms a horizontal range, with clear support and resistance levels. Traders identify these periods using indicators like Bollinger Bands or by noticing a tight, sideways price action. The trade idea is that a period of quiet price action will eventually resolve with a sharp, directional move. The direction is not predicted beforehand; the trader simply prepares to trade in whichever direction the price breaks out. This strategy works well in markets that alternate between ranging and trending conditions. A classic example is using the opening range of a trading session, where a trader enters when the price breaks above the high or below the low of that initial period.
A trendline breakout, on the other hand, is directly related to an existing trend. It occurs when the price breaks through a diagonal line that has been acting as support or resistance. In an uptrend, a trendline is drawn connecting the series of higher lows. A break below this trendline signals that the uptrend may be over and a reversal or correction is beginning. In a downtrend, the trendline connects lower highs, and a break above it suggests the downtrend is losing steam. Unlike a volatility breakout, a trendline breakout provides a clear directional bias from the start. A break of an uptrend line implies a short trade, while a break of a downtrend line implies a long trade. This approach is more about identifying trend reversals or continuations rather than just an expansion of volatility.
How Does Risk Management Differ in Breakout Trading?
Risk management in breakout trading requires special attention because these setups often occur in high-volatility environments, introducing unique challenges. One of the primary risks is slippage. During a rapid breakout, especially one driven by a major news release, the price you get can be different from the price you expected. A market order might be filled several pips away from the breakout level, immediately putting your trade at a disadvantage. This also affects stop-loss orders, which can be triggered at a worse price than intended. Another key difference is the placement of the initial stop-loss. Because breakouts can be volatile, a tight stop-loss is easily triggered by random noise or a minor pullback before the real move begins. Consequently, traders often need to use a wider stop-loss, placing it on the other side of the consolidation range or using a volatility-based measure like the Average True Range (ATR). A wider stop, however, increases the potential monetary loss if the trade fails.
To manage these risks, position sizing becomes absolutely critical. Instead of trading a fixed number of lots, your position size must be calculated based on your stop-loss distance and your predefined risk per trade (e.g., 1% of your account balance).
- Volatility-Based Position Sizing: If volatility is high, your stop-loss will need to be wider. To maintain your 1% risk rule, you must trade a smaller position size.
- Fixed Dollar Risk: Determine the maximum dollar amount you are willing to lose on a single trade. Divide this amount by the stop-loss distance in pips to find the correct position size.
- Avoid News-Driven Breakouts: Unless you are an experienced trader, it is often wise to avoid trading breakouts that occur directly during major economic announcements, as the risk of extreme slippage and volatility is at its highest.
What Is the Breakout Pullback Strategy?
The breakout pullback is a more conservative and often more reliable variation of the standard breakout strategy. Instead of entering the trade as soon as the price breaks a key level, a trader using this method waits for the price to return and retest the level it just broke. This retest, known as a pullback or throwback, provides a second chance to enter the trade with more confirmation. The core principle is that a broken resistance level often becomes new support, and a broken support level becomes new resistance. By waiting for the price to pull back to this level and show signs of holding, you can filter out many false breakouts. A successful retest confirms that market sentiment has shifted and that other participants now view the old level as a new floor or ceiling.
The primary advantage of this strategy is a better risk-to-reward ratio. When you enter on a pullback, your entry point is closer to the newly established support or resistance level. This allows you to place a tighter stop-loss just on the other side of the level, reducing your potential loss if the trade fails. At the same time, the profit target remains the same, which improves the overall trade structure. However, the main disadvantage is that you might miss out on some trades entirely. Strong, momentum-driven breakouts sometimes do not pull back at all and continue moving in the breakout direction without offering a second entry opportunity. This trade-off between higher certainty and the risk of missing a move is something every trader must weigh based on their own trading style and risk tolerance.