

Blog
What is a Range Trading Strategy and How is it Used in Forex?

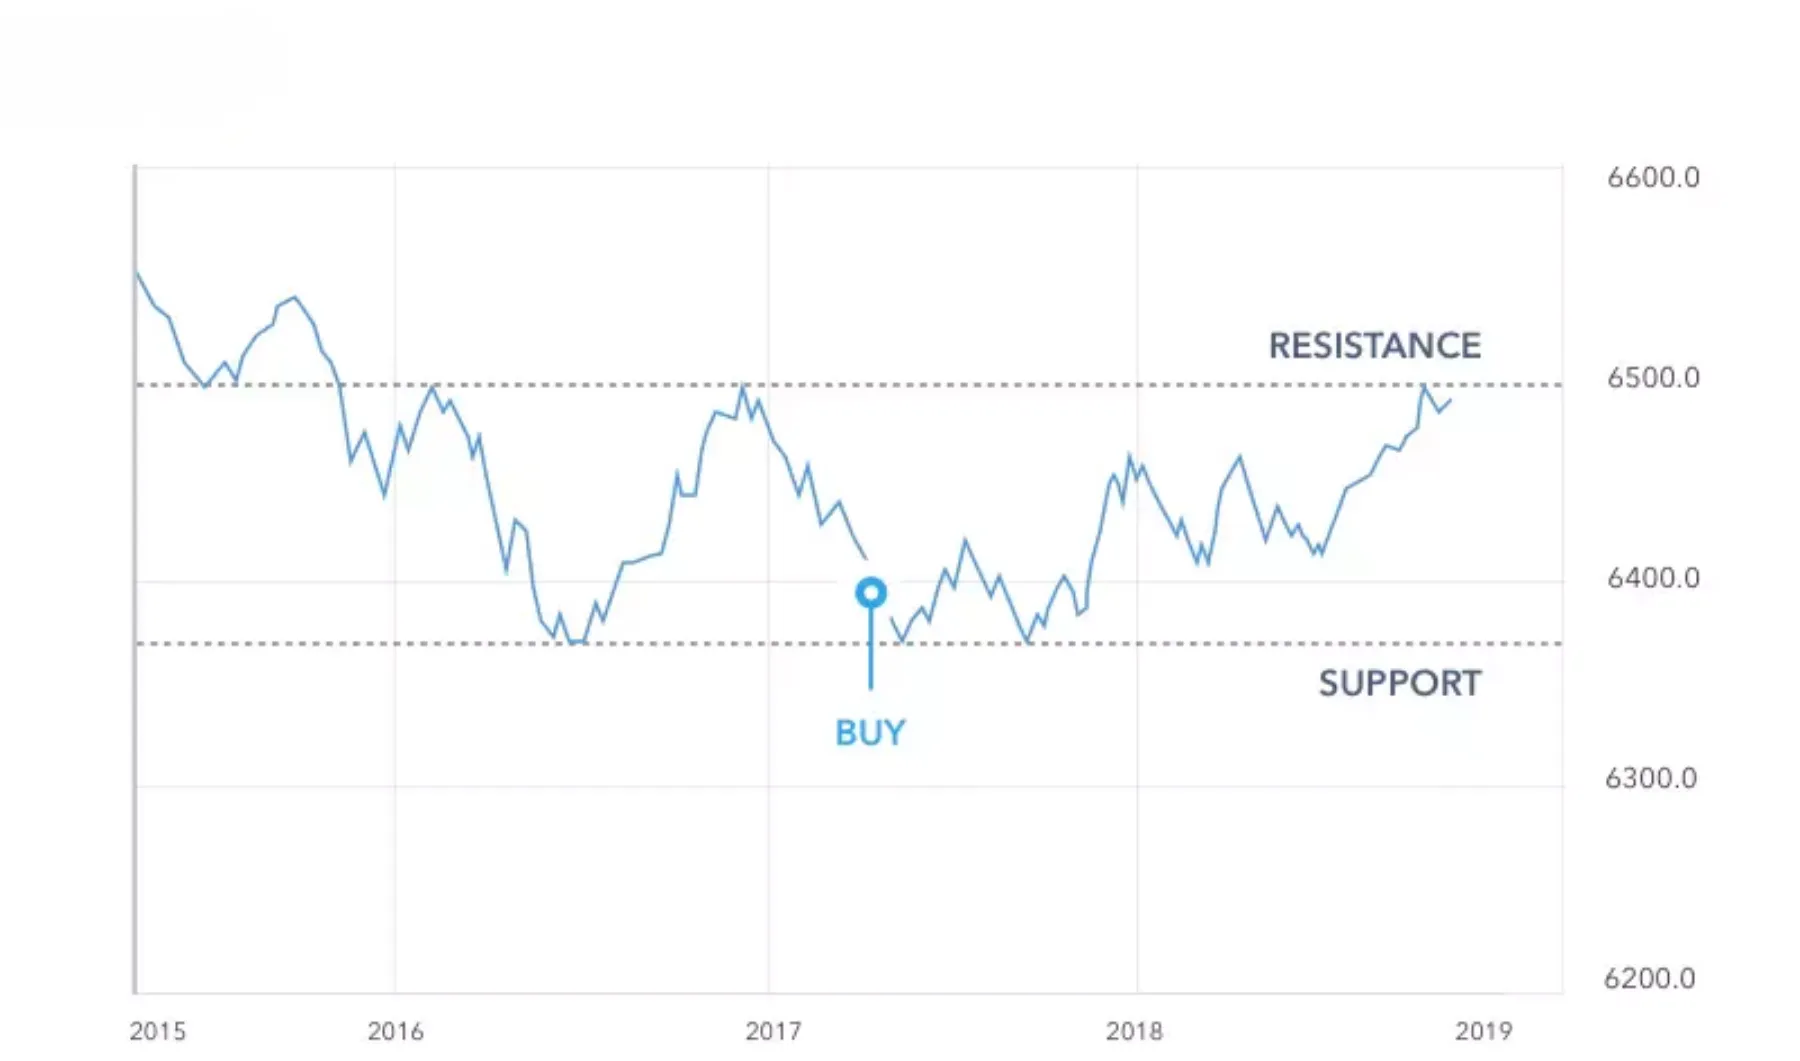
A range trading strategy is a method used by traders to profit from a currency pair’s price movements within a predictable, horizontal channel. The fundamental approach involves identifying clear levels of support (a price floor) and resistance (a price ceiling) and then systematically buying near support and selling near resistance. This strategy works best in markets that are not trending in a specific direction but are instead oscillating between two distinct price points. Traders aim to capture these smaller, repetitive price swings until the range is broken.
In forex, this strategy is used when a currency pair, like the EUR/USD or GBP/JPY, enters a period of consolidation. Forex traders apply the range trading strategy by drawing horizontal lines on their charts to mark the upper and lower boundaries of the price action, then executing trades when the price reaches these key levels. The liquidity and 24-hour nature of the forex market often create periods where prices move sideways, providing frequent opportunities for range traders to enter and exit positions.
A ranging market is primarily identified by its structure of support and resistance. These levels represent price points where buying or selling pressure is strong enough to consistently reverse the price direction, creating the top and bottom of the trading channel. Support is the level where falling prices tend to stop and reverse upwards, while resistance is where rising prices often stall and turn back down. The more times the price tests these levels without breaking through, the more established the range becomes.
Unlike trend-following strategies that seek to capitalize on long, directional moves, range trading focuses on predictability and repetition within a contained environment. It offers clear, predefined entry points, exit points, and areas to place stop-loss orders, making it a structured approach to trading. We will now explore how to identify these markets, execute trades, and use technical indicators to improve your success.
What is a Sideways or Ranging Market in Forex?
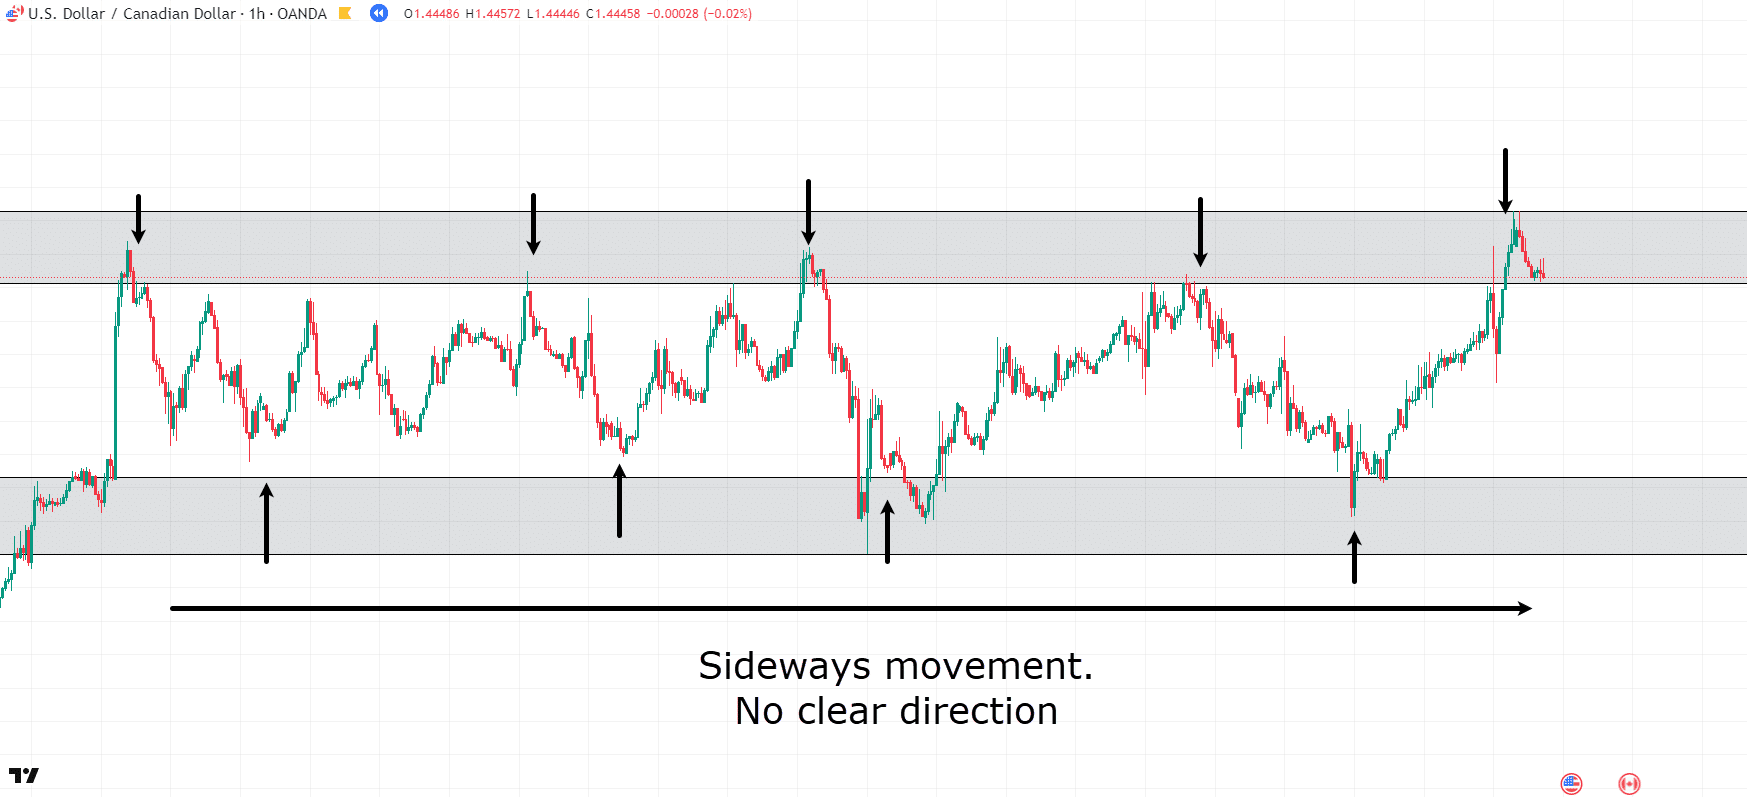
A sideways or ranging market in forex is a condition where a currency pair’s price moves horizontally between two clear price levels, known as support and resistance. Instead of making progressively higher highs and higher lows (an uptrend) or lower lows and lower highs (a downtrend), the price essentially bounces back and forth within a defined channel. This type of market is also called a “consolidating” or “choppy” market, indicating a temporary equilibrium between buyers and sellers where neither side has enough strength to push the price into a new trend. You can think of it like a tennis ball being hit back and forth over a net; it stays within the confines of the court without breaking out in one direction. This price action is very common in the forex market, especially during periods of low volatility or when traders are waiting for significant economic news. For traders who can correctly identify these boundaries, a ranging market offers a series of predictable trading opportunities with well-defined risk and reward potential.
How are Support and Resistance Levels Identified?
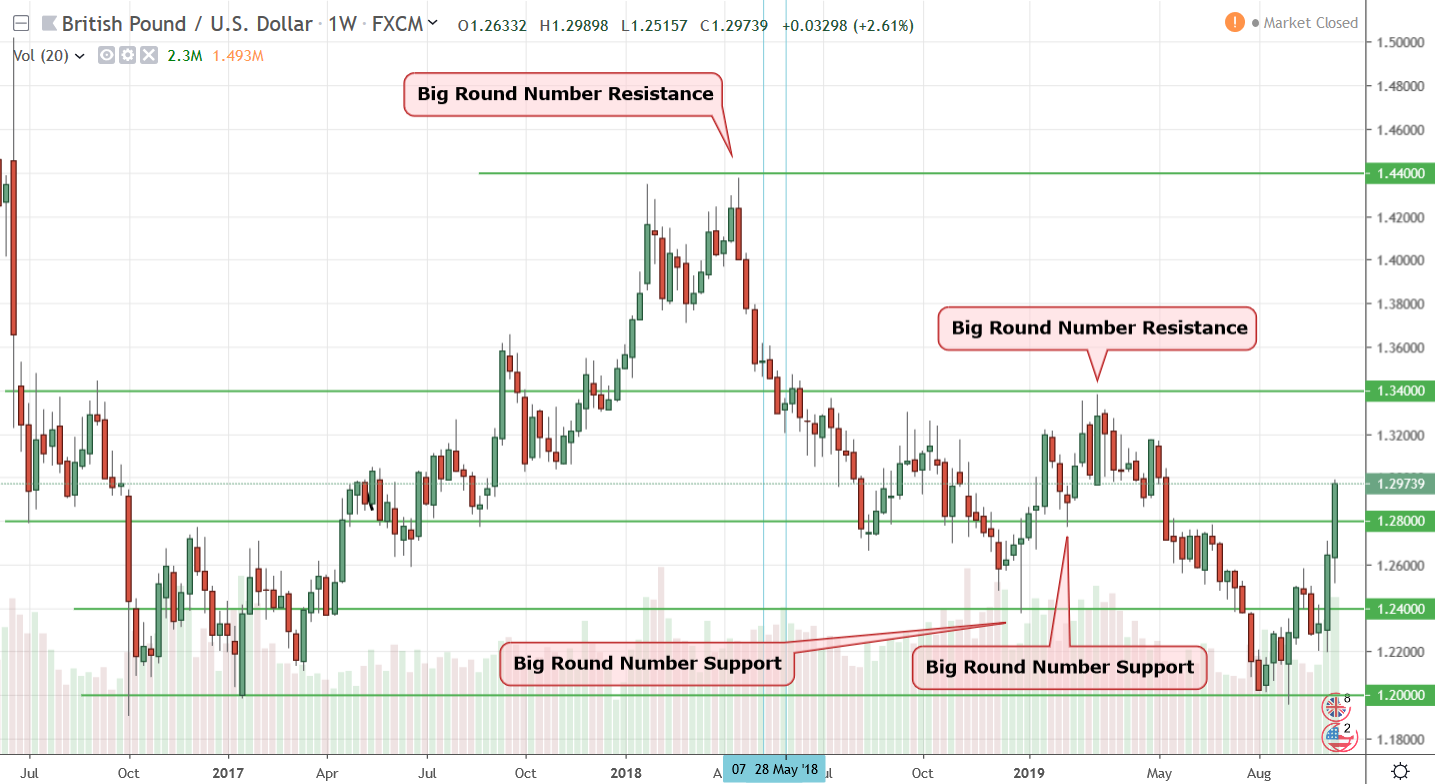
Identifying support and resistance levels is the foundational skill for any range trader. These levels are not arbitrary lines but are visual representations of supply and demand zones on a price chart. The most practical and common method for identifying them is by connecting previous highs and lows with horizontal lines.
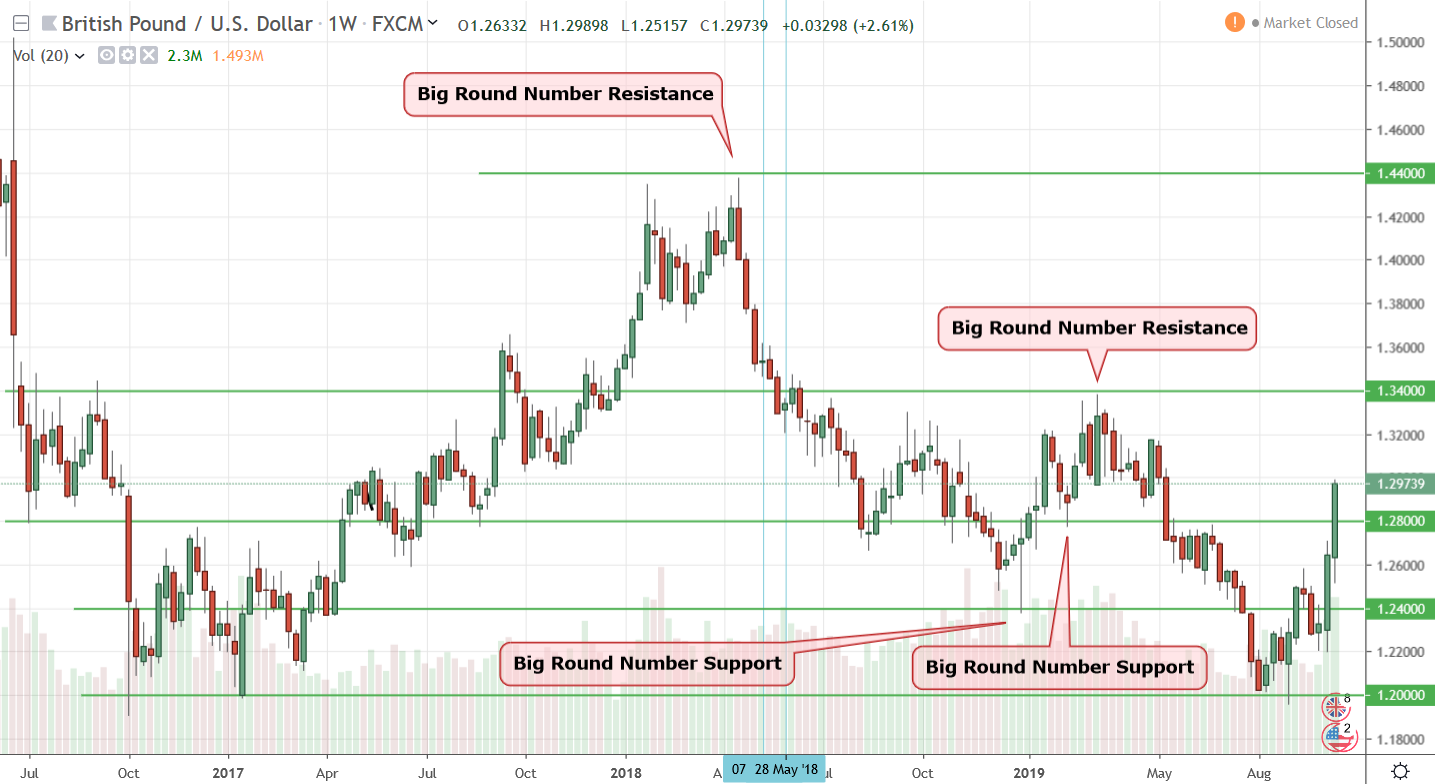
To identify a support level, you would look at a price chart and find at least two distinct low points that the price reached but failed to break below. By drawing a horizontal line connecting these lows, you establish a potential “floor.” When the price approaches this line in the future, traders anticipate that buying pressure will increase, causing the price to bounce upwards again. For example, if the EUR/USD currency pair repeatedly drops to 1.0750 but then reverses course, 1.0750 is considered a strong support level. The more times the price touches and rebounds from this level, the more reliable it is perceived to be.
Conversely, to identify a resistance level, you connect at least two significant high points that the price failed to break above. This horizontal line acts as a “ceiling.” As the price nears this level, selling pressure is expected to build, pushing the price back down. For instance, if the GBP/JPY pair rallies to 190.50 on multiple occasions but is rejected each time, 190.50 becomes a key resistance level. Traders will watch this area closely for opportunities to enter short (sell) positions, anticipating another price reversal. It is a visual battlefield where sellers consistently overpower buyers, preventing further upward movement.
What Differentiates a Ranging Market from a Trending Market?
The primary difference between a ranging market and a trending market lies in the direction and structure of price movements. A ranging market lacks a clear directional bias, while a trending market moves decisively up or down.
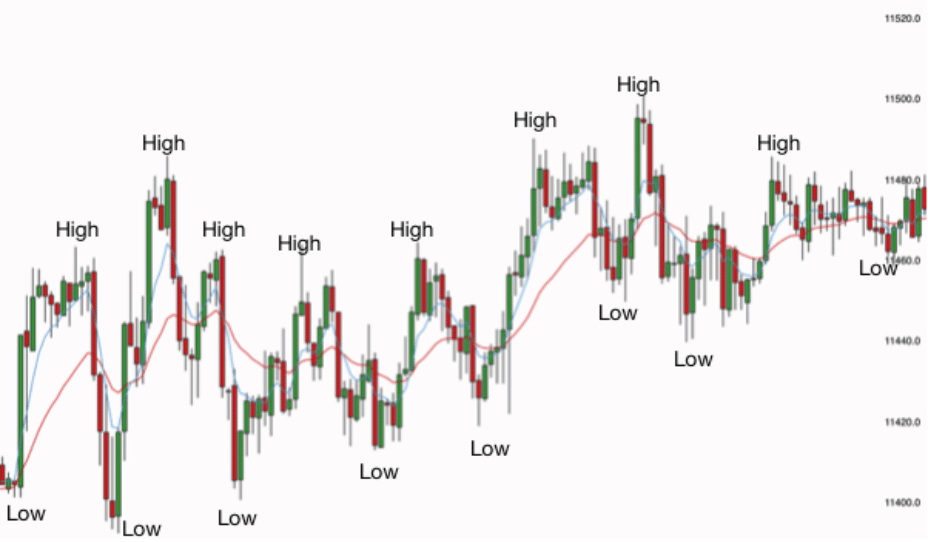
A ranging market is characterized by horizontal price action. You’ll notice that the peaks (highs) and troughs (lows) of the price waves occur at roughly the same levels. The price appears trapped between two horizontal boundaries, support and resistance, moving back and forth without making any real progress in either direction. Think of a car stuck in traffic, moving a little forward and a little backward but ultimately staying in the same lane. This indicates a state of balance in the market, where neither the bulls (buyers) nor the bears (sellers) are in control.
In sharp contrast, a trending market shows clear directional momentum. There are two types of trends:
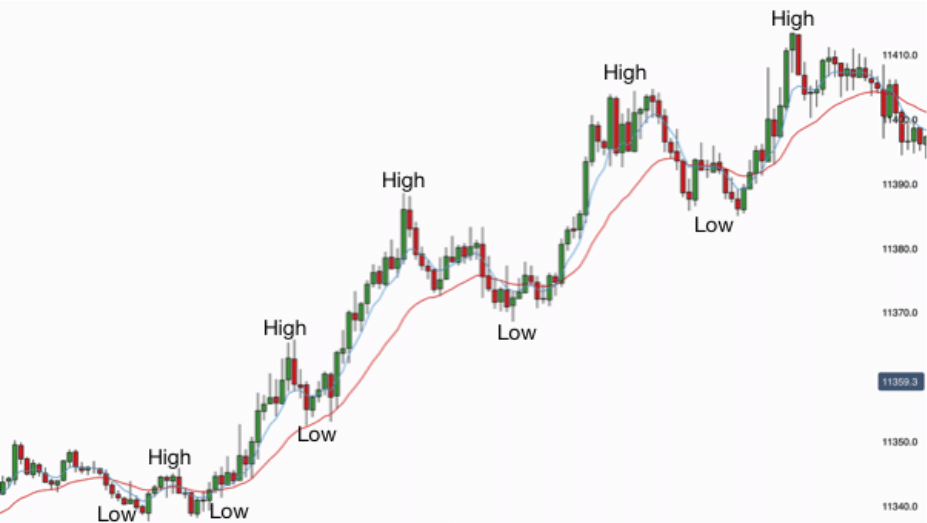
- Uptrend: In an uptrend, the market makes a series of higher highs and higher lows. Each peak is higher than the previous one, and each trough is also higher than the one before it. This structure signifies that buyers are in control, consistently pushing the price to new heights. The visual is similar to climbing a staircase, where each step up is followed by a small rest before the next step up.
- Downtrend: A downtrend is the exact opposite, defined by a series of lower lows and lower highs. Each trough is lower than the previous one, and each peak is also lower. This pattern indicates that sellers are dominating the market, driving the price down. It looks like walking down a flight of stairs.
Recognizing whether a market is ranging or trending is essential because each condition requires a completely different trading strategy. Attempting to use a range trading strategy in a strong trend will likely lead to losses, just as using a trend-following strategy in a sideways market will result in frustration.
What is the Core Principle of a Range Trading Strategy?
The core principle is to systematically buy a currency pair at a support level and sell it at a resistance level to profit from the price oscillations within a defined range. This strategy is built on the assumption that these support and resistance boundaries will hold and cause the price to reverse, allowing traders to capitalize on the predictable “bounce” effect. Unlike trend trading, which aims to capture large, directional moves, range trading focuses on generating smaller, more frequent profits from the repetitive price action inside a horizontal channel. The entire approach is about identifying a period of market equilibrium and trading the predictable swings that occur within it. Success depends on the trader’s ability to accurately define the range and manage risk in case the price eventually breaks out of it.
Let’s break down this principle. The strategy is fundamentally about exploiting the psychology of the market at key price levels. When the price of a currency pair drops to a well-established support level, it reaches a point where many market participants believe it has become “cheap” or undervalued. This belief attracts buyers who step in, creating demand that overwhelms the selling pressure and pushes the price back up. A range trader anticipates this reaction and enters a long (buy) position near the support line, betting on the price rebounding towards the top of the range. The entry is not just a blind guess; it is a calculated decision based on historical price behavior at that specific level.
On the other side of the channel is the resistance level. When the price rallies up to this “ceiling,” it reaches a point where traders perceive it as “expensive” or overvalued. This perception encourages sellers to enter the market and existing holders to take profits. The resulting supply overtakes demand, causing the price to fall. A range trader foresees this reversal and enters a short (sell) position near the resistance line. The expectation is that the price will be rejected at this level and travel back down toward the support line at the bottom of the range. This process can repeat multiple times, offering several trading opportunities as long as the range remains intact.
The goal is not to predict the next major market trend but to profit from the predictable, contained volatility within the identified channel. Profit targets are therefore set conservatively within the range’s boundaries. For a long trade initiated at support, the take-profit order is placed just below the resistance level. This ensures the profit is locked in before the price hits the heavy selling pressure at the ceiling. Similarly, for a short trade from resistance, the take-profit is placed just above the support level to secure gains before buyers step in again. This disciplined approach to setting profit targets is a hallmark of range trading. It acknowledges that the strategy is about capturing the “meat” of the move inside the range, not chasing the last pip of profit before a potential reversal.
How Do You Execute a Forex Range Trade?
Executing a forex range trade involves identifying a range, waiting for the price to test a boundary, entering a trade with a confirmation signal, and setting precise stop-loss and take-profit orders. This systematic process ensures that trades are not based on emotion but on a clear set of rules designed to capitalize on the price behavior within a sideways market. The execution is methodical, beginning with patient observation and culminating in disciplined trade management. Each step is designed to maximize the probability of success while strictly controlling potential losses. Successful execution hinges on precision at every stage, from pinpointing the entry to defining the exit strategy before the trade is even placed. Let’s explore the practical steps for putting this strategy into action.
Where are the Entry Points in a Range Trading Strategy?
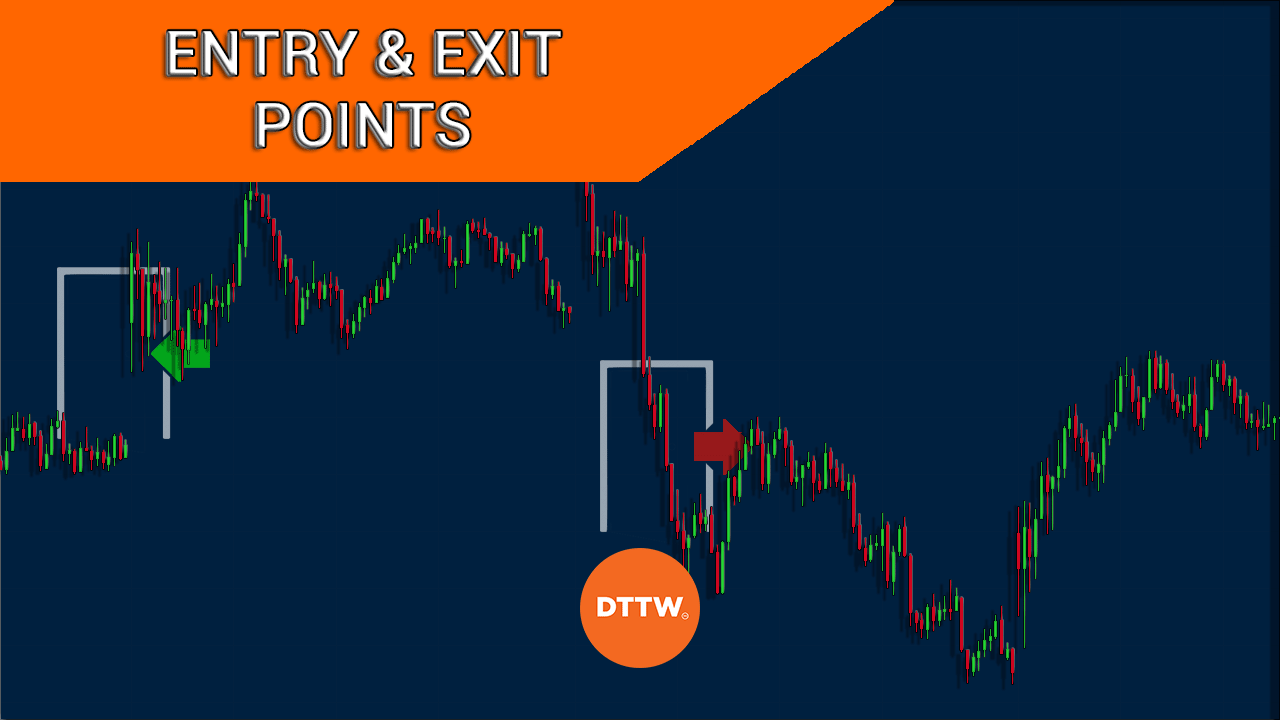
Entry points in a range trading strategy are located at the boundaries of the range: the support and resistance levels. However, a professional trader rarely enters a trade the exact moment the price touches one of these lines. Instead, they wait for confirmation that the level is likely to hold and that a price reversal is underway. This patience helps avoid “false signals” where the price briefly touches a level before breaking through it.

For a long (buy) position, the entry point is near the support level. After identifying a strong support line where the price has bounced before, a trader will watch for the price to return to this area. Once the price tests the support, the trader looks for a confirmation signal. This could be a bullish candlestick pattern, such as a hammer, a doji, or a bullish engulfing pattern. These patterns indicate that buying pressure is starting to overcome selling pressure. Alternatively, a trader might use an oscillator like the Relative Strength Index (RSI). If the RSI shows an “oversold” reading (typically below 30) as the price hits support, it strengthens the case for a buy entry. The trade is placed only after this confirmation appears, providing greater confidence that the support will hold.
For a short (sell) position, the entry point is near the resistance level. The process is a mirror image of a long entry. The trader waits for the price to rally up to the established resistance “ceiling.” As the price tests this level, the search for confirmation begins. Bearish candlestick patterns like a shooting star, a hanging man, or a bearish engulfing pattern serve as powerful signals that sellers are taking control. These patterns suggest that the upward momentum is fading and a reversal is imminent. Similarly, an overbought reading on an oscillator (like an RSI above 70) provides additional confirmation. Once a reliable confirmation signal materializes at resistance, the trader executes the short trade, anticipating a move back down to the support level.
How are Stop-Loss and Take-Profit Orders Placed?
Proper placement of stop-loss and take-profit orders is arguably the most important element of successful range trading, as it defines your risk and reward before you even enter the market. These orders automate your exit strategy, removing emotion from the decision-making process.
A stop-loss order is your safety net. It is designed to limit your potential loss if the market moves against you and breaks out of the range.
- For a long (buy) trade entered at support, the stop-loss should be placed just below the support level. The exact distance will depend on the currency pair’s volatility and the trader’s risk tolerance, but a common practice is to set it a few pips below the lowest wick of the candle that tested the support. This placement gives the trade some breathing room but ensures you are taken out of the position quickly if the support level fails.
- For a short (sell) trade entered at resistance, the stop-loss is placed just above the resistance level. It should be set a few pips above the highest wick of the candle that tested the resistance. If the price breaks out upwards, this order will automatically close your trade, preventing a large loss.
A take-profit order is used to lock in gains once the price reaches its expected target. The goal is to exit the trade before the price reverses at the opposite end of the range.
- For a long (buy) trade, the take-profit should be set just below the resistance level. You don’t want to target the exact resistance line because the price may reverse before touching it perfectly. Setting the target slightly below the ceiling increases the probability of your order being filled.
- For a short (sell) trade, the take-profit is placed just above the support level. This allows you to capture the majority of the downward move while exiting before the expected buying pressure at support kicks in.
By setting both orders immediately after entering a trade, you establish a clear risk-to-reward ratio and can manage the trade passively.
What Technical Indicators are Best for Range Trading?
The best technical indicators for range trading are oscillators like the Relative Strength Index (RSI) and momentum indicators like Bollinger Bands, which help confirm overbought and oversold conditions within a range. These tools are particularly effective in non-trending markets because they are designed to measure momentum and identify potential reversal points. Unlike trend-following indicators like Moving Averages, which can give false signals in a sideways market, oscillators excel at highlighting the ebb and flow of price action between support and resistance. They provide traders with an extra layer of confirmation, helping to distinguish high-probability entry points from potential traps. Using these indicators correctly can significantly improve the timing and accuracy of your range trades.
Let’s explore how these tools work in practice. The key is to use them not as standalone signal generators but as complementary tools to confirm what the price action at support and resistance is already suggesting. For instance, if the price is testing a major resistance level, an overbought signal from an oscillator adds significant weight to the decision to enter a short trade. It tells you that not only is the price at a historical selling point, but the recent upward momentum is also likely exhausted. This confluence of signals is what professional traders look for. By combining pure price action analysis (support and resistance) with the mathematical precision of technical indicators, you can build a more robust and reliable range trading strategy.
How is the Relative Strength Index (RSI) Used?
The Relative Strength Index, or RSI, is a momentum oscillator that is exceptionally useful in range-bound markets. It measures the speed and change of price movements on a scale of 0 to 100, helping traders identify overbought and oversold conditions. It is not meant to be used in isolation but as a powerful confirmation tool to validate trading signals at support and resistance levels.
The RSI is primarily used to spot two key conditions:
- Oversold (<30): When the RSI line drops below the 30 level, it suggests that the asset has been sold heavily and its downward momentum may be running out. In a ranging market, this is a powerful confirmation signal for a long (buy) trade. For example, if the USD/CAD price drops to a previously established support level and, at the same time, the RSI indicator dips below 30, it provides a strong confluence of signals. The price is at a historical buying zone, and the momentum indicator agrees that a bounce is likely. A trader would wait for the RSI to start turning up from the oversold territory before entering the trade.
- Overbought (>70): Conversely, when the RSI line rises above the 70 level, it indicates that the asset may be overbought and due for a price correction. This signal is used to confirm short (sell) entries at resistance. Imagine the price of AUD/USD rallies up to a known resistance ceiling. If the RSI is simultaneously pushing above 70, it signals that the buying frenzy is likely overextended. This tells the trader that the probability of a reversal is high, making it an opportune moment to look for a short entry.
Using the RSI in this manner helps filter out weaker signals and increases the probability of entering trades that align with the underlying market momentum.
How are Bollinger Bands Used to Identify a Range?
Bollinger Bands are another excellent tool for range traders, serving two primary functions: identifying a ranging market and acting as dynamic levels of support and resistance. The indicator consists of three lines: a middle band, which is a simple moving average (SMA), and an upper and lower band, which are set two standard deviations away from the middle band.
First, Bollinger Bands help traders identify when a market is entering a range. This is signaled by the bands contracting or narrowing, a phenomenon known as a “squeeze.” When the bands move closer together, it indicates that volatility is decreasing and the price is consolidating. This is often a precursor to a ranging period, telling traders to switch from a trend-following mindset to a range-bound one. A squeeze visually shows that the market is coiling up, making it a perfect time to start drawing support and resistance lines and preparing for range trading opportunities.
Second, the upper and lower bands themselves can act as dynamic support and resistance. In a well-established range, the price will often oscillate between these two bands.
- The lower band can be interpreted as a dynamic support level. When the price touches or moves slightly below the lower band, it is often seen as being oversold relative to its recent average, signaling a potential buying opportunity.
- The upper band can act as dynamic resistance. When the price touches or pushes above the upper band, it is considered overbought, presenting a potential selling opportunity.
For example, a trader might look for a buy signal when the price hits the lower Bollinger Band and also aligns with a horizontal support level. This combination provides a strong, dual confirmation that the price is likely to reverse and head back towards the middle band or even the upper band. Using Bollinger Bands adds a layer of dynamic analysis to the static support and resistance lines on the chart.
What are Advanced Considerations and Risks in Range Trading?
Advanced considerations involve identifying different range types, understanding the psychology behind breakouts, and managing risks like false breaks and low volatility. Furthermore, a successful trader must grasp the fundamental differences between range trading and other strategies to apply it in the right market context. This means recognizing its limitations and avoiding common pitfalls that can undermine its effectiveness.
What is the Difference Between Range Trading and Breakout Trading?
Range trading and breakout trading are two opposing strategies that are applied to the same market structure: a consolidation phase. The core difference lies in their objective. A range trader aims to profit from price movements within a defined channel, buying at the support level and selling at the resistance level. They operate on the assumption that these boundaries will hold and the price will continue to reverse. This approach is best suited for markets with low volatility and no clear directional bias.
In contrast, a breakout trader seeks to profit when the price moves outside of that established channel. They anticipate that the break of either the support or resistance level signals the start of a new trend. A breakout trader would place a buy order just above resistance or a sell order just below support, betting on continued momentum in the direction of the break. Their success depends on high volatility and strong follow-through after the price clears the range. Essentially, a range trader’s stop-loss often becomes a breakout trader’s entry point, highlighting their conflicting market views.
What are the Most Common Mistakes in Range Trading?
Many traders are drawn to the apparent simplicity of range trading, but several common mistakes can quickly lead to losses. Recognizing these pitfalls is the first step toward building a more robust and disciplined strategy.

- Trading in a range that is too narrow. When the distance between support and resistance is small, the potential profit on a trade may not justify the risk. After accounting for the spread and placing a reasonable stop-loss, the risk-to-reward ratio becomes unfavorable, and transaction costs can easily erase any small gains.
- Ignoring a potential breakout. A trader can become complacent, expecting the range to hold indefinitely. They may fail to notice warning signs, such as price repeatedly testing one boundary or a surge in volume, which often precede a breakout. Failing to exit a position when a breakout is imminent can turn a small, manageable loss into a substantial one.
- Setting stop-losses too close to the boundaries. Placing a stop-loss order just beyond the support or resistance level is a frequent error. This makes the trade vulnerable to minor price spikes or “wicks” that are not true breakouts. The price can trigger the stop-loss and then immediately reverse back into the range, resulting in an unnecessary loss.
Are There Different Types of Trading Ranges?
While the concept of a range seems straightforward, price action can form different types of channels. Identifying the specific type of range helps a trader adapt their strategy for more precise entries and exits.
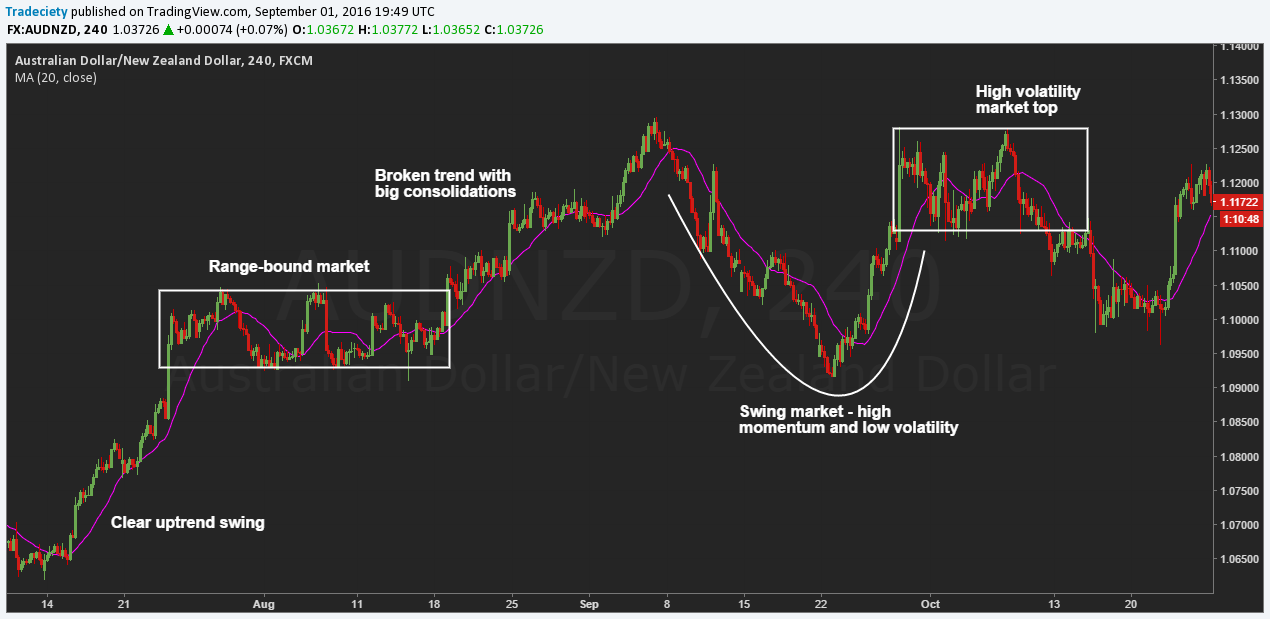
The most common and easily identifiable type is the rectangular range, also known as a horizontal channel. This pattern is defined by two parallel and horizontal lines of support and resistance. The price oscillates between these two levels, creating a clear sideways market. This type of range signifies a strong period of consolidation and market indecision, where neither buyers nor sellers can gain control. It is often the easiest pattern for new range traders to practice on due to its well-defined boundaries.
Another important variation is the diagonal range, or a price channel. In this case, the support and resistance lines are still parallel, but they are sloped. An ascending channel has an upward slope, with price making a series of higher highs and higher lows. A descending channel has a downward slope, characterized by lower highs and lower lows. Trading within a diagonal range requires adjusting entry and exit points along the sloped boundaries instead of at fixed horizontal price levels.
Is Range Trading a Profitable Forex Strategy?
Range trading can certainly be a profitable forex strategy, but its success is highly dependent on specific factors and is not guaranteed. Many currency pairs spend a large portion of their time in consolidation phases rather than in strong, sustained trends. This creates frequent opportunities for range traders to capitalize on predictable price oscillations. The strategy’s appeal lies in its clear rules for entry, exit, and stop-loss placement, which can help instill discipline.
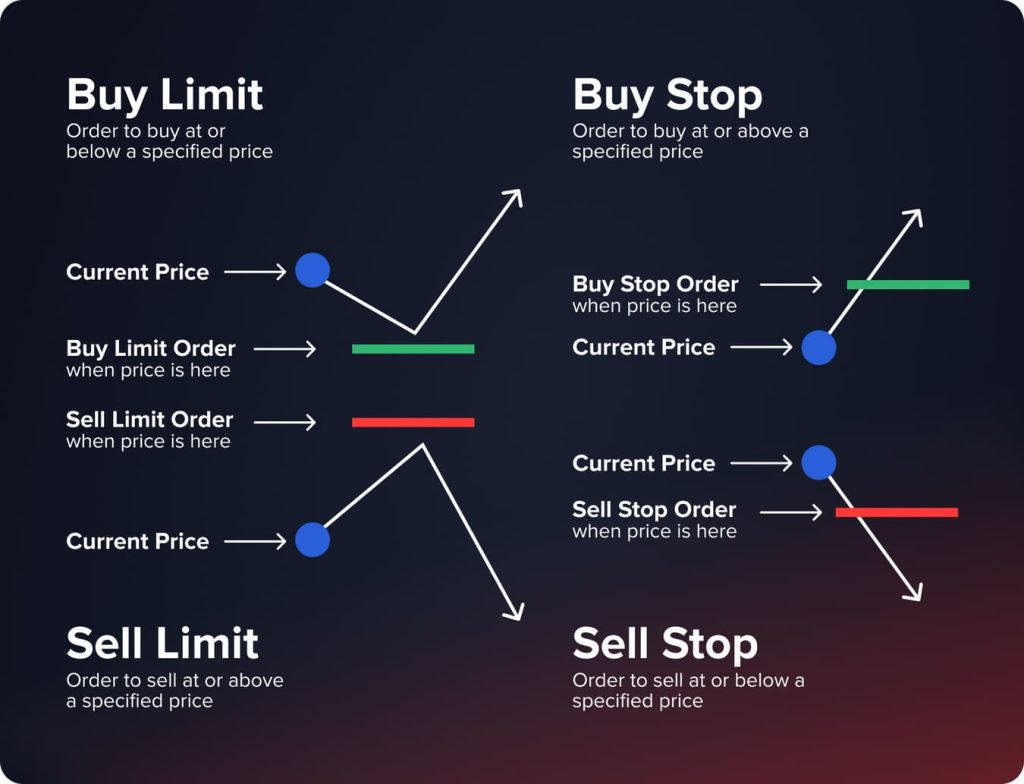
However, profitability hinges on several key elements. First, the trader must be skilled at correctly identifying suitable market conditions. Attempting to apply a range strategy in a strongly trending market is a recipe for failure. Second, strict risk management is absolutely essential. Because the profit per trade is typically modest, a single unmanaged loss from a breakout can wipe out the gains from numerous winning trades. Finally, trader discipline is paramount. This includes having the patience to wait for the price to reach the ideal entry points at the edges of the range and the self-control to stick to the predefined profit targets and stop-losses.
Which Currency Pairs are Best for Range Trading?
The best currency pairs for range trading are typically those known for lower volatility and a tendency to enter prolonged periods of consolidation. These characteristics are often found in pairs linking economies that are stable, mature, and highly interconnected, as this can temper sharp, divergent moves.

- EUR/CHF (Euro vs. Swiss Franc). This pair is a classic example. The Swiss and Eurozone economies are deeply integrated, and the Swiss Franc often acts as a safe-haven currency. This dynamic frequently leads to stable, slow-moving price action that forms well-defined ranges, making it a favorite among range traders.
- AUD/NZD (Australian Dollar vs. New Zealand Dollar). The economies of Australia and New Zealand are similar and closely linked through trade. As a result, their currencies often move in a correlated fashion, which limits the potential for strong, sustained trends and creates a market environment conducive to ranging.
- USD/CAD (US Dollar vs. Canadian Dollar). While this pair can experience strong trends based on oil prices and monetary policy divergence, it also frequently enters long consolidation phases. The deep economic ties between the United States and Canada can create periods of equilibrium where the exchange rate oscillates within a predictable range.