

Blog
What Are the Best Forex Indicators for Successful Manual Trading?

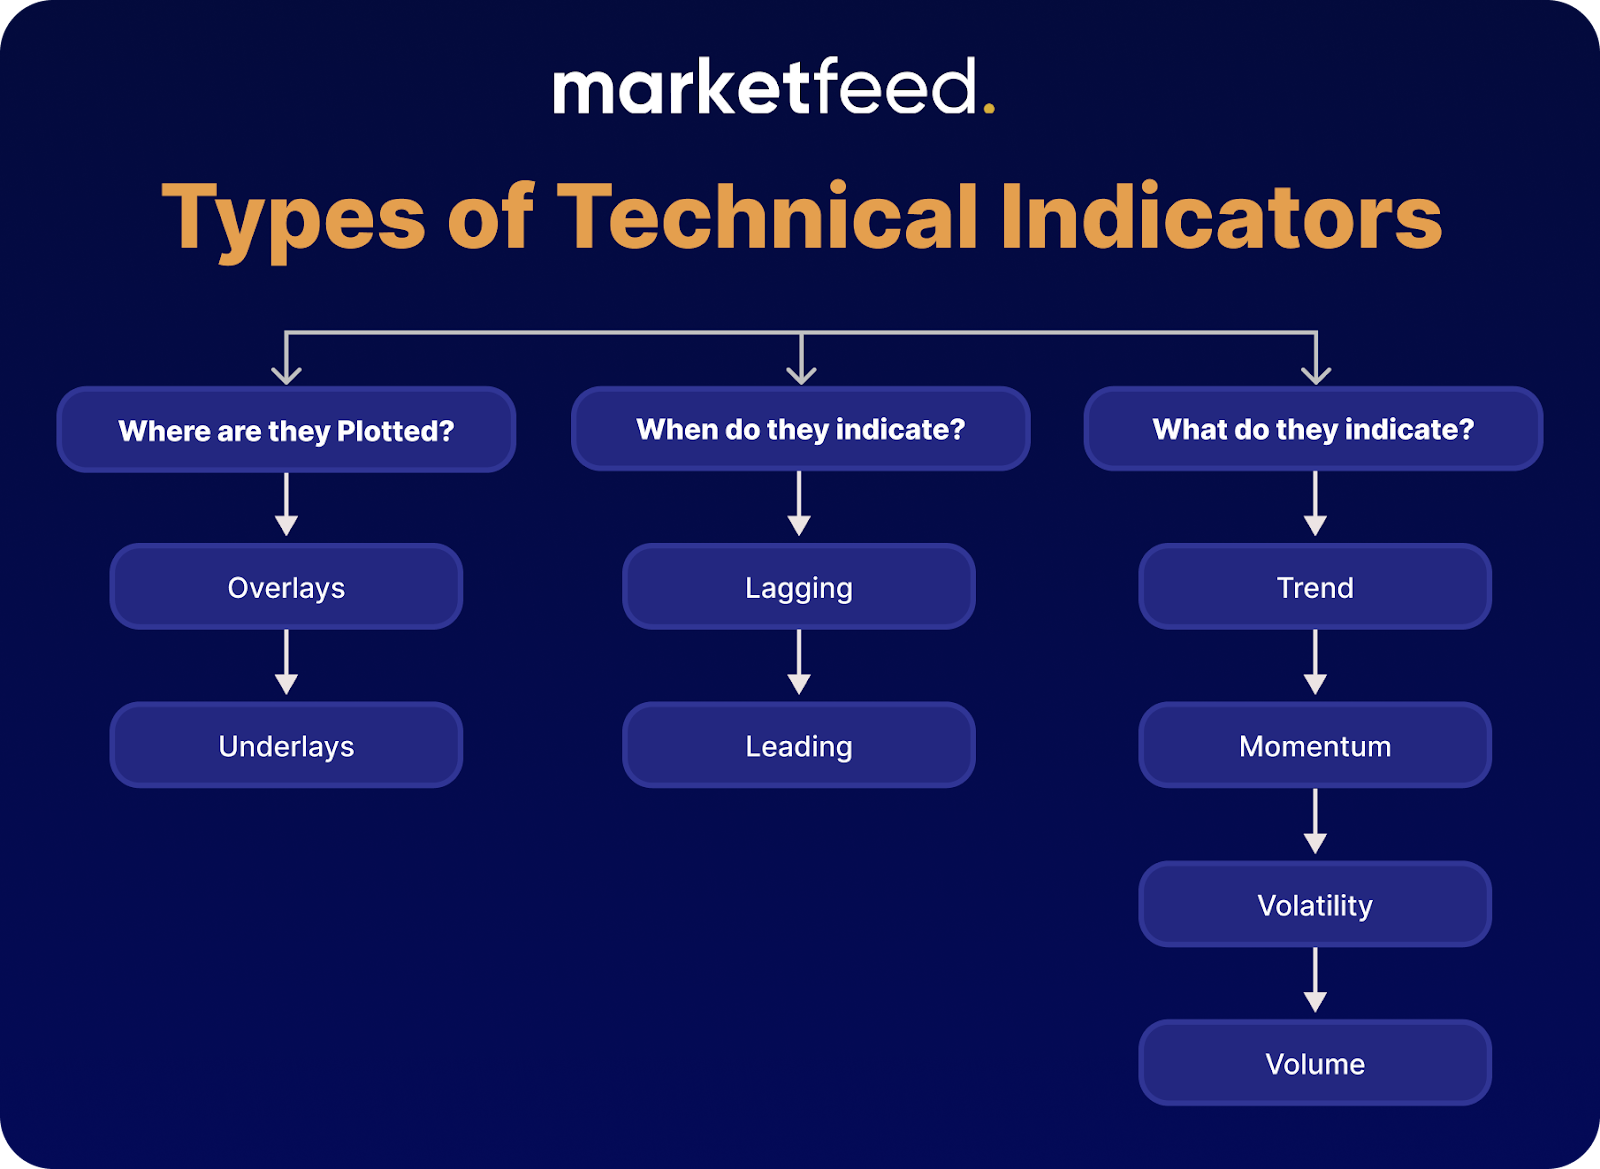
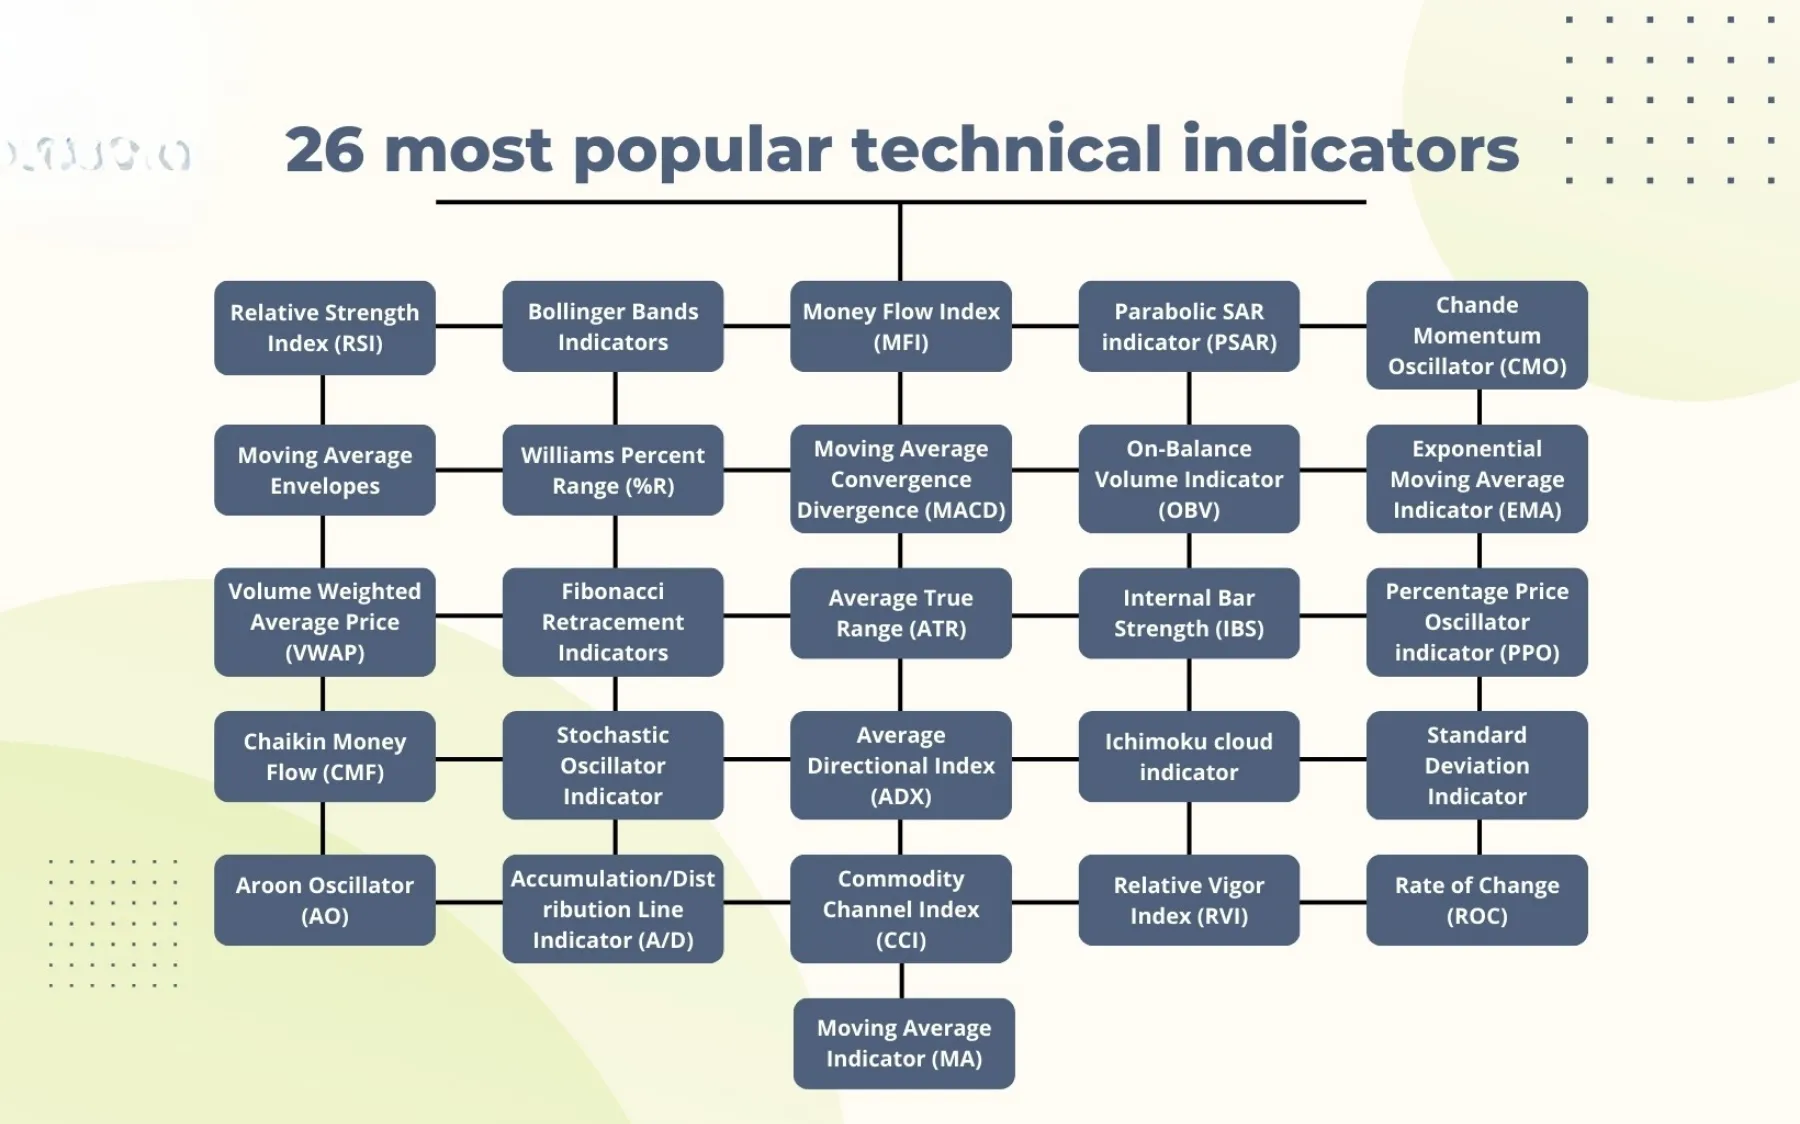
The best forex indicators for successful manual trading are those that clearly identify trend, momentum, and volatility, with top choices including Moving Averages (MA), the Moving Average Convergence Divergence (MACD), the Relative Strength Index (RSI), and Bollinger Bands. These tools provide a structured way to analyze price action and make informed decisions. A successful strategy often involves combining a trend-following indicator, like a Moving Average, with a momentum oscillator, like the RSI, to confirm signals and improve trade entry and exit timing. This multi-indicator approach helps filter out market noise and increases the probability of a successful trade.
The most effective indicator setup directly aligns with your personal trading style and preferred timeframe. For instance, a long-term swing trader might find success using a 50-period and 200-period Exponential Moving Average on a daily chart, whereas a short-term scalper will need faster indicators like the Stochastic Oscillator on a 5-minute chart. There is no one-size-fits-all solution; the key is to test different combinations in a demo environment to find what best suits your methodology and risk tolerance. Your choice should simplify your analysis, not complicate it.
Most professional traders avoid relying on a single indicator because it provides an incomplete picture of the market. Using multiple, non-correlated indicators for confirmation, a concept known as confluence, is a much more robust approach. For example, a buy signal is stronger if a moving average crossover indicates an uptrend, the RSI shows the currency pair is moving out of an oversold condition, and the MACD histogram is gaining positive momentum. This layered analysis helps validate a trading idea and reduces the chance of acting on a false signal.
Understanding these analytical tools is foundational to moving beyond guesswork and toward a systematic trading plan. Each indicator translates raw price and volume data into easily digestible visual signals, helping you spot opportunities that might otherwise be invisible. As we explore the top indicators in each category, you will learn not just what they are, but how to practically apply them to identify trends, measure momentum, and manage risk in your manual trading.
What is a Forex Trading Indicator?
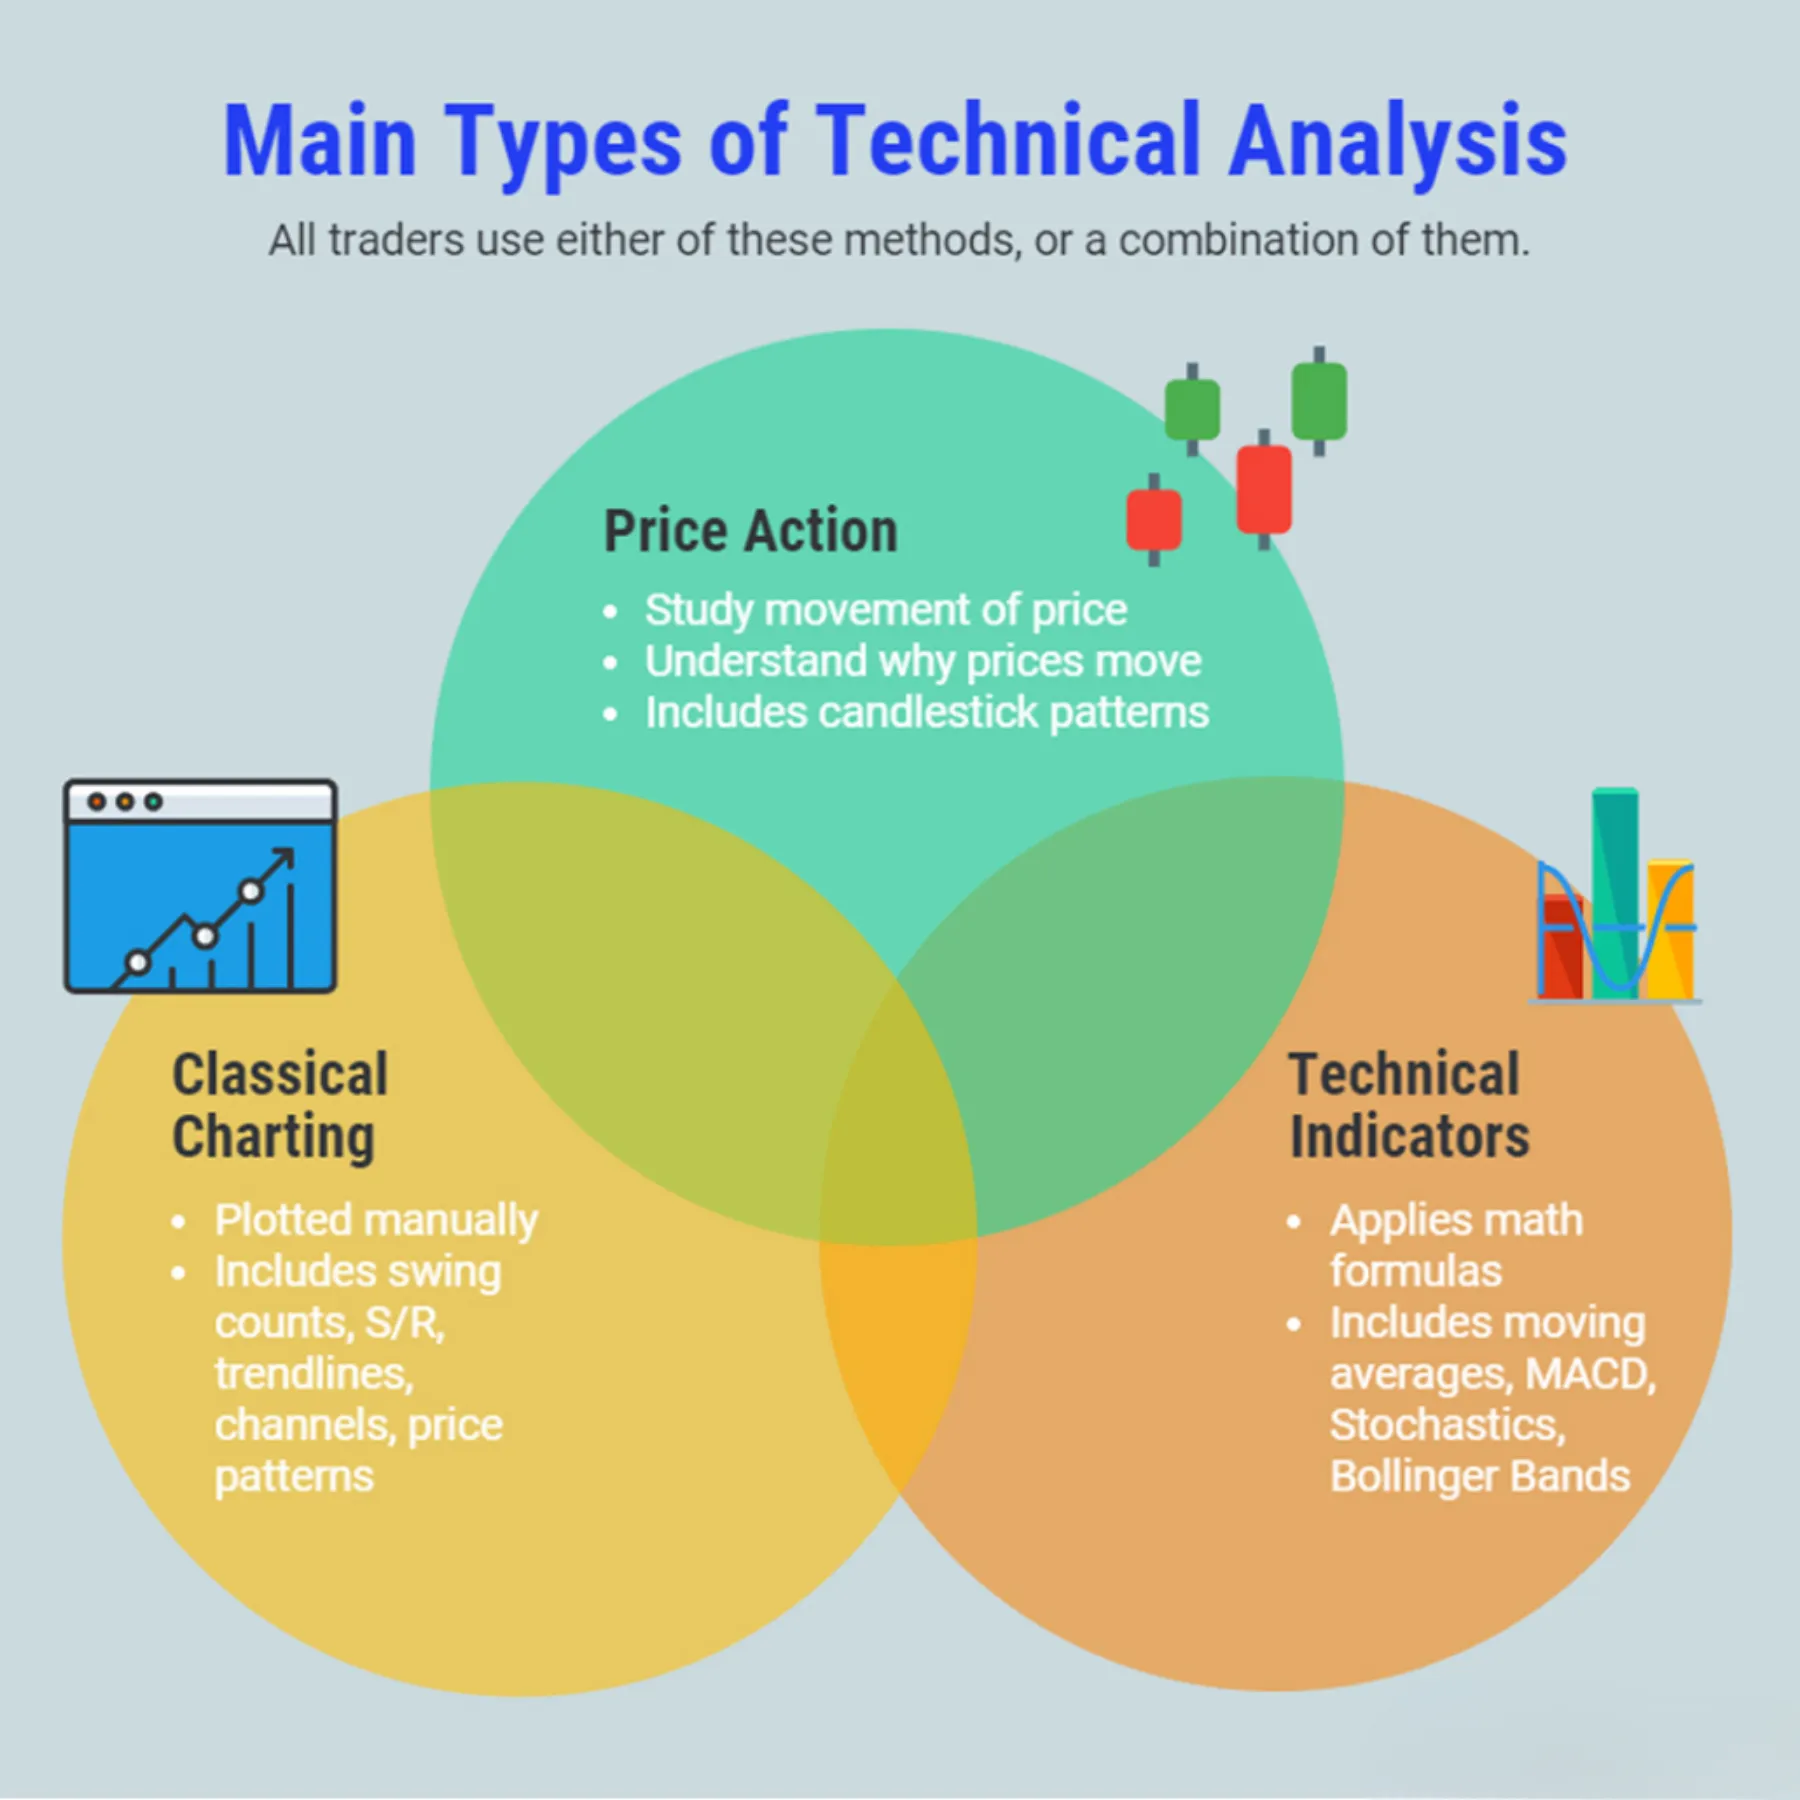
A forex trading indicator is a mathematical tool that uses price, volume, or open interest data to create a visual representation on a chart, helping traders forecast future price movements. To understand this better, think of indicators as filters that process raw market information into simplified signals. They don’t predict the future with 100% certainty, but they provide a high-probability framework for analyzing market behavior, identifying patterns, and making more objective trading decisions. Without indicators, a price chart is just a series of random-looking candlesticks. With them, you can begin to see underlying trends, measure the strength of price moves, and spot potential turning points in the market.
For a manual trader, indicators are indispensable for building a consistent and repeatable strategy. They help remove emotion from the decision-making process by providing clear, data-driven entry and exit signals. For example, instead of buying a currency pair simply because it “feels” like it’s going to go up, a trader can wait for a specific signal, like a moving average crossover or an RSI reading moving out of the oversold territory. This systematic approach is what separates professional trading from gambling. Indicators are not a magic bullet, but they are essential instruments for navigating the complexities of the forex market, allowing you to quantify market conditions and execute your trading plan with discipline and confidence.
What are the Main Categories of Trading Indicators?
There are four main categories of trading indicators: trend, momentum, volatility, and volume, each designed to analyze a different aspect of market behavior. Understanding these categories is the first step toward building a comprehensive trading strategy, as traders often combine indicators from different groups to get a more complete view of the market. For instance, you might use a trend indicator to determine the overall market direction and a momentum indicator to pinpoint the best time to enter or exit a trade within that trend.

Here’s a breakdown of the four primary types:
- Trend Indicators: As the name suggests, these indicators are designed to help you identify the direction and strength of a market trend. They smooth out price fluctuations to give you a clearer picture of whether the market is in an uptrend, a downtrend, or moving sideways (ranging). Common examples include Moving Averages (MA), the Moving Average Convergence Divergence (MACD), and the Parabolic SAR. A trend-following strategy, which is one of the most popular approaches, relies heavily on these tools to ensure you are trading with the market’s primary momentum, not against it.
- Momentum Indicators: Also known as oscillators, these indicators measure the speed and strength of price movements. They are typically plotted within a range, such as 0 to 100, and help identify “overbought” or “oversold” conditions. An overbought signal suggests that buying pressure may be exhausted and a price reversal or pullback is imminent. An oversold signal suggests the opposite. The most popular momentum indicators are the Relative Strength Index (RSI) and the Stochastic Oscillator. They are particularly useful for timing entries and exits.
- Volatility Indicators: Volatility measures the magnitude of price fluctuations. High volatility means prices are changing rapidly, while low volatility means they are relatively stable. Volatility indicators help you gauge the current market environment, which is essential for risk management. For example, in a highly volatile market, you would likely need to use a wider stop-loss to avoid being prematurely stopped out of a trade. Key examples include Bollinger Bands and the Average True Range (ATR).
- Volume Indicators: These indicators show the number of units of a currency pair traded over a specific period. Volume is a crucial secondary indicator because it can be used to confirm the strength of a trend. For example, a price breakout accompanied by high volume is generally considered more valid than one with low volume. While volume data can be less straightforward in the decentralized forex market, indicators like the On-Balance Volume (OBV) are still used by many traders to gauge buying and selling pressure.
Which Forex Indicators are Best for Manual Trend Trading?
The best indicators for manual trend trading are the Moving Average (MA), the Moving Average Convergence Divergence (MACD), and the Parabolic SAR (PSAR) because they offer clear, visual signals about trend direction, strength, and potential reversals. Let’s explore how each of these powerful tools provides unique insights that help a trend-following trader make informed decisions. A successful trend trader’s goal is to identify a prevailing trend and ride it for as long as possible, and these indicators are specifically designed to facilitate that strategy. They help answer the most critical questions for a trend trader: Which direction is the market moving? Is the trend gaining or losing strength? And when is the trend likely to end? By combining the signals from these indicators, you can build a robust system for capturing profits from sustained market movements.
Using these tools together creates a system of checks and balances. For example, a Moving Average can confirm the long-term direction, the MACD can measure the momentum behind the current price swing within that trend, and the Parabolic SAR can provide a dynamic trailing stop-loss to lock in profits as the trend progresses. This multi-faceted approach helps filter out false signals and increases your confidence in each trade. Instead of relying on a single piece of information, you are gathering evidence from multiple sources, all pointing toward the same high-probability outcome.
How Does the Moving Average (MA) Help Confirm Trend Direction?
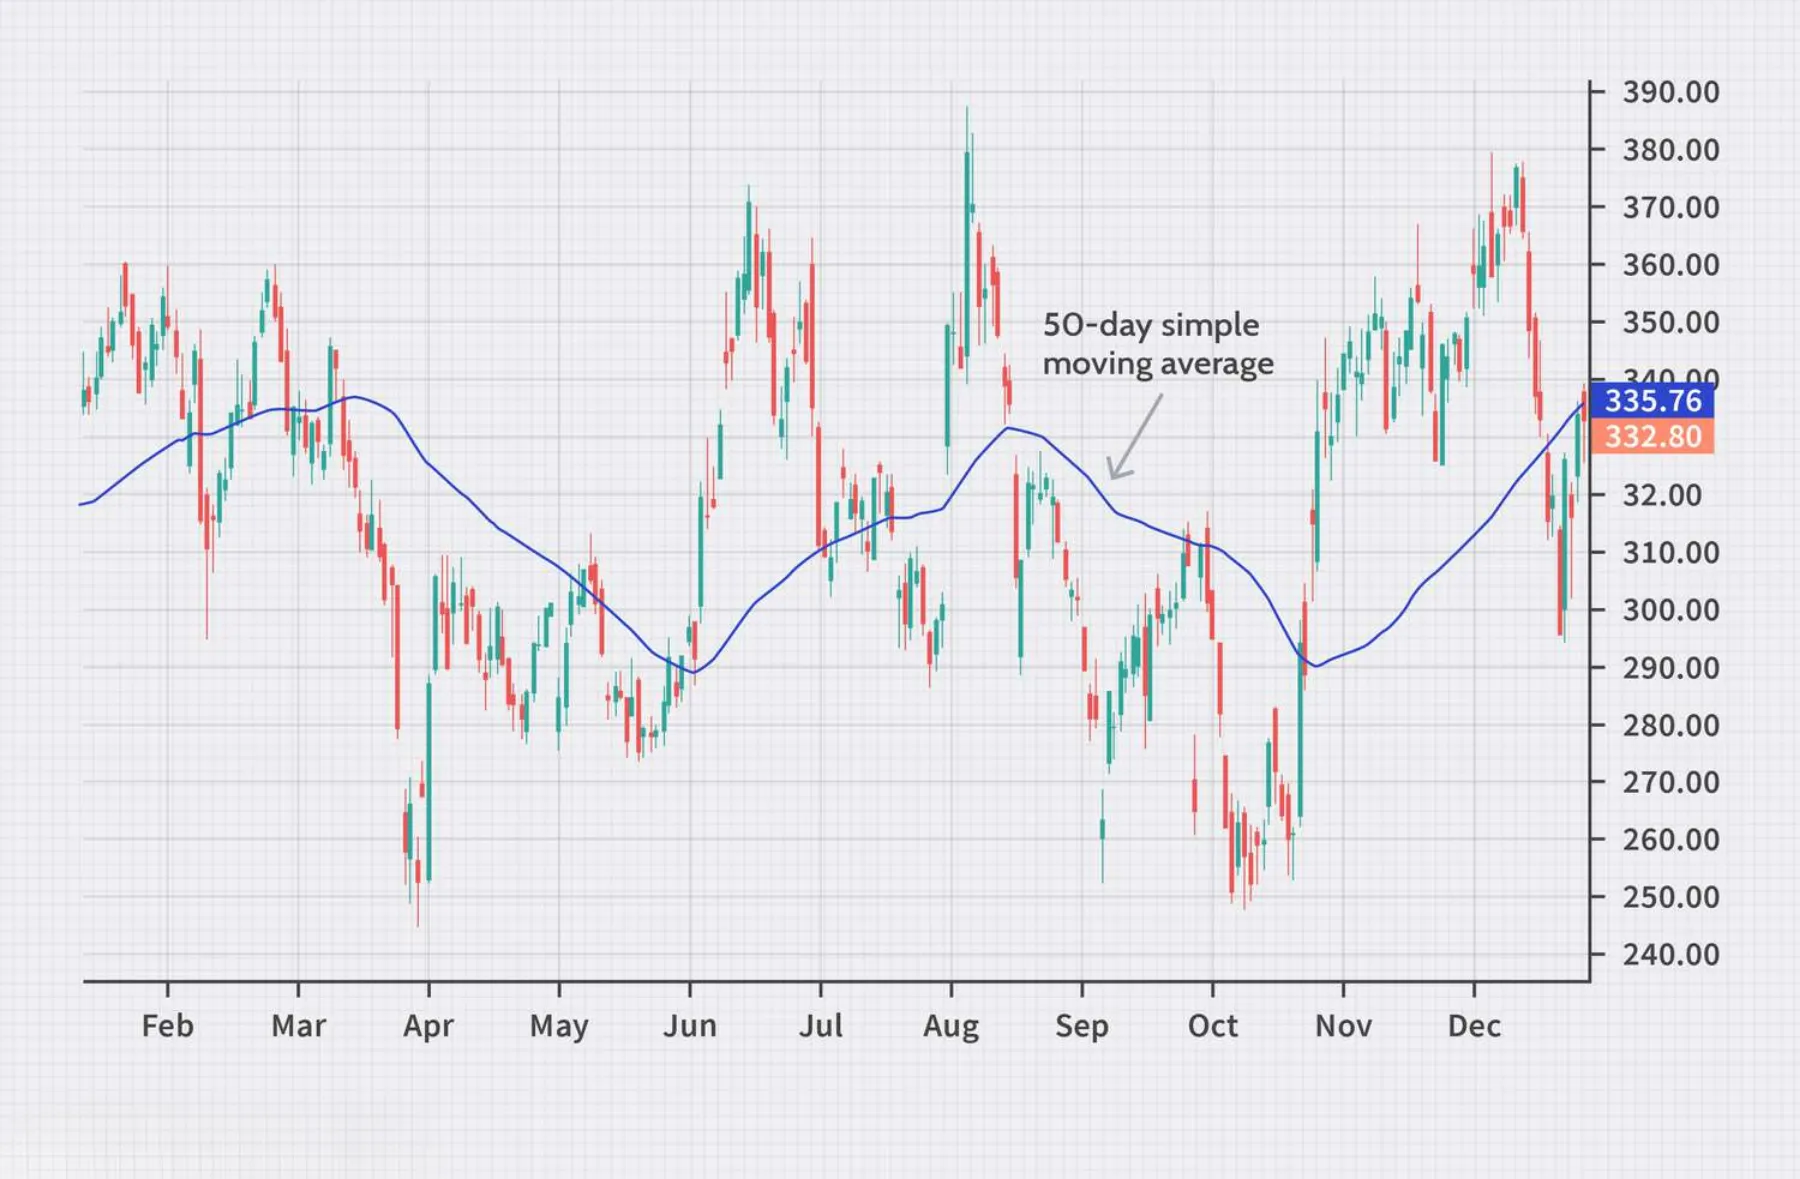
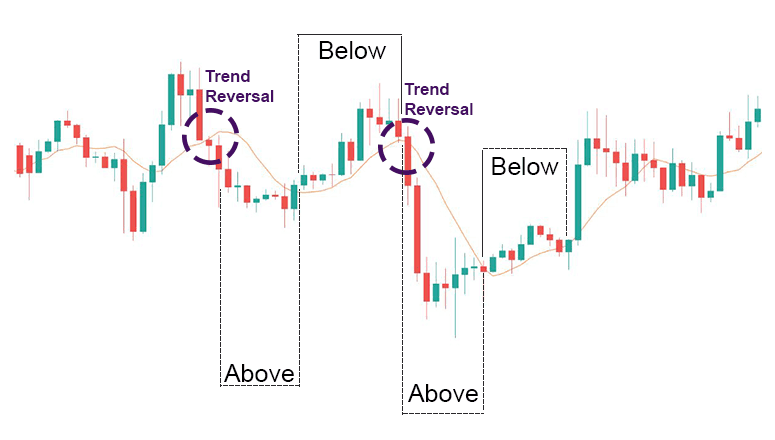
A Moving Average helps confirm trend direction by smoothing out price data to create a single, flowing line that makes it easier to identify the underlying trend. It calculates the average price of a currency pair over a specific number of periods, effectively filtering out the short-term market “noise.” There are two primary types you’ll encounter: the Simple Moving Average (SMA), which gives equal weight to all prices in the period, and the Exponential Moving Average (EMA), which gives more weight to recent prices, making it more responsive to new information.
Manual traders use Moving Averages in several key ways to make decisions. The most basic method is observing the slope of the MA line. If a long-term MA, like the 200-period EMA, is consistently pointing upwards, it signals a strong bullish trend, and traders should focus on looking for buying opportunities. Conversely, a downward-sloping MA indicates a bearish trend, signaling traders to look for selling opportunities. A flat or sideways-moving MA suggests a ranging market, where a trend-following strategy may not be effective.
Another popular technique is the MA crossover. This involves plotting two MAs on a chart, a short-term one (e.g., 50-period EMA) and a long-term one (e.g., 200-period EMA). A bullish signal, often called a “golden cross,” occurs when the shorter-term MA crosses above the longer-term MA, indicating that upward momentum is building. A bearish signal, or “death cross,” happens when the shorter-term MA crosses below the longer-term MA. These signals are powerful confirmations of a new trend starting or an existing trend continuing. Finally, in a strong trend, the MA line often acts as a dynamic level of support or resistance. In an uptrend, price will often pull back to the MA line before continuing its upward journey, providing a potential low-risk entry point for traders looking to join the trend.
How Does the Moving Average Convergence Divergence (MACD) Show Trend Momentum?
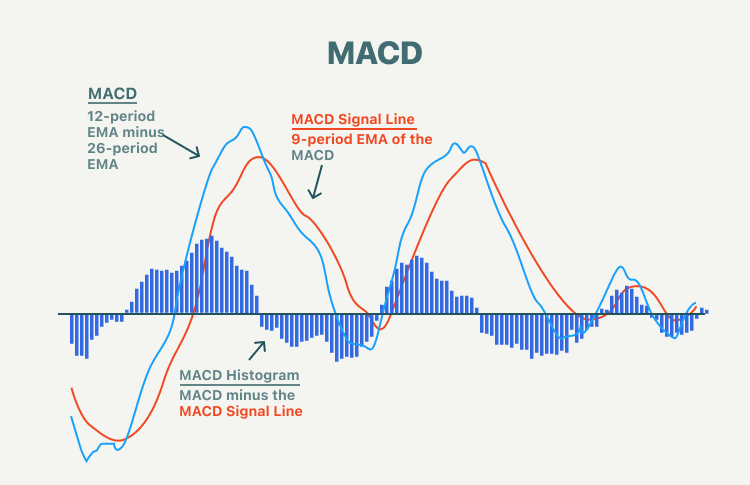
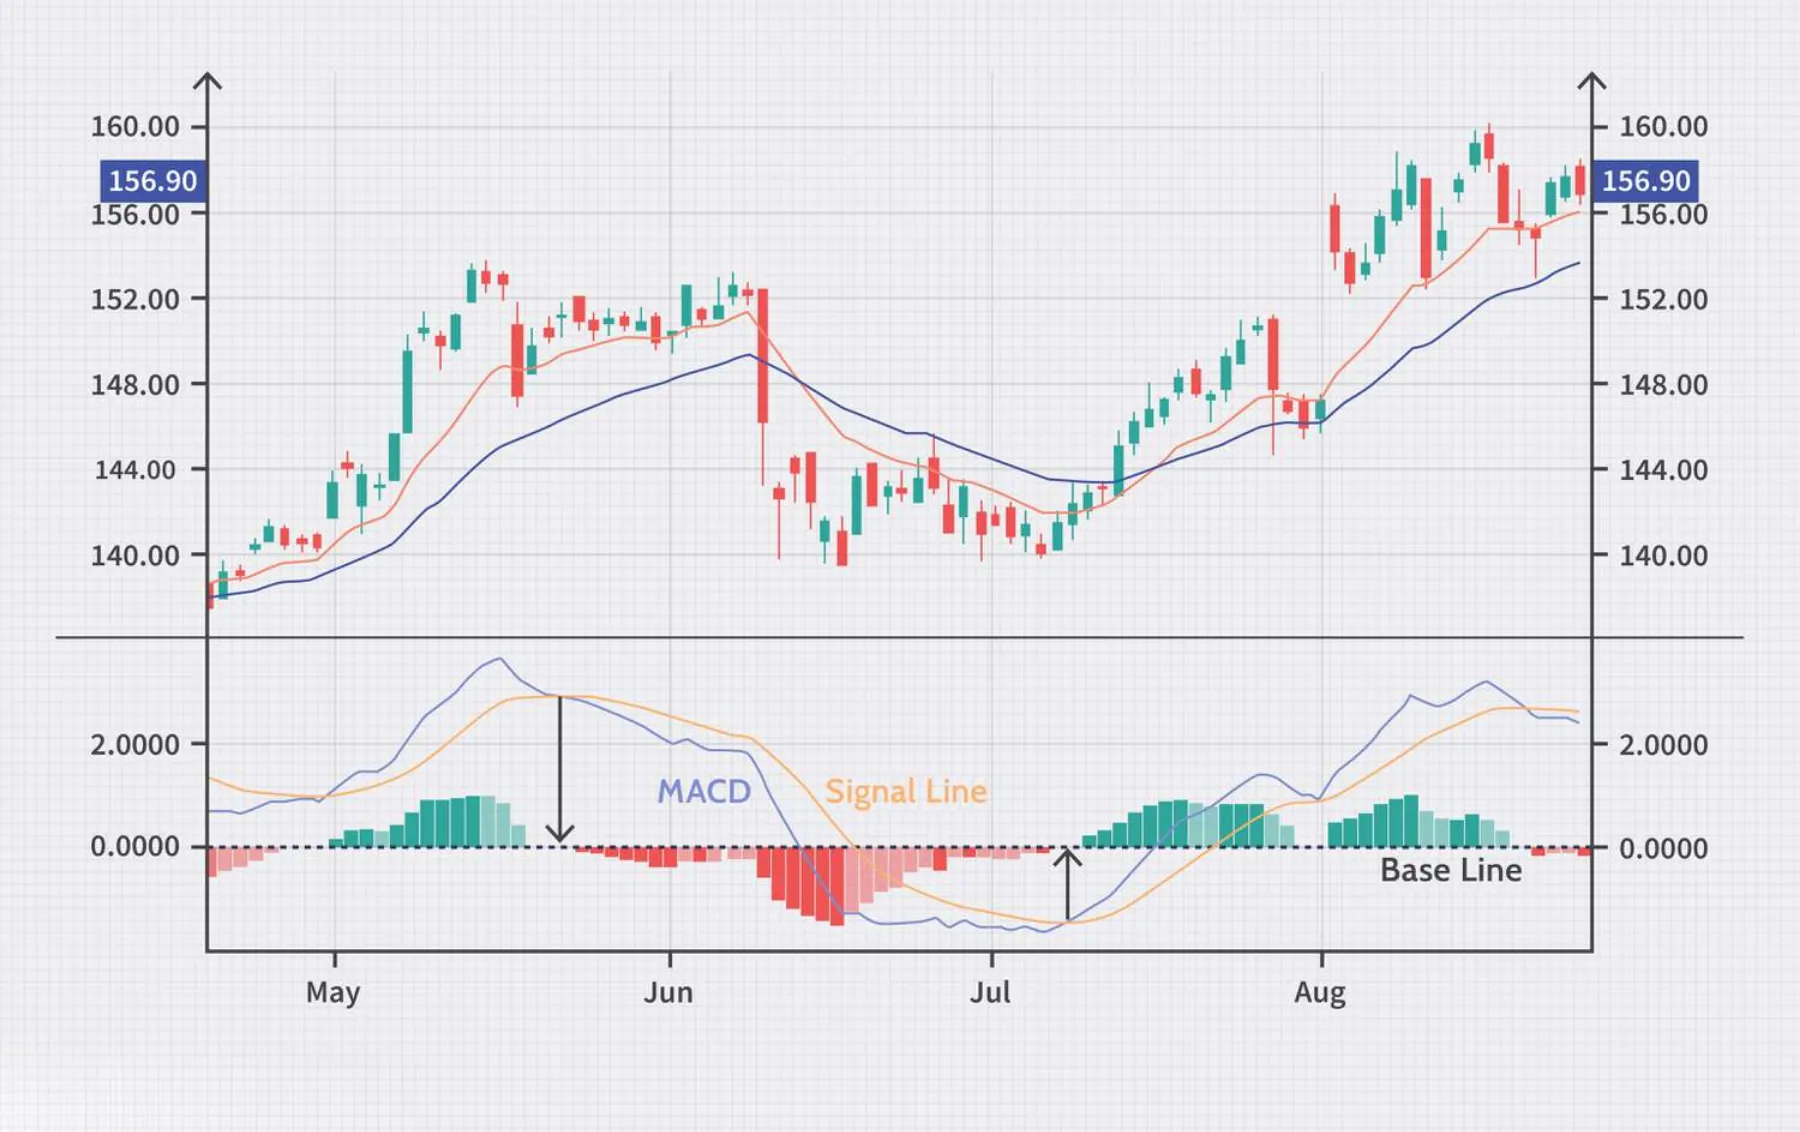
The Moving Average Convergence Divergence (MACD) shows trend momentum by measuring the relationship between two Exponential Moving Averages (EMAs). This powerful tool is more than just a trend indicator; it’s a momentum oscillator that reveals the strength and direction of a trend. The indicator consists of three main components you’ll see on your chart: the MACD line (the difference between the 12-period and 26-period EMAs), the signal line (a 9-period EMA of the MACD line), and the histogram (the difference between the MACD line and the signal line). The histogram is especially useful because it gives an at-a-glance visual of momentum.
Traders use the MACD to identify trading signals in a few distinct ways. The most common is the crossover signal. When the MACD line crosses above the signal line, it’s a bullish signal, suggesting that upward momentum is increasing and it might be a good time to buy. When the MACD line crosses below the signal line, it’s a bearish signal, indicating that downward momentum is building. The histogram helps visualize this; when the bars are above the zero line and growing taller, bullish momentum is strengthening. When they are below the zero line and getting longer, bearish momentum is strengthening.
However, one of the most powerful signals from the MACD is divergence. Divergence occurs when the price of the asset is moving in the opposite direction of the MACD indicator. For instance, if the price makes a new higher high, but the MACD line makes a lower high, this is known as bearish divergence. It’s a red flag that the upward momentum is weakening, and the trend could be about to reverse. Conversely, if the price makes a new lower low, but the MACD makes a higher low, this is bullish divergence, signaling that the downtrend is losing steam and a reversal to the upside may be coming. These divergence signals often precede major trend changes and can provide excellent entry points for savvy manual traders.
How Does the Parabolic SAR (PSAR) Pinpoint Potential Reversals?
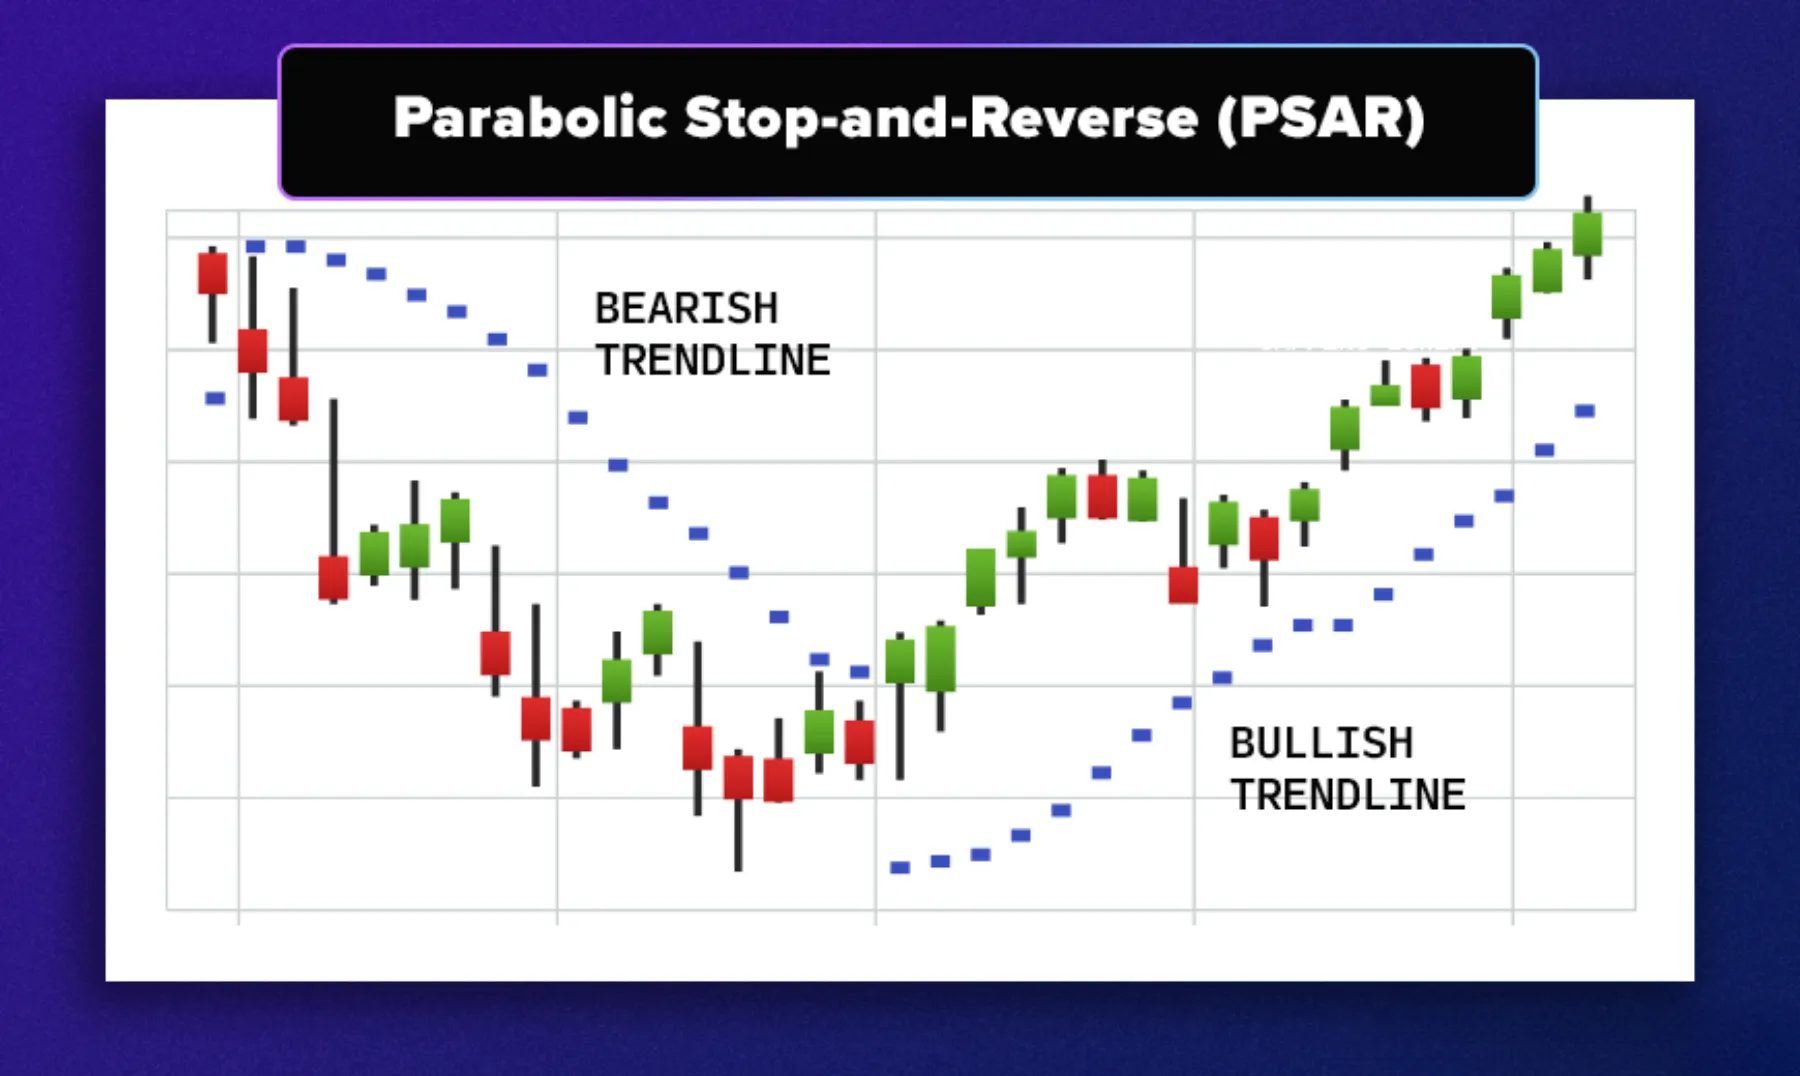
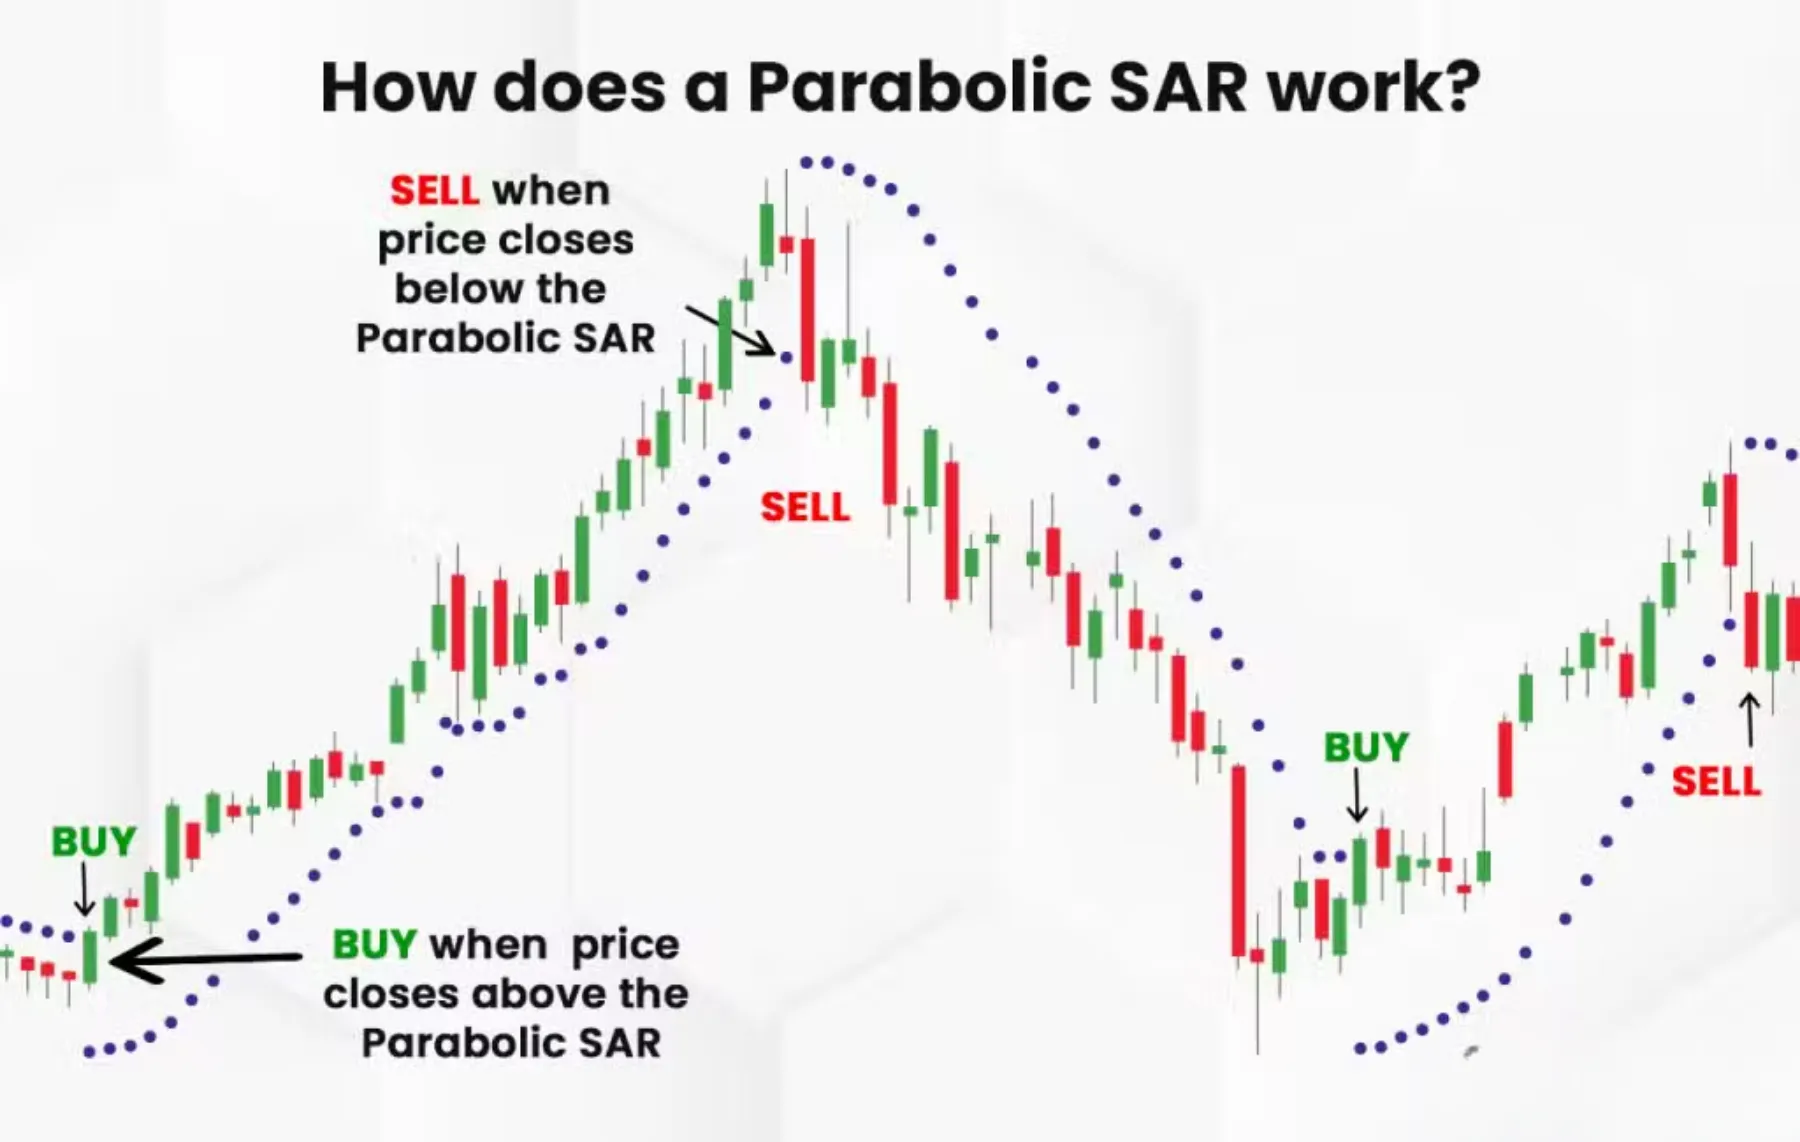
The Parabolic SAR (Stop and Reverse) indicator pinpoints potential reversals by placing a series of dots on the chart either above or below the price candles. This tool was designed by J. Welles Wilder Jr., the same analyst who created the RSI, to help traders determine trend direction and provide potential exit points. Its primary function is to signal when a current trend may be ending and a new trend is beginning. The indicator is always “in” the market, providing a continuous signal for either a long or short position.
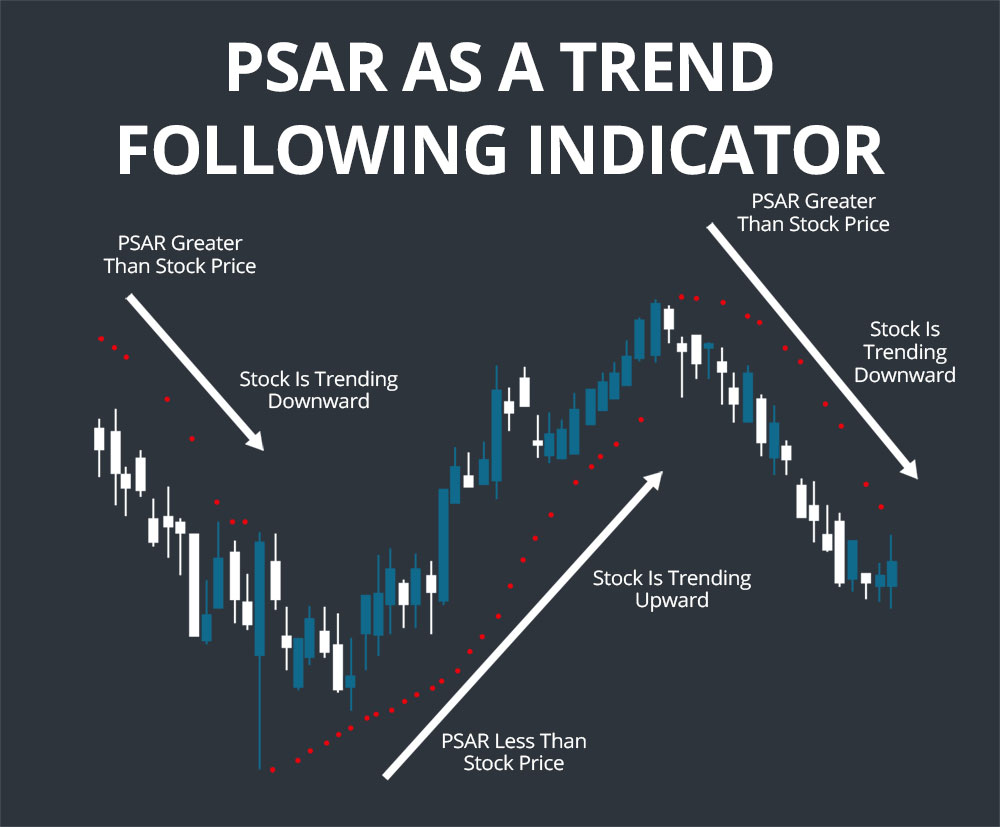
Using the Parabolic SAR is very straightforward. When the dots are below the price candles, it signals a bullish trend, and traders should be in or looking for long (buy) positions. As the uptrend continues, the dots will trail below the price, moving up with each new candle. These dots also act as a trailing stop-loss; if the price falls and touches or crosses below the dot, it signals that the upward momentum has stalled and a reversal might be occurring.
Conversely, when the dots are above the price candles, it indicates a bearish trend, suggesting traders should be in or looking for short (sell) positions. The dots will trail above the price, moving lower as the downtrend progresses. If the price rises and touches or crosses above the dot, it generates a signal to exit the short trade. This “flip,” where the dots switch from being below the price to above it (or vice-versa), is the core reversal signal of the Parabolic SAR. While it is excellent in trending markets, it can produce many false signals in sideways or ranging markets, so it is best used in conjunction with other trend-confirming indicators like a Moving Average.
Which Forex Indicators are Best for Measuring Market Momentum?
The best forex indicators for measuring market momentum are oscillators like the Relative Strength Index (RSI) and the Stochastic Oscillator, as they are specifically designed to identify overbought and oversold conditions. To understand this better, momentum indicators help you determine the speed and strength of a price move. They can alert you when a trend is running out of steam and is due for a pullback or a complete reversal. This makes them invaluable tools for timing your entries and exits with greater precision. While trend indicators tell you which direction the market is heading, momentum indicators tell you how much conviction is behind that move.
These oscillators are typically displayed in a separate window below the main price chart and fluctuate within a defined range (e.g., 0 to 100). This bounded nature makes it easy to spot extreme readings. When an oscillator reaches the upper end of its range, it signals that the market is “overbought,” meaning the buying pressure may be exhausted. When it reaches the lower end, it signals that the market is “oversold,” and selling pressure may be tapering off. By combining these signals with the overall trend, a manual trader can find high-probability entry points, such as buying during a pullback to an oversold level in a confirmed uptrend.
How Does the Relative Strength Index (RSI) Signal Overbought or Oversold Conditions?
The Relative Strength Index (RSI) signals overbought or oversold conditions by measuring the magnitude of recent price changes to evaluate the speed and change of price movements. It is presented as an oscillator, a line graph that moves between two extremes, and is scaled from 0 to 100. The creator, J. Welles Wilder Jr., recommended a default period of 14, which remains the standard for most charting platforms. The RSI provides clear visual cues that help traders gauge whether a currency pair is over-extended in one direction and potentially ready for a turn.

The primary way traders use the RSI is by monitoring the traditional overbought and oversold levels. An asset is generally considered overbought when the RSI is above 70. This reading suggests that there has been a strong run-up in price and the move may be getting exhausted, making a price correction or reversal more likely. It is a signal to be cautious about opening new long positions and to consider taking profits on existing ones. Conversely, an asset is considered oversold when the RSI is below 30. This indicates a steep price decline that may have gone too far, suggesting that selling pressure is waning and a bounce or reversal to the upside could be near. This is often used as a signal to look for buying opportunities.
A more advanced and often more reliable signal from the RSI is divergence. This occurs when the direction of the price and the direction of the RSI are moving in opposite directions. For example, if the price is making a new high, but the RSI is making a lower high, this is called bearish divergence. It is a strong warning sign that the underlying momentum of the uptrend is fading and a reversal could be on the horizon. Bullish divergence occurs when the price makes a new low, but the RSI makes a higher low, signaling that the downtrend is losing its power.
How Does the Stochastic Oscillator Identify Turning Points in the Market?
The Stochastic Oscillator identifies potential turning points in the market by comparing a particular closing price of an asset to its high-low price range over a set period. The theory behind this indicator is that in an uptrend, prices tend to close near their highs, and in a downtrend, they tend to close near their lows. When the closing prices start to deviate from this pattern, it can signal that momentum is slowing and a turning point is near. Like the RSI, it is an oscillator that moves between 0 and 100 and is displayed in a separate window on the chart.
The indicator is composed of two lines: the %K line, which is the main line showing the current value of the oscillator, and the %D line, which is a 3-period moving average of the %K line. The most important signals are generated by these two lines in the overbought and oversold zones. The area above 80 is considered the overbought region, and the area below 20 is considered the oversold region.
A primary trading signal occurs with a crossover of the %K and %D lines inside these extreme zones. For a potential sell signal, traders look for both lines to be in the overbought region (above 80). When the faster %K line crosses below the slower %D line, it confirms that upward momentum is fading and signals a potential entry for a short trade. For a potential buy signal, traders wait for both lines to move into the oversold region (below 20). When the %K line then crosses above the %D line, it indicates that downward momentum is exhausted and provides a signal to enter a long trade. This combination of location (overbought/oversold) and action (crossover) makes the Stochastic Oscillator a popular tool for timing entries and exits.
Which Forex Indicators are Best for Assessing Market Volatility?
The best forex indicators for assessing market volatility are Bollinger Bands and the Average True Range (ATR), as they provide clear, real-time measurements of price fluctuation and market energy. Let’s explore why understanding and measuring volatility is a critical component of successful trading. Volatility is like the heartbeat of the market; sometimes it’s calm and steady, and other times it’s fast and erratic. These indicators don’t predict price direction, but they tell you about the current state of the market’s activity level. This information is vital for adapting your strategy, particularly when it comes to risk management.
For a manual trader, knowing the current volatility level helps answer key questions. Should I use a tight or wide stop-loss? Are conditions right for a breakout strategy, or is a range-trading approach more suitable? For instance, low volatility often precedes a significant price breakout, while high volatility might signal that a trend is becoming overextended. By using tools like Bollinger Bands and the ATR, you can make more informed decisions about your trade parameters, helping you stay in winning trades longer and cut losses more effectively, all based on the market’s current behavior rather than on static rules. This adaptive approach is a hallmark of a professional trader.
How Do Bollinger Bands Measure Volatility and Identify Price Extremes?
Bollinger Bands measure volatility and identify price extremes using three lines plotted on a price chart. The indicator consists of a middle band, which is a Simple Moving Average (typically with a 20-period setting), and an upper and lower band that are positioned two standard deviations away from the middle band. Standard deviation is a statistical measure of how spread out numbers are, so in this context, it directly measures price volatility.

The key feature of Bollinger Bands is how the outer bands behave. During periods of low volatility, the bands contract or squeeze together, indicating that the market is consolidating. This “squeeze” is often a warning sign that a period of high volatility, and a potentially strong price move, is about to occur. Traders often watch for a price breakout from a squeeze as a powerful entry signal. Conversely, during periods of high volatility, the bands expand or move further apart, showing that price is moving rapidly. This expansion reflects an active and uncertain market.
Beyond measuring volatility, the bands also serve as dynamic levels of support and resistance, helping to identify price extremes. The underlying concept is that price tends to return to the middle of the bands. When the price touches the upper band, the asset can be considered relatively expensive or overbought, suggesting a potential opportunity to sell or take profit on a long position. When the price touches the lower band, it can be considered relatively cheap or oversold, signaling a potential buying opportunity. However, it’s important to use this with caution. In a strong uptrend, prices can “walk the upper band” for an extended period, and in a strong downtrend, they can “walk the lower band.” Therefore, these signals are most reliable when confirmed with other indicators.
How Does the Average True Range (ATR) Help with Risk Management?
The Average True Range (ATR) helps with risk management by providing an objective measure of market volatility, which is essential for setting appropriate stop-loss levels. Unlike many other indicators, the ATR does not provide any information about trend direction or momentum. Its sole purpose is to measure how much an asset typically moves over a given period. It is displayed as a single line in a window below the price chart, where a rising ATR indicates increasing volatility and a falling ATR indicates decreasing volatility.
The primary application for manual traders is in stop-loss placement. Setting a stop-loss is a delicate balance. If it’s too tight, you risk being stopped out by normal market noise before the trade has a chance to play out. If it’s too wide, you risk taking an unnecessarily large loss. The ATR solves this problem by telling you what the “normal market noise” is for that specific currency pair at that specific time. For example, if the 14-period ATR on a EUR/USD chart is 20 pips, it means the pair has moved an average of 20 pips per period over the last 14 periods.
A common strategy is to set a stop-loss at a multiple of the ATR value, such as 1.5x or 2x the ATR, away from your entry price. If you enter a long trade and the ATR is 20 pips, you might place your stop-loss 40 pips (2 x 20) below your entry. This approach is dynamic; in a highly volatile market (high ATR), your stop-loss will automatically be wider, giving the trade more room to breathe. In a quiet market (low ATR), your stop-loss will be tighter, protecting your capital more closely. Using the ATR for stop-loss management removes guesswork and emotion, grounding your risk parameters in the market’s current behavior.
How Do You Choose the Right Indicator for Your Trading Style?
You choose the right indicator for your trading style by first identifying your timeframe and goals, then selecting a combination of tools that aligns with that approach, often by pairing a trend indicator with a momentum indicator. The key is to realize there is no universally “best” indicator, only the one that is best for you and your specific strategy. A tool that is perfect for a long-term position trader will be nearly useless for a short-term scalper. Therefore, the selection process must begin with a clear understanding of who you are as a trader.
To understand this better, let’s look at how different types of traders might build their indicator toolkits. The goal is not to clutter your chart with dozens of lines and oscillators, which leads to “analysis paralysis.” Instead, the objective is to choose two to three complementary indicators that provide clear, actionable signals that fit your trading cadence.
- Scalpers: These traders operate on very short timeframes, like 1-minute to 5-minute charts, aiming for many small profits. They need extremely responsive indicators. A common setup might be a 5-period and 10-period EMA to identify the immediate trend direction, combined with the Stochastic Oscillator to pinpoint overbought and oversold levels for quick entry and exit signals.
- Day Traders: Operating within a single trading day on charts like the 15-minute or 1-hour, day traders need a balance between responsiveness and reliability. A good combination could be the 20-period EMA to define the intraday trend, the MACD to spot shifts in momentum and provide crossover signals, and Bollinger Bands to identify periods of consolidation (a squeeze) that might precede a breakout.
- Swing Traders: These traders hold positions for several days to weeks, typically using 4-hour or daily charts to capture larger price “swings.” Their strategy is based on identifying a strong, established trend. A classic swing trading setup includes using the 50-period and 200-period EMAs to confirm the long-term trend direction. They might then use the RSI to time their entries, waiting for a pullback to an oversold level (below 30) in a confirmed uptrend before buying.
- Position Traders: With the longest time horizon, position traders may hold trades for months or even years, focusing on major economic trends. They use weekly and monthly charts. Their toolkit would consist of very long-term indicators, such as the 100-period and 200-period Simple Moving Averages (SMAs), to identify foundational market trends. They might use the weekly MACD to confirm long-term momentum shifts.
Ultimately, the best way to choose your indicators is through practice. Use a demo account to experiment with different combinations on your preferred timeframe. The right set of indicators will feel intuitive, simplify your decision-making, and give you consistent, clear signals that you can trust. The goal is to build a system where the indicators serve you, not the other way around.
What Are Some Advanced Considerations for Using Forex Indicators?
Advanced considerations for using forex indicators involve understanding the difference between leading and lagging types, combining them for confirmation, avoiding common pitfalls, and recognizing their role as probabilistic tools, not guarantees. Furthermore, grasping these nuances helps traders move from basic application to a more sophisticated and effective use of technical analysis in their strategy.
What is the Difference Between Leading and Lagging Indicators?
The primary difference is that leading indicators attempt to predict future price movements, while lagging indicators confirm trends that are already underway. Leading indicators, such as the Relative Strength Index (RSI) or the Stochastic Oscillator, are designed to generate signals before a new trend or reversal occurs. They are valuable for identifying potential entry and exit points early, which can maximize profit potential. However, their predictive nature makes them prone to generating false signals, especially in non-trending or “choppy” markets. A trader might receive a buy signal from an oscillator only to see the price continue to fall.
In contrast, lagging indicators like Moving Averages (MA) and the Moving Average Convergence Divergence (MACD) are based on past price data. They move more slowly and only generate a signal after a trend has clearly established itself. This makes them more reliable for confirming a trend’s direction and reducing the number of false signals. The main drawback is their delayed nature. A signal to enter a trend may come after a large portion of the price move has already happened, potentially reducing the overall profit from the trade.
How Can You Combine Multiple Indicators for Stronger Confirmation?
You can create a more robust trading system by combining indicators from different categories to filter out false signals and provide stronger confirmation for trade entries. A common and effective strategy is to pair a trend-following indicator with a momentum oscillator. For example, a trader could use a 200-period Simple Moving Average (SMA) to identify the long-term trend. If the price is trading above the 200 SMA, the trader would only look for buying opportunities, filtering out any sell signals from other tools.
With the uptrend confirmed, the trader could then use the RSI to time the entry. Instead of buying immediately, they would wait for the RSI to dip into oversold territory (below 30) and then cross back above it. This combination provides a powerful confirmation signal. The moving average confirms the overall trend direction, and the RSI helps pinpoint a low-risk entry point within that trend. This multi-indicator approach, known as confluence, helps build a more complete picture of market conditions and improves the probability of a successful trade.
What are the Most Common Mistakes When Using Trading Indicators?
The most frequent errors when using indicators stem from over-reliance or misunderstanding their purpose. One of the biggest mistakes is analysis paralysis, which happens when a trader clutters their charts with too many indicators. With five or six different tools providing conflicting signals, it becomes nearly impossible to make a clear decision. Another common pitfall is ignoring price action. Indicators are derivatives of price, not a replacement for it. A trader who only looks at an indicator might miss important candlestick patterns or key support and resistance levels that tell a more accurate story about the market.
Additionally, many new traders make the mistake of using default indicator settings without testing them. An RSI with a 14-period setting might work well on the daily chart for EUR/USD but could be ineffective on a 15-minute chart for a different currency pair. Each asset and timeframe has unique characteristics, and indicators should be tested and optimized accordingly. Blindly applying standard settings without validating their performance can lead to a flawed trading strategy and unnecessary losses.
Do Forex Indicators Guarantee Profitable Trades?
No, forex indicators absolutely do not guarantee profitable trades. They are analytical tools designed to provide a probabilistic edge, not a crystal ball for predicting the future. An indicator helps you identify market conditions where a certain outcome is more likely to occur based on historical price behavior. For instance, an overbought RSI reading does not guarantee a price reversal, it simply signals that the probability of a downward correction has increased. The market can remain overbought for extended periods, especially in a strong trend.
Successful trading depends on a complete trading plan where indicators are just one component. The other essential elements include robust risk management, such as setting proper stop-loss orders and using appropriate position sizing to protect your capital. Trading psychology is another key factor, as even the best strategy can fail if a trader cannot manage fear and greed. Ultimately, indicators provide insights and potential trade setups, but profitability is achieved through disciplined execution, risk control, and consistent application of a well-rounded strategy.
How Does Using Indicators for Manual Trading Differ from Algorithmic Trading?
The core difference lies in the application of discretion versus rigid rules. In manual trading, indicators serve as decision-support tools, while in algorithmic trading, they form the basis for strict, automated execution rules. A manual trader uses indicators to analyze the market but combines that information with context, intuition, and experience. For example, a trader might see a bullish MACD crossover but choose to ignore the signal because it is occurring just below a major resistance level or right before a high-impact news release. This human element allows for flexibility and adaptation to changing market conditions.

Conversely, algorithmic trading systems, or Expert Advisors (EAs), rely on predefined, non-discretionary rules. A trading algorithm is programmed to execute a trade automatically once specific indicator conditions are met, without any human intervention. For instance, the code might state: “If the 50-period MA crosses above the 200-period MA, buy one standard lot.” The algorithm will execute this command every time the condition is met, regardless of other market factors. This removes emotion and ensures disciplined execution but lacks the ability to interpret market nuances that a human trader can.