

Blog
How to Backtest a Forex Trading Strategy Using Historical Data

Backtesting a forex trading strategy involves a four-step process of simulating trades on past price data to evaluate its potential profitability. You backtest by setting up a testing environment, systematically applying your predefined trading rules to historical data, recording every simulated trade, and analyzing the final performance report. This method allows you to see how your strategy would have performed historically without risking any actual money, providing a statistical foundation for its potential future success. The entire process hinges on having clear, objective rules and high-quality data to ensure the simulation is as realistic as possible.
The purpose of backtesting is to validate a trading idea using a data-driven approach rather than relying on gut feelings or assumptions. Specifically, backtesting serves to quantify a strategy’s performance, manage risk by identifying potential drawdowns, and build the necessary confidence to execute the strategy in live market conditions. By running your rules over months or years of historical price action, you can gather objective data on metrics like win rate, profit factor, and average profit per trade.
The most important components for a successful backtest are high-quality historical data and a set of specific, non-discretionary trading rules. Quality data ensures your simulation accurately reflects past market conditions, while explicit rules for entry, exit, stop-loss, and take-profit eliminate guesswork and make the test repeatable. Without these two foundational elements, the results of your backtest would be unreliable and could provide a false sense of security about a flawed strategy.
This detailed guide will walk you through the entire process, from understanding the core concepts to analyzing the final results. You will learn what makes backtesting a powerful tool, what you need to get started, the exact steps to follow, and which performance metrics truly matter when deciding if a strategy is ready for the live market.
What is Backtesting in Forex Trading?
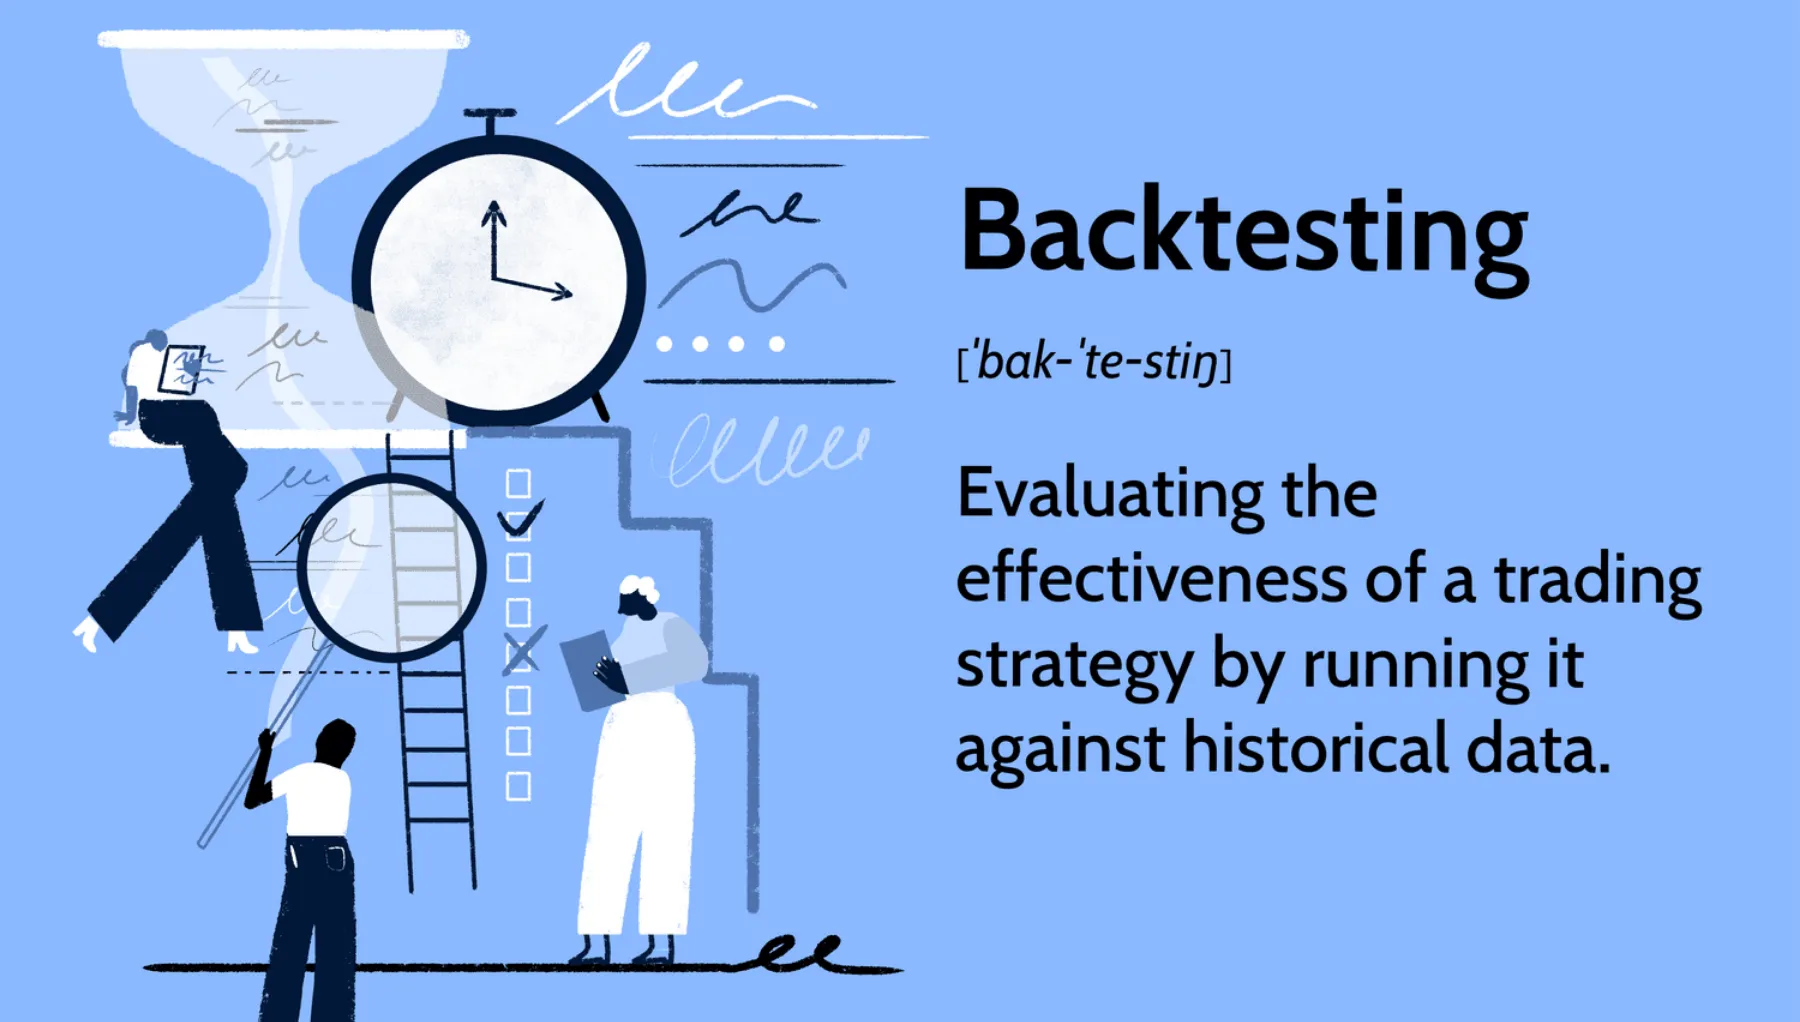
Backtesting is a simulation method where a trading strategy is applied to historical price data to assess its performance as if it had been traded live. To understand this better, it’s a way to travel back in time to see how your trading rules would have fared under past market conditions. The core idea is to gather statistical evidence about a strategy’s potential before you commit real capital. By simulating entries, exits, stop losses, and take profits over a large dataset of historical prices, you can generate a performance report that details key metrics like profitability, risk exposure, and consistency. This process can be done manually, where a trader scrolls through charts bar-by-bar, or automatically, using specialized software that can process years of data in minutes. Ultimately, backtesting is a trader’s laboratory, a controlled environment for testing hypotheses and refining ideas without financial consequence.
Why is Backtesting a Trading Strategy Important?
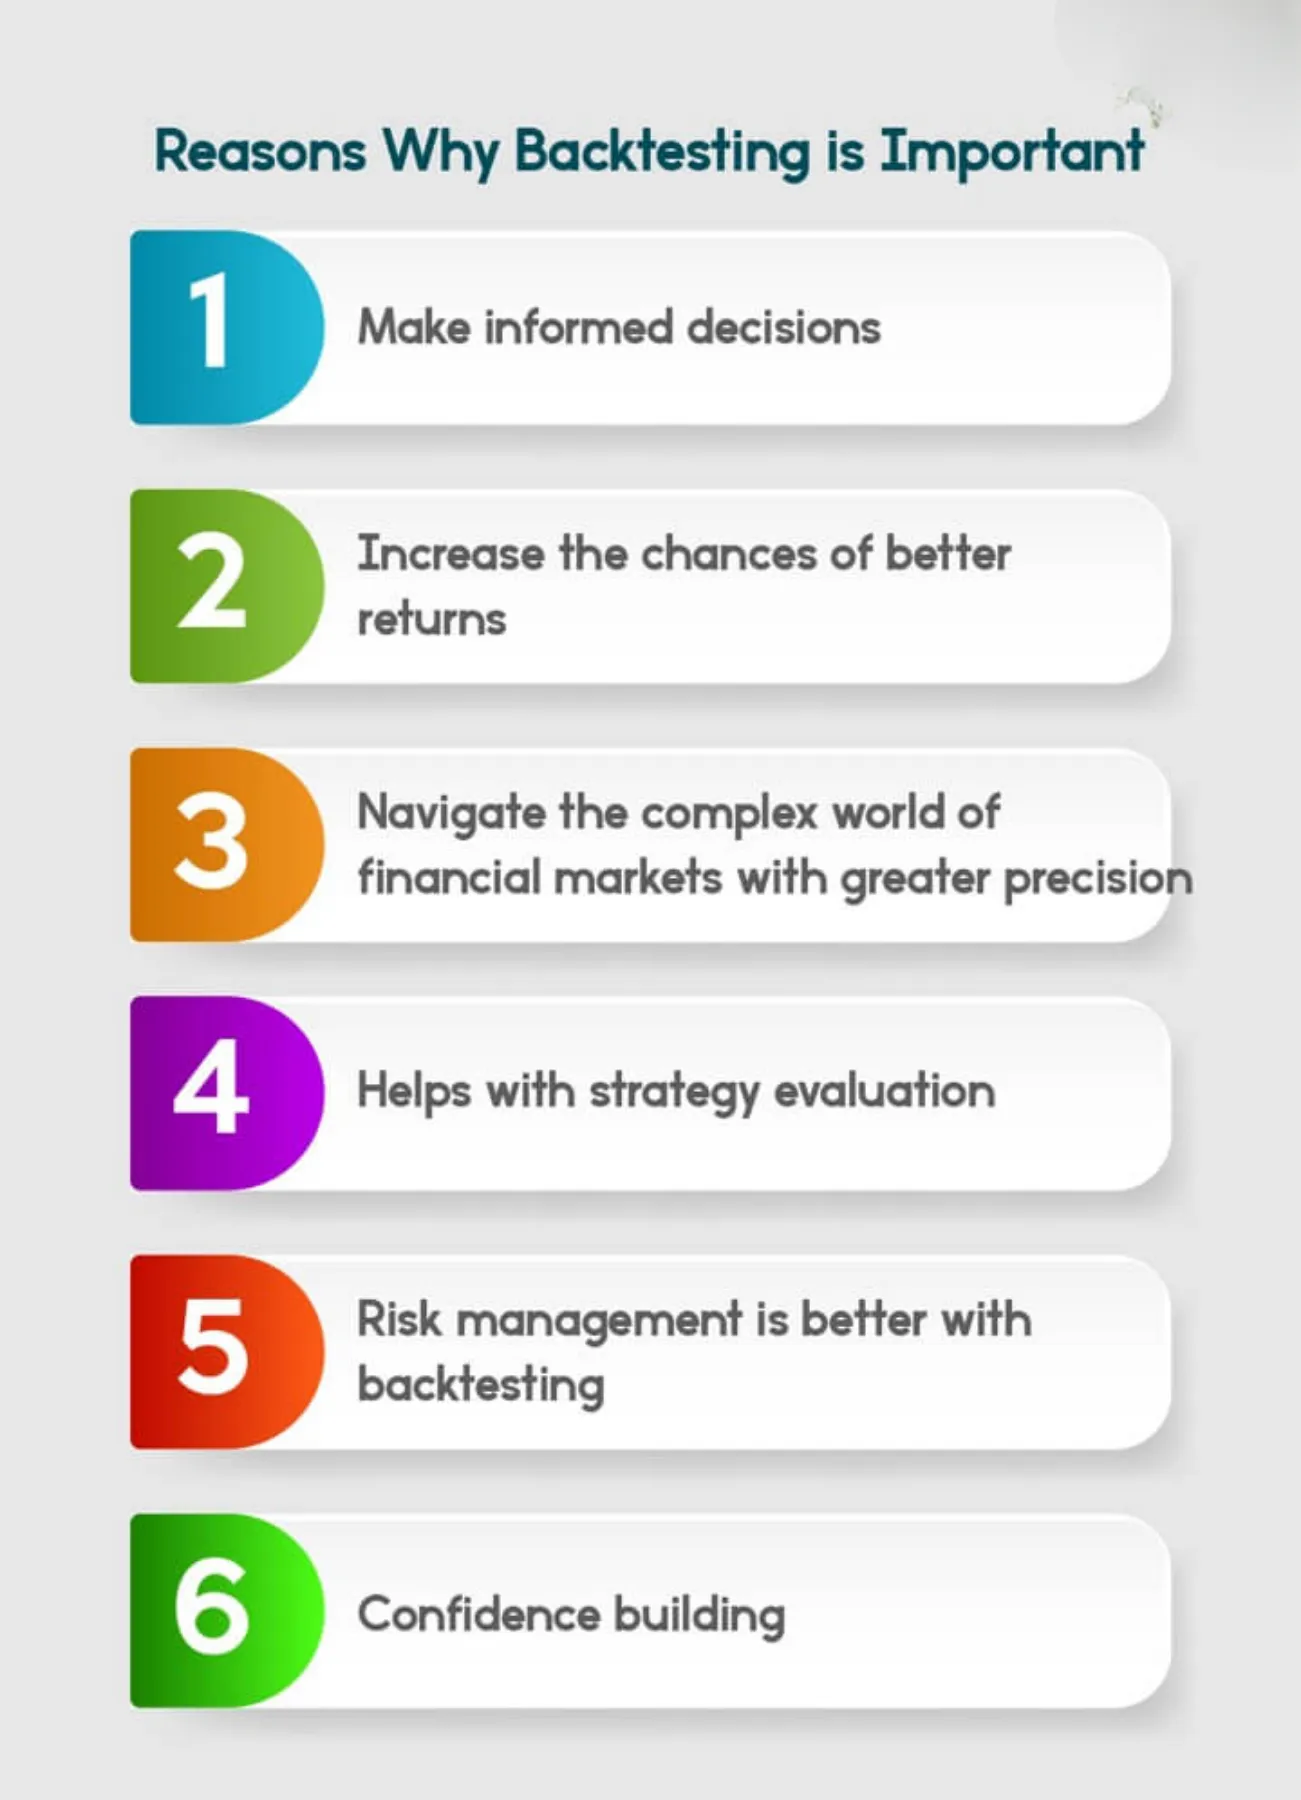
Backtesting is a foundational practice for serious traders because it provides objective insights into a strategy’s viability. Instead of hoping a strategy will work, you can collect data that shows you its historical performance, strengths, and weaknesses. This data-driven approach moves trading from a game of chance to a business of probabilities.
The primary benefits of backtesting include:
- Strategy Validation: It provides statistical proof of whether a trading idea has a positive expectancy. If a strategy fails to make a profit on historical data over a long period, it is highly unlikely to be profitable in live markets. This saves you from wasting time and money on flawed concepts.
- Risk Management: A thorough backtest reveals a strategy’s risk profile, most notably its maximum drawdown. This metric shows the largest peak-to-trough drop in account equity, helping you understand the potential losses you might endure. Knowing this allows you to set appropriate position sizes and determine if you can psychologically handle the strategy’s inevitable losing streaks.
- Identifying Flaws and Optimizing: The process often uncovers hidden weaknesses in a strategy. For example, you might discover your strategy performs poorly during certain market conditions, like low-volatility periods or major news events. This information allows you to add filters or adjust rules to improve its robustness before going live.
- Building Confidence: Executing a trading strategy in real-time requires discipline and conviction, especially during losing periods. Having backtested data that shows the strategy is profitable over the long term provides the confidence needed to stick to the plan and avoid making emotional decisions.
What are the Limitations of Backtesting?
While backtesting is an invaluable tool, it is not a perfect predictor of future results. It’s important to be aware of its inherent limitations to avoid a false sense of security. The most common disclaimer in finance, “past performance is not indicative of future results,” holds true here. Markets are dynamic and constantly evolving, meaning a strategy that worked well in the past may not perform the same way in the future.
Another major limitation is the accuracy of the simulation itself. Many backtests fail to account for real-world trading frictions that can eat into profits. For instance, slippage, which is the difference between the expected price of a trade and the price at which the trade is actually executed, is often ignored. This is especially true in fast-moving markets. Similarly, commission costs and swap fees, which are charged by brokers, can accumulate over time and turn a marginally profitable strategy into a losing one if not factored into the simulation. A backtest is only as good as the data and the assumptions it is built upon, so acknowledging these limitations is key to interpreting the results correctly.
What are the Core Components Needed for Backtesting?
The two essential components required for any backtest are a source of high-quality historical data and a set of clearly defined, objective trading strategy rules. Let’s explore these components, as a failure in either one will render your backtesting results meaningless. Think of them as the foundation of a house. If the data is flawed or the rules are vague, anything you build on top of them will be unstable and likely to collapse when put under real-world pressure. Getting these two elements right from the start is the most important part of the entire process, as they directly influence the reliability and accuracy of your final performance report. Without them, you are simply curve-fitting, or creating a strategy that looks good on paper but has no predictive power in live markets.
What is Quality Historical Data?
Quality historical data is the raw material of your backtest, and its accuracy is paramount. Poor data leads to unreliable results, a concept known in programming as “garbage in, garbage out.” High-quality data should be clean, accurate, and cover a long period that includes various market conditions like uptrends, downtrends, and sideways consolidations. Ideally, it should contain the open, high, low, and close (OHLC) prices for each time period, along with volume.

For forex traders, the gold standard is often considered tick data, which records every single price fluctuation. However, tick data files can be massive and computationally intensive to process. A more practical and widely used alternative is one-minute (M1) data. This data provides the OHLC for every minute, which is granular enough for most intraday and swing trading strategies. You can source historical data from several places. Many trading platforms, like MetaTrader 4, allow you to download it directly from your broker. For higher quality data, you can use third-party providers like TickData or DuoQu ECN, which specialize in providing clean, comprehensive datasets. The key is to ensure the data is free from gaps or errors, as these can significantly skew your backtesting results.
How Do You Define Specific Trading Strategy Rules?
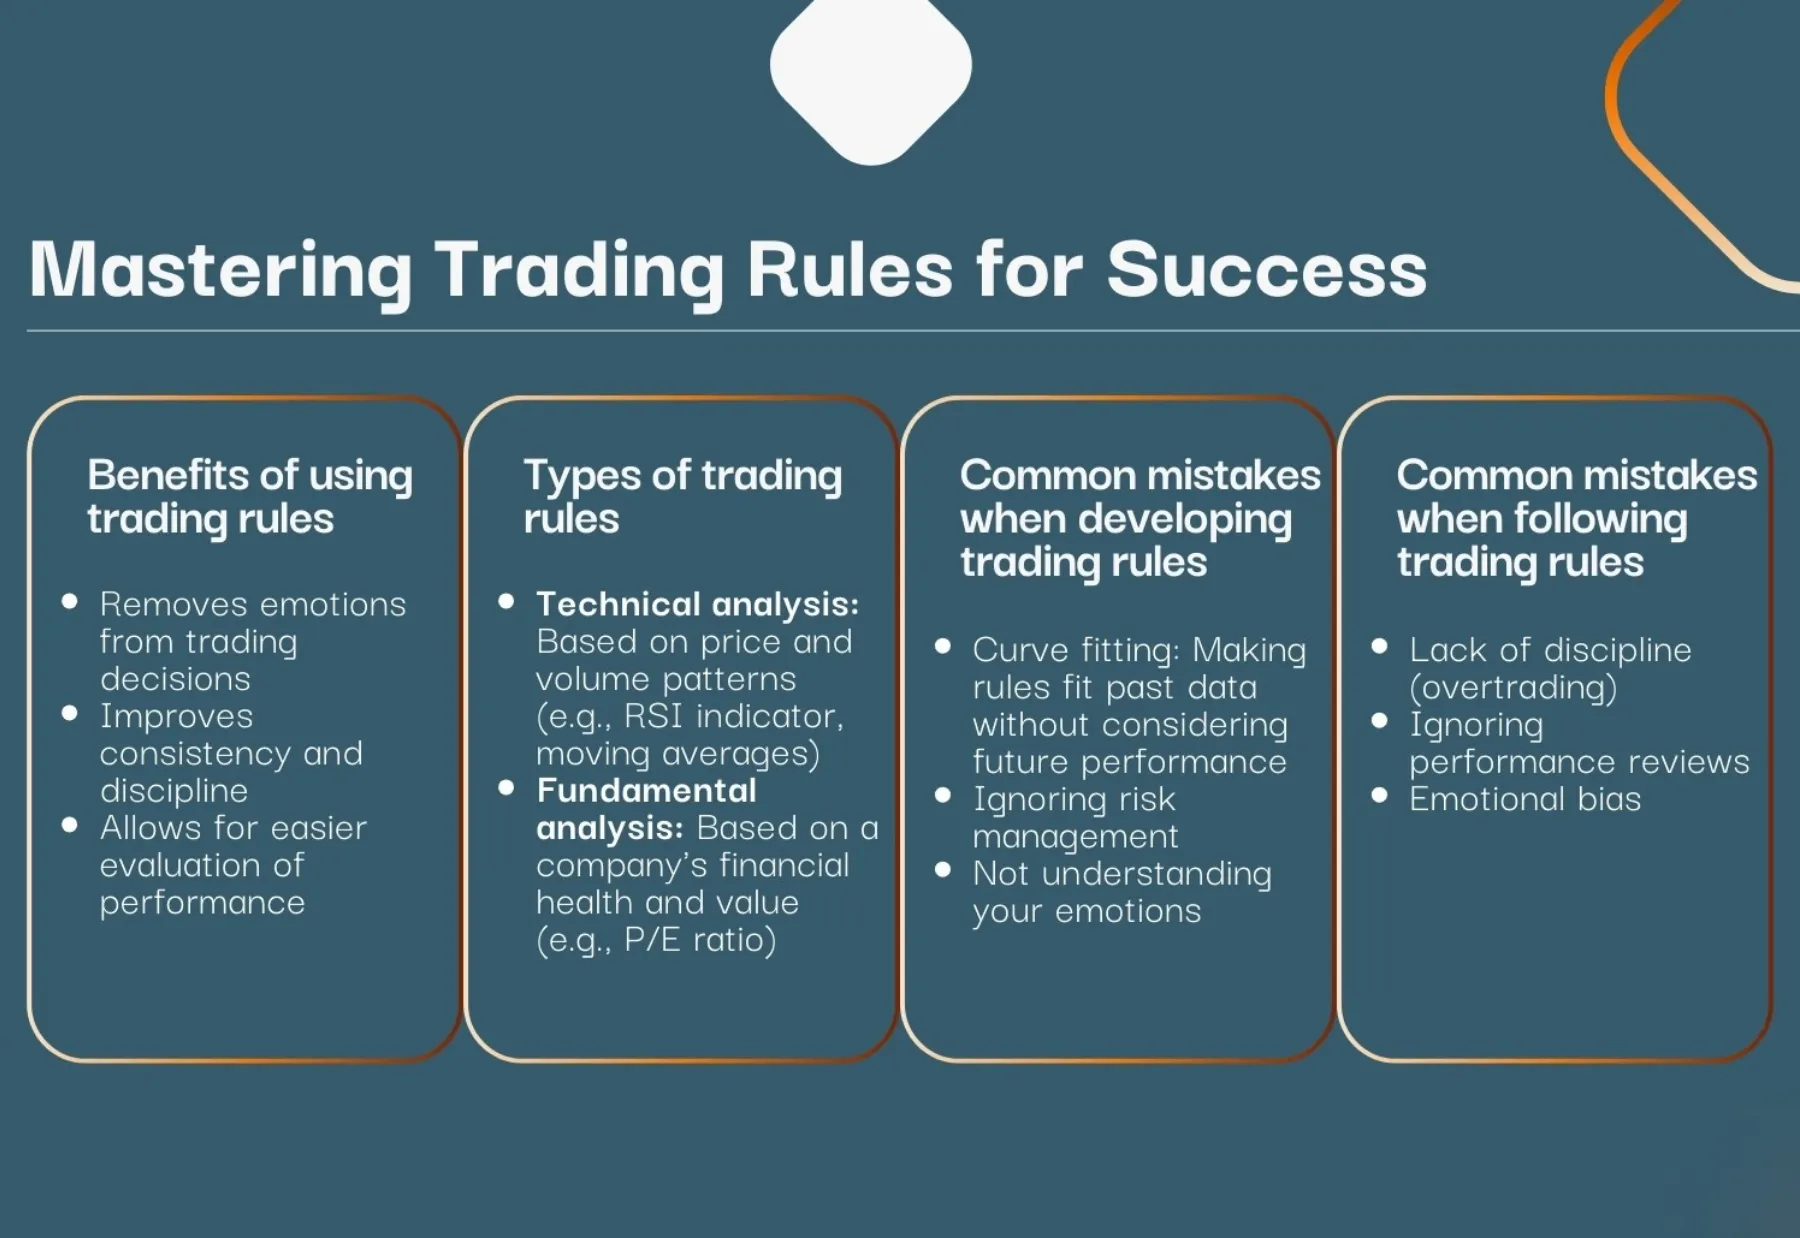
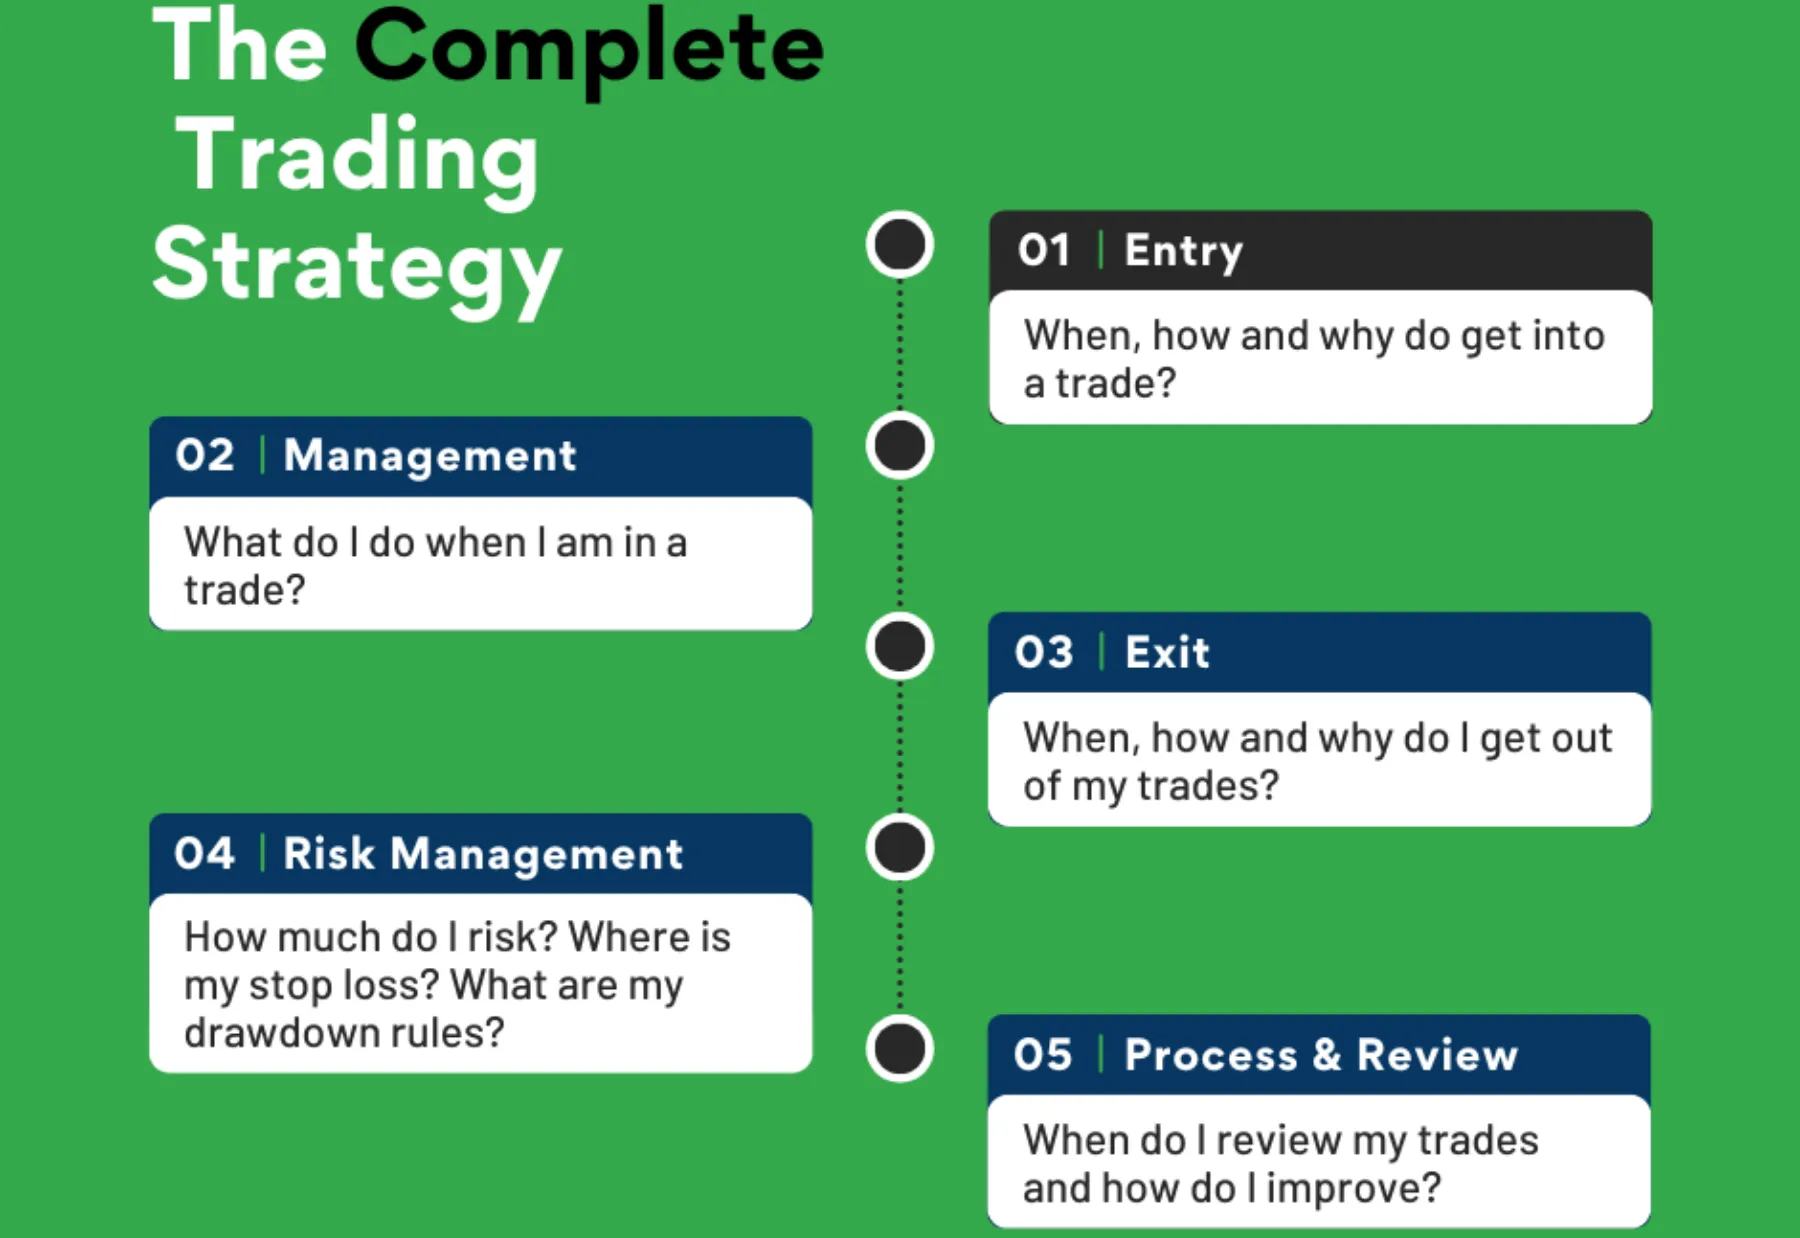
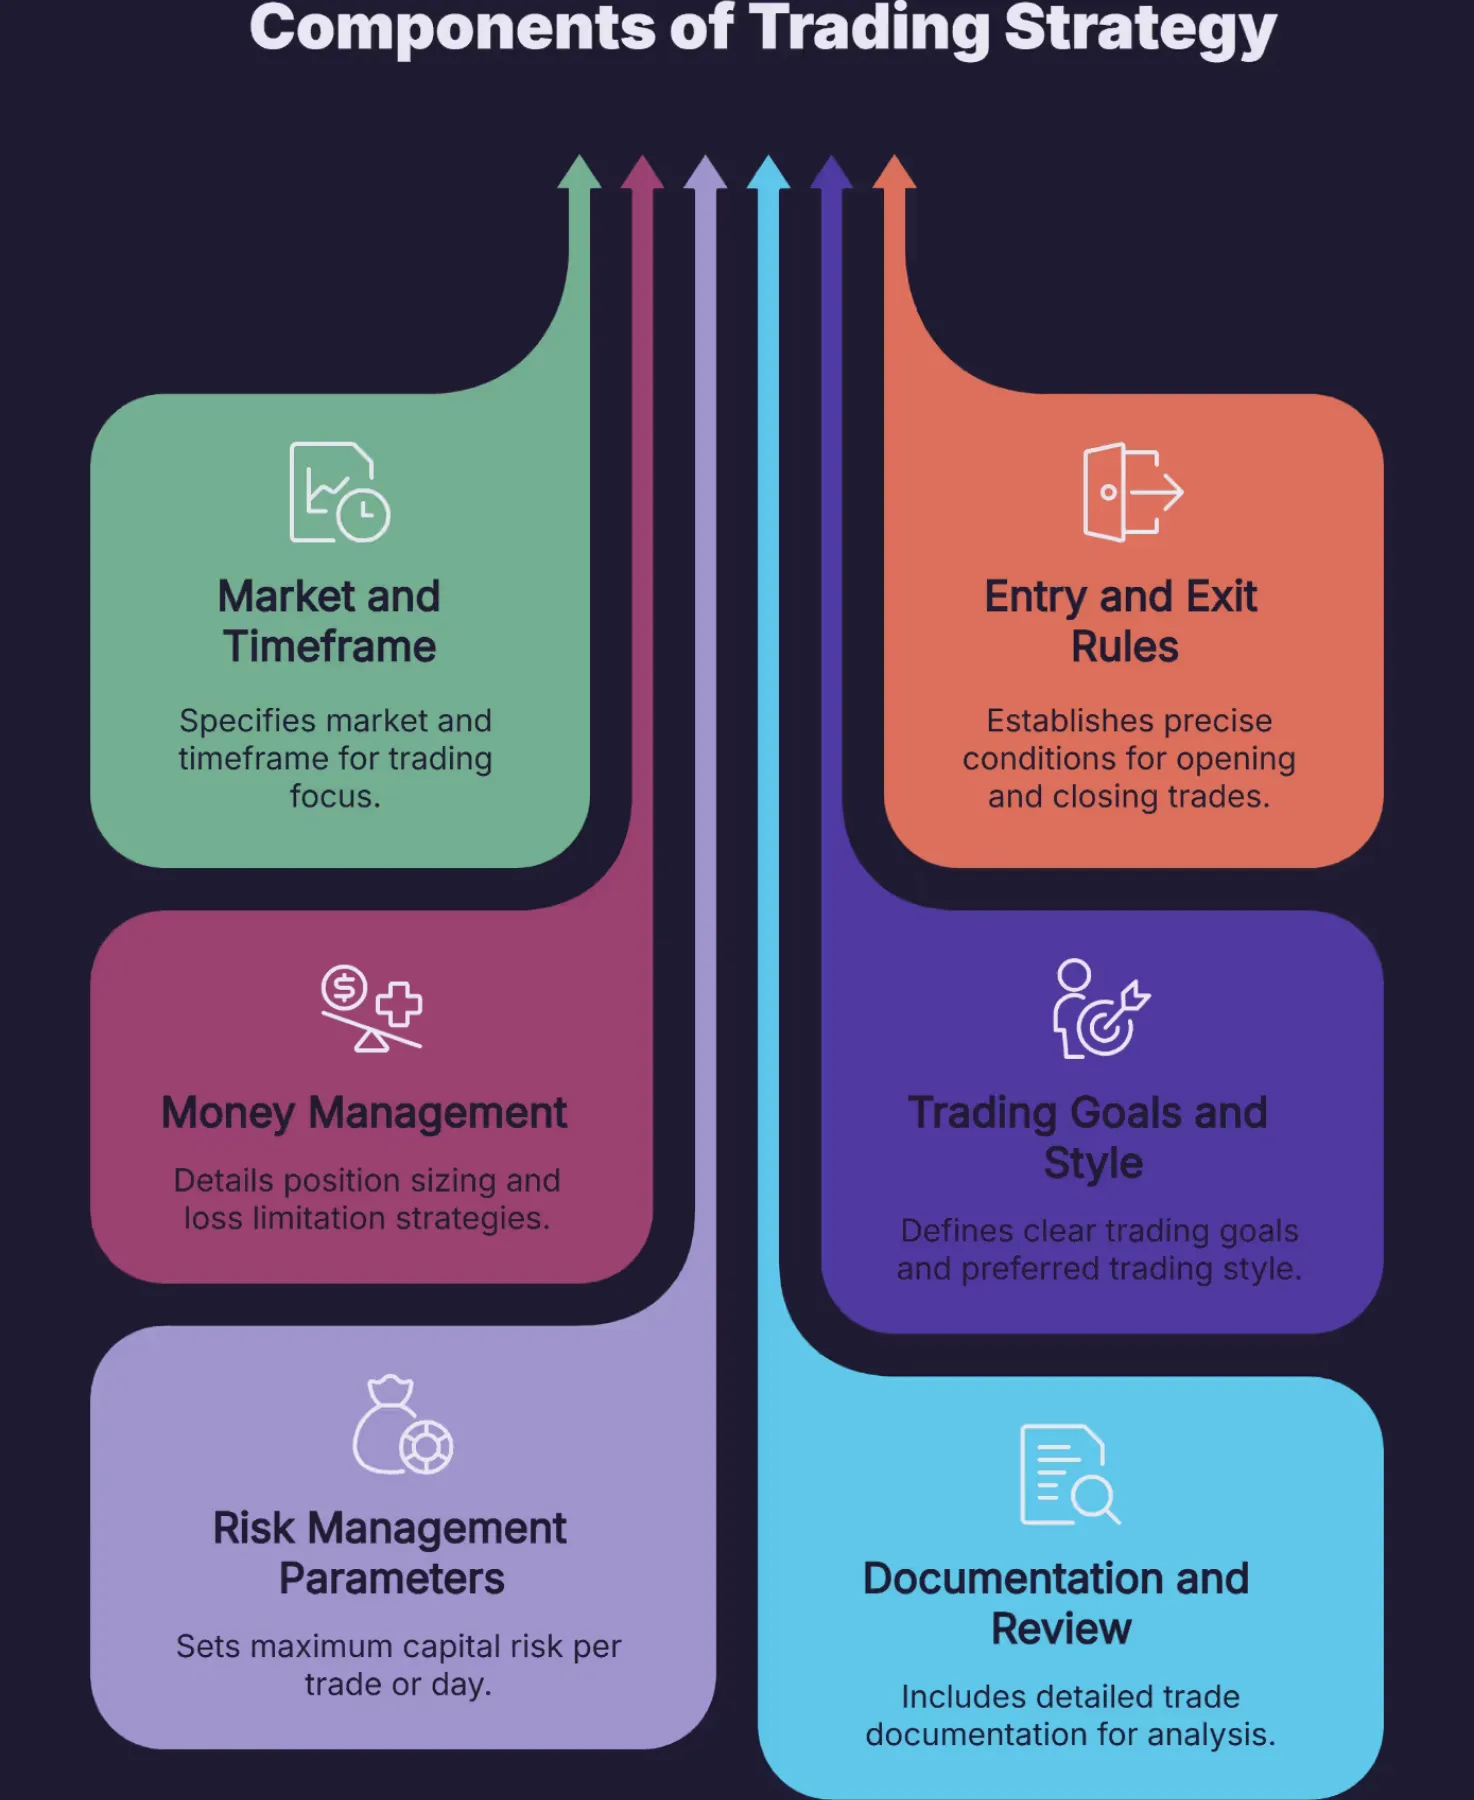
A backtestable trading strategy must be built on a set of explicit, mechanical rules that leave no room for subjective interpretation. If you have to ask, “Is this a valid signal?” during your test, your rules are not specific enough. Your strategy must be a complete system that dictates every action you take in the market. This means defining objective criteria for every part of a trade.
Your ruleset must clearly state the following:
- Entry Conditions: What exact market conditions must be met to open a trade? This should be based on specific indicator values, price patterns, or a combination of factors. For example, a rule could be: “Enter a long position when the 14-period Relative Strength Index (RSI) crosses above 30, and the 50-period Exponential Moving Average (EMA) is above the 200-period EMA.”
- Exit Conditions: What are the conditions for closing a profitable trade? This is your take-profit rule. It could be a fixed price target, a trailing stop, or an opposing signal from your entry indicators.
- Stop-Loss Placement: Where will you place your initial stop-loss order to define your maximum acceptable loss on the trade? This could be a fixed number of pips, a percentage of your account, or based on a technical level like the most recent swing low.
- Position Sizing: How much capital will you risk on each trade? This rule determines how many lots to trade and is a critical part of risk management.
By defining these rules with absolute clarity, you create a system that can be tested consistently and objectively across any dataset.
What are the Steps to Backtest a Forex Strategy?
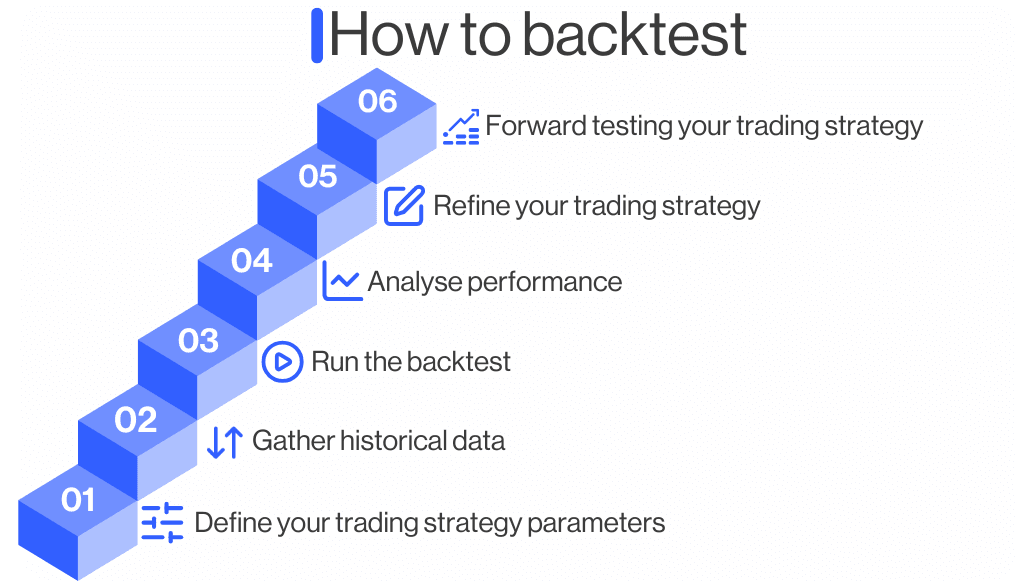
The method for backtesting a forex strategy is a four-step process that moves from preparation to analysis for a data-driven outcome. Here’s the breakdown of how to properly test your trading idea from beginning to end. This structured approach ensures that you cover all the necessary bases, from preparing your tools and data to systematically applying your rules and, finally, making sense of the results. By following these steps in order, you can conduct a thorough and organized evaluation of your strategy’s historical performance. Each step builds upon the last, creating a comprehensive picture of how your rules would have performed in the past, giving you valuable insight into its potential future viability.
Step 1: How Do You Set Up Your Backtesting Environment?
The first step is preparing your workspace and tools. This involves selecting a backtesting platform, loading your historical data, and defining the parameters of your test. Your choice of platform will depend on your technical skill and the complexity of your strategy. For many traders, platforms like MetaTrader 4 (MT4) or TradingView are excellent starting points. MT4 has a built-in “Strategy Tester” that allows for automated backtesting using Expert Advisors (EAs). TradingView offers a “Bar Replay” feature that lets you go back in time and manually step through historical data one candle at a time, which is perfect for practicing manual execution.
Once you’ve chosen your platform, you need to load the historical data for the currency pair you want to test. For instance, if your strategy is for EUR/USD, you’ll need to source and import the M1 or tick data for that pair. Finally, you must define the scope of your test. This includes selecting the timeframe (e.g., H1, H4, D1) your strategy operates on and the period you want to test over. A good rule of thumb is to test over at least a few years of data to ensure your strategy is exposed to different market environments, such as trending, ranging, and high-volatility periods.
Step 2: How Do You Apply Your Strategy Rules to the Data?
With your environment set up, you can now begin the actual simulation. This step involves methodically going through your historical data and applying your predefined trading rules. If you are doing a manual backtest, you will move forward one candle at a time. Every time a new candle forms, you will check your entry conditions. Do you see a valid setup to buy or sell according to your rules? If not, you move to the next candle.
If your entry conditions are met, you simulate opening a trade. You record the entry price and then continue moving forward, candle by candle. Now, you will be checking for your exit conditions. Did the price hit your predefined stop-loss level? Did it reach your take-profit target? Or did an exit signal appear? When one of these conditions is met, you simulate closing the trade and record the outcome. This process is repeated over the entire historical dataset, from the start date to the end date. For automated backtesting, the software does this work for you, executing trades based on the code you’ve written, which makes the process much faster.
Step 3: How Do You Record Every Simulated Trade?
Meticulous record-keeping is the backbone of a useful backtest. Without a detailed log of every simulated trade, you won’t be able to properly analyze the performance. Whether you are backtesting manually or automatically, every single trade must be logged. A simple spreadsheet is often the best tool for this job.
For each trade, you should record the following information:
- Date and Time of Entry: When the trade was initiated.
- Currency Pair: The instrument traded, e.g., GBP/JPY.
- Direction: Whether it was a long (buy) or short (sell) trade.
- Entry Price: The price at which the position was opened.
- Exit Price: The price at which the position was closed.
- Stop-Loss Level: The initial stop-loss price.
- Take-Profit Level: The initial take-profit price.
- Profit/Loss (P/L): The outcome of the trade, recorded in pips and currency value.
- Reason for Exit: Was the trade closed by the stop-loss, take-profit, or another exit signal?
Keeping this detailed log allows you to not only calculate overall performance but also to dive deeper into specific aspects of the strategy, like how it performs on certain days of the week or during specific trading sessions.
Step 4: How Do You Analyze the Final Performance Report?
After you have completed the simulation and logged every trade, the final step is to analyze the data you’ve collected. This is where you transform your raw trade log into actionable insights about your strategy’s performance. You will use the data in your spreadsheet to calculate several key performance metrics that tell the story of your strategy.
You’ll start by calculating the total net profit or loss over the entire testing period. But profitability is just one piece of the puzzle. You also need to understand the risk involved. You’ll calculate the maximum drawdown, which shows you the biggest loss your account experienced. You’ll look at the win rate and the average risk-to-reward ratio to understand the relationship between how often you win and how much you win. Other important metrics include the profit factor and the total number of trades. By compiling and reviewing these statistics, you can make an objective, data-driven decision about whether the strategy meets your personal risk tolerance and profitability goals.
What are the Most Important Backtesting Metrics to Analyze?
The most important backtesting metrics to analyze are Total Net Profit, Profit Factor, Maximum Drawdown, Win Rate, and the Average Risk-to-Reward Ratio. In detail, these key performance indicators (KPIs) provide a complete picture of a strategy’s historical profitability, risk exposure, and overall efficiency. Looking at just one metric, like net profit, can be misleading. A strategy might be profitable but have a terrifyingly large drawdown that would be impossible to endure emotionally in live trading. By evaluating a balanced set of metrics, you can get a holistic view of the strategy’s behavior and decide if it aligns with your trading goals and risk tolerance. These numbers move you beyond a simple “did it make money?” question to a more sophisticated understanding of how it made money and at what cost.
What are Total Net Profit and Profit Factor?
Total Net Profit is the most straightforward metric. It is calculated by subtracting the total losses from the total profits over the entire backtesting period (Net Profit = Gross Profit – Gross Loss). While it tells you the bottom-line result, it doesn’t provide much context on its own. A strategy that made $10,000 with a 70% drawdown is very different from one that made the same amount with only a 10% drawdown.
This is where Profit Factor becomes incredibly useful. It measures the efficiency of the strategy by showing how many dollars you are likely to make for every dollar you risk. The formula is Profit Factor = Gross Profit / Gross Loss. A Profit Factor of 1.0 means the strategy broke even. A value below 1.0 indicates a losing strategy. Generally, traders look for a Profit Factor of 1.5 or higher, as this suggests a healthy cushion to absorb real-world trading costs like slippage and commissions. For example, a Profit Factor of 2.0 means the strategy historically made $2 for every $1 it lost, indicating a strong positive expectancy.
What is Maximum Drawdown?
Maximum Drawdown is arguably the most important risk metric derived from a backtest. It represents the largest percentage decline in your account equity from a peak to a subsequent trough. For instance, if your account grew to $12,000 and then fell to $9,000 before rising again, your drawdown would be $3,000, or 25% of the peak equity.
Why is this so important? Because it gives you a realistic expectation of the worst-case losing streak your strategy has experienced historically. This number is a powerful indicator of the psychological pressure you might face when trading the system live. If a strategy has a 50% maximum drawdown, you must ask yourself: “Could I continue to follow the rules without panic if my account balance was cut in half?” For many traders, the answer is no. Understanding the maximum drawdown helps you match a strategy to your personal risk tolerance and helps you set appropriate position sizes to ensure that a similar drawdown in the future would not wipe out your account.
What are Win Rate and the Average Risk-to-Reward Ratio?
Win Rate and the Average Risk-to-Reward (R:R) Ratio are two metrics that must be analyzed together because they are intrinsically linked. The Win Rate is the percentage of total trades that were profitable. For example, if you had 60 winning trades out of 100 total trades, your win rate would be 60%. While a high win rate feels good, it doesn’t guarantee profitability.
The Average Risk-to-Reward Ratio compares the size of your average winning trade to the size of your average losing trade. If your average winner is $300 and your average loser is $100, your R:R ratio is 3:1. A strategy can be highly profitable with a very low win rate if it has a high R:R ratio. For instance, a trend-following strategy might only win 35% of its trades. However, if its average winning trade is five times larger than its average losing trade (a 5:1 R:R), it can be extremely profitable over the long run. Conversely, a strategy with a high win rate of 80% could still lose money if its R:R ratio is poor, such as 1:5, where small wins are wiped out by infrequent but very large losses.
What are the Different Methods and Advanced Concepts in Backtesting?
Backtesting involves various methods, from manual to automated, and includes advanced concepts like forward testing and optimization, each with unique purposes and pitfalls to avoid. Furthermore, understanding these distinctions is essential for validating a trading strategy properly and avoiding common errors that can lead to misleading results.
What is the Difference Between Manual and Automated Backtesting?
The primary difference between manual and automated backtesting lies in execution and scalability. Manual backtesting involves a trader scrolling through historical price charts bar by bar, identifying trade setups according to their strategy’s rules, and recording the results in a spreadsheet. This method is slow and labor-intensive but offers a deep, intuitive understanding of how a strategy behaves in different market conditions. You get to feel the market’s rhythm and see your setups unfold visually.
In contrast, automated backtesting uses specialized software or custom scripts, such as Expert Advisors (EAs) on the MetaTrader 4 or 5 platform, to run a strategy’s rules against years of historical data in minutes. This approach is fast, statistically rigorous, and removes the risk of human error or emotional bias in trade execution. Its main advantage is the ability to test a strategy across multiple currency pairs and timeframes quickly. The downside is that it requires programming knowledge or the use of pre-built software, and poorly coded logic can produce flawed results.
A trader’s choice between the two often depends on their goals and resources.
- Manual Backtesting: Best for discretionary traders who want to build screen time and develop a feel for their strategy.
- Automated Backtesting: Ideal for systematic traders who need to analyze large datasets and test complex, purely mechanical strategies without ambiguity.
- Accuracy: Automated testing is generally more accurate, as it eliminates subjective decision making and calculation mistakes common in manual logging.
What are Common Backtesting Mistakes to Avoid?
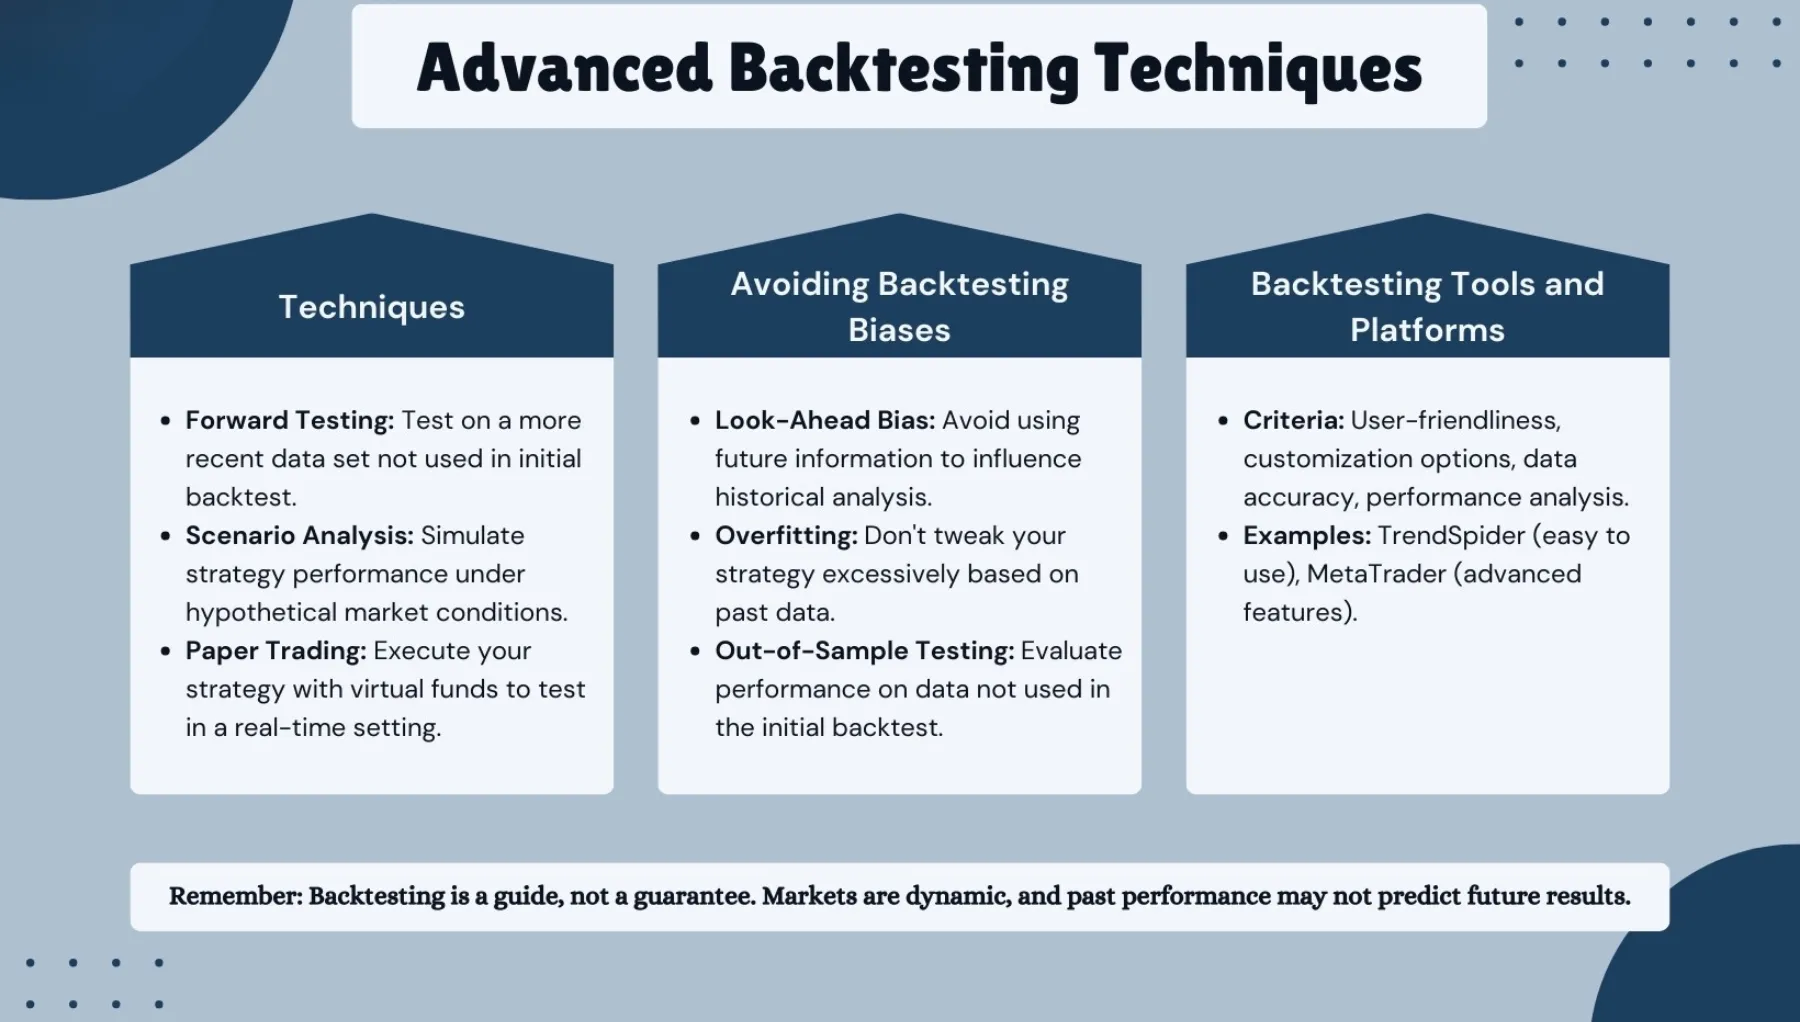
Avoiding common mistakes is just as important as having a good strategy, as these errors can make a losing system appear profitable. Awareness of these pitfalls allows you to create a more realistic and reliable evaluation of your trading strategy’s potential performance. Three of the most frequent and damaging mistakes are overfitting, lookahead bias, and ignoring trading costs.

These errors can invalidate your results and give you false confidence.
- Overfitting: This occurs when a strategy’s parameters are tuned so perfectly to historical data that it performs exceptionally well in the backtest but fails in a live market. The strategy learns the data’s noise instead of its underlying pattern. To avoid this, keep your rules simple and test the strategy on out-of-sample data, which is a period of history the strategy was not developed on.
- Lookahead Bias: This is a subtle error where the backtesting model uses information that would not have been available at the time of the trade. For example, using a day’s closing price to make an entry decision in the middle of that same day is impossible in real trading. You must ensure your code or manual process only uses data available at the moment a decision is made.
- Ignoring Trading Costs: Many backtests fail to account for real-world costs like spreads, commissions, and slippage. A strategy that appears profitable might actually lose money once these expenses are factored in. Always include a realistic estimate for these costs in your calculations to get a true picture of potential profitability.
What is the Difference Between Backtesting and Forward Testing?
While both are methods for strategy validation, backtesting and forward testing operate at different stages and use different types of market data. Backtesting is a historical simulation. It answers the question, “How would my strategy have performed in the past?” It uses historical price data to run a predefined set of trading rules, providing performance metrics like win rate, profit factor, and maximum drawdown based on past market conditions. It is the first step in the validation process.

Forward testing, also known as paper trading, is the next logical step. It involves trading your strategy in a live market simulation using a demo account, without risking real capital. It answers the question, “How is my strategy performing in current market conditions?” This process helps confirm the results from the backtest and reveals how the strategy handles real-time factors like changing volatility, news events, and broker execution which are not always perfectly captured in historical data. A strategy should perform well in both tests before you consider trading it with real money.
The progression from one to the other is a critical part of the development process.
- Backtesting: A retrospective analysis on a static, historical dataset.
- Forward Testing: A prospective analysis on a dynamic, live market data stream.
- Purpose: Backtesting validates the core logic of a strategy, while forward testing validates its practical application in the present.
How Does Backtesting Differ from Strategy Optimization?
Backtesting and strategy optimization are related but serve two distinct functions. Backtesting is a process of validation. You take a strategy with a fixed, unchangeable set of rules and parameters and run it against historical data to measure its performance. For example, you might test a moving average crossover strategy using a 50-period and a 200-period moving average. The goal is simply to see if that specific configuration was profitable.
Strategy optimization, on the other hand, is a process of discovery. It involves systematically altering a strategy’s parameters to find the combination that yields the best results on historical data. Using the same example, an optimization process would test hundreds of different moving average combinations, perhaps from 10 to 100 for the short-term average and 100 to 300 for the long-term average, to identify the most profitable pair. The primary goal is to improve the strategy, not just validate it. However, this process carries a significant risk of overfitting, where the “optimized” parameters are so specific to the past data that they fail to adapt to future market behavior.
The key distinction lies in their intent.
- Backtesting: Aims to answer, “Does this specific strategy work?”
- Optimization: Aims to answer, “What is the best possible version of this strategy?”
- Caution: While optimization can help refine a strategy, it must be followed by rigorous testing on out-of-sample data to ensure the results are robust and not just a product of curve-fitting.
Can You Backtest on Different Timeframes?
Yes, and testing a strategy on different timeframes is a crucial step for checking its robustness and versatility. A trading strategy might appear highly profitable on a specific timeframe, like the 1-hour chart, but fail completely on a 15-minute or 4-hour chart. This often indicates that the strategy’s logic is fragile and heavily dependent on the unique characteristics of that single timeframe, rather than on a durable market principle. A robust strategy should show some degree of positive performance, or at least not fail catastrophically, when applied across multiple related timeframes.

For instance, a trend-following strategy might perform well on a daily chart, where trends are clearer, but generate numerous false signals and losses on a 15-minute chart due to market noise. Conversely, a scalping strategy designed for the 5-minute chart would likely be ineffective on a weekly chart. Testing across timeframes helps you understand the conditions under which your strategy thrives and where it struggles. It also helps prevent overfitting to a single chart’s historical behavior. If the core logic is sound, it should hold up under slightly different market dynamics.
This process provides deeper insights into your strategy’s character.
- Robustness Check: It confirms if the strategy’s edge is genuine or just an accident of a specific dataset.
- Versatility Assessment: It reveals how the strategy adapts to faster or slower market movements.
- Parameter Tuning: Results from different timeframes can help you understand which parameters, like stop-loss or take-profit levels, may need to be adjusted for different market speeds.