

Blog
How to Identify Forex Chart Trends Using Technical Analysis?

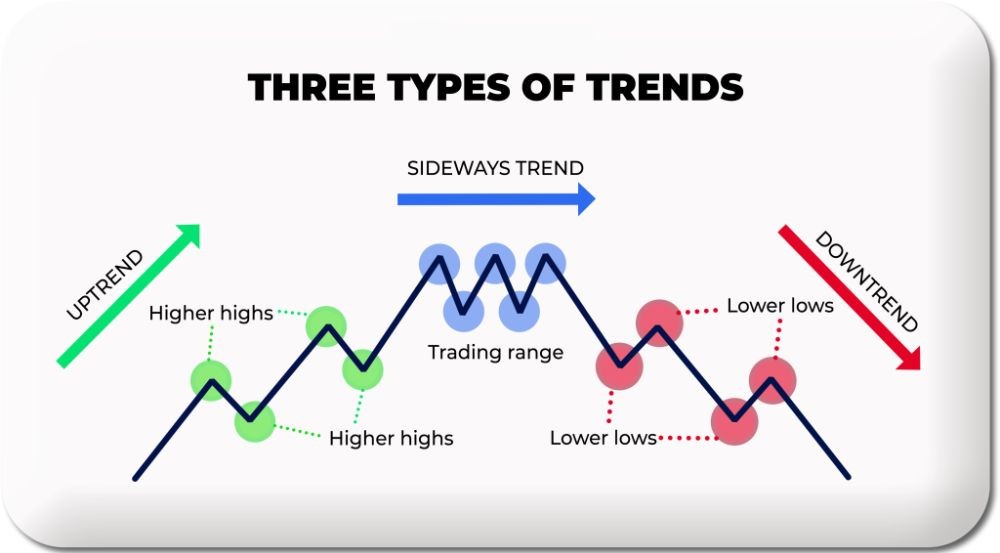
Identifying forex chart trends using technical analysis involves a combination of visual and indicator-based methods to determine the market’s directional momentum. The most effective ways to identify trends are by drawing trend lines to define price boundaries, analyzing market structure through swing highs and lows, and applying moving averages to smooth price data. These techniques help traders align their strategies with the dominant market direction, whether it’s an uptrend, downtrend, or a sideways range. By mastering these core skills, you can better interpret price action and make more informed trading decisions.
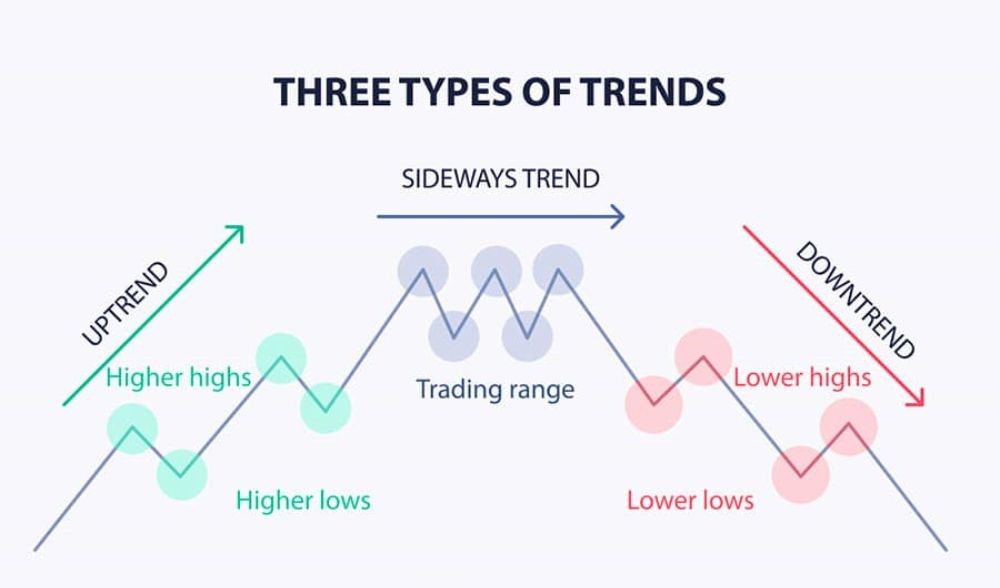
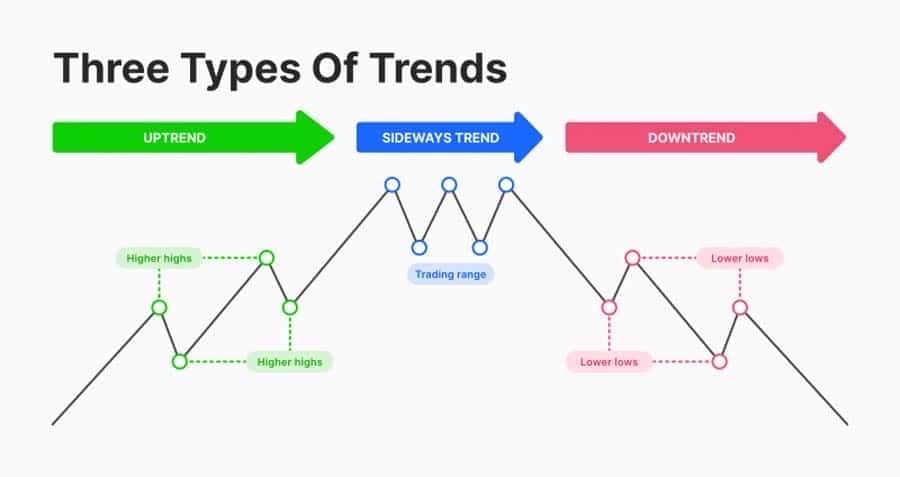
The three primary types of trends you will encounter in the forex market are categorized by their direction. These trends are the uptrend (bullish), characterized by a series of higher highs and higher lows; the downtrend (bearish), defined by lower highs and lower lows; and the sideways trend (ranging), where price moves horizontally between clear support and resistance levels. Recognizing which of these patterns is active on a chart is the first step toward building a trading plan that harmonizes with current market sentiment.
Grasping the prevailing trend is a foundational element of successful trading because it provides context for all price movements. Trading with the trend, a strategy known as trend following, allows you to capitalize on the market’s primary momentum, which generally increases the probability of a positive outcome for your trades. Attempting to trade against a strong trend without a clear strategy often leads to losses, as you are fighting against the collective force of market participants.
This guide will break down the most reliable technical analysis methods for trend identification. We will explore how to properly draw trend lines, interpret market structure, and use moving averages to confirm directional bias. Each method offers a unique perspective on price action, and when used together, they create a powerful framework for analyzing forex charts.
What is a Trend in Forex Trading?
A trend in forex trading is the overall directional movement of a currency pair’s price over a given period, which can be upward, downward, or sideways. To put it simply, a trend tells you whether the market is generally getting more expensive, cheaper, or staying within a consistent price range. For traders, the trend is the most important piece of information on a chart. The old saying, “the trend is your friend,” exists for a reason; aligning your trades with the dominant trend is one of the most fundamental principles of profitable trading. It represents the path of least resistance. When a currency pair is in a clear trend, its momentum is more predictable, offering opportunities to enter trades that have a higher likelihood of moving in your favor. Ignoring the trend is like trying to swim against a strong current, it’s possible but requires much more effort and carries a higher risk. Understanding the trend gives you a clear bias, helping you decide whether you should be looking for buying opportunities (in an uptrend) or selling opportunities (in a downtrend).
What are the Three Main Types of Forex Trends?
There are three main types of trends you will see on a forex chart: the uptrend, the downtrend, and the sideways trend.
An uptrend, also called a bullish trend, occurs when the price of a currency pair is consistently moving higher. You can identify it visually by looking for a series of “higher highs” and “higher lows.” This means that each new price peak is higher than the one before it, and each pullback or dip finds support at a level higher than the previous one. This creates a stair-step pattern moving upward. For example, if EUR/USD moves from 1.0800 to 1.0900 (a new high), then pulls back to 1.0850 (a higher low), and then rallies to 1.0950 (another higher high), it is in a clear uptrend. In this scenario, traders are generally optimistic, and buying pressure outweighs selling pressure.
A downtrend, or bearish trend, is the exact opposite. It happens when the price is consistently moving lower. This is characterized by a series of “lower highs” and “lower lows.” Each new price peak is lower than the previous one, and each rally fails at a resistance level that is lower than the last. Visually, this looks like a stair-step pattern moving downward. For instance, if GBP/USD drops from 1.2500 to 1.2400 (a new low), rallies to 1.2450 (a lower high), and then falls to 1.2350 (another lower low), the pair is in a downtrend. Here, sentiment is pessimistic, and selling pressure is stronger than buying pressure.
A sideways trend, also known as a ranging or consolidation phase, occurs when there is no clear directional bias. The price moves horizontally between a relatively stable upper boundary (resistance) and a lower boundary (support). In this phase, neither buyers nor sellers are in control, and the market is often described as being in equilibrium. This can happen after a strong trend as the market takes a pause, or it can occur during periods of low volatility and market uncertainty. Traders often use different strategies in a ranging market, such as buying near support and selling near resistance, or waiting for a “breakout” where the price moves decisively above resistance or below support, potentially starting a new trend.
How Long Does a Forex Trend Last?
The duration of a forex trend is not fixed and is typically categorized into three main timeframes: primary, secondary, and minor.
The primary trend, also known as the long-term trend, is the major directional movement that can last from several months to several years. This is the overarching “tide” of the market. For example, a multi-year bull market in the USD/JPY pair, driven by fundamental factors like interest rate differentials, would be considered a primary uptrend. These trends are most relevant to position traders and long-term investors who are less concerned with daily price fluctuations and more focused on the big picture. Identifying the primary trend provides the ultimate context for all shorter-term price movements.
The secondary trend, or medium-term trend, moves within the primary trend and typically lasts from a few weeks to several months. These are often corrective moves or pullbacks against the primary trend. For instance, within a primary uptrend, a secondary trend might be a downward correction that lasts for two months before the primary uptrend resumes. These trends are of particular interest to swing traders who look to hold positions for days or weeks to capture these medium-sized price swings. A secondary trend can be a profitable counter-trend move or an opportunity to enter a trade in the direction of the primary trend at a more favorable price.
The minor trend, or short-term trend, lasts from a few days to a few weeks. These are the smallest and often most volatile price movements, representing the daily fluctuations or “ripples” in the market. A minor trend could be a small rally that lasts for three days within a secondary downtrend, which itself is part of a primary uptrend. Day traders and scalpers focus almost exclusively on these minor trends, looking to profit from very short-term price changes. It is important to remember that these smaller trends are always part of a larger trend, and what appears to be a strong minor trend could simply be noise within the context of the primary market direction.
How Do You Use Trend Lines to Identify Trends?
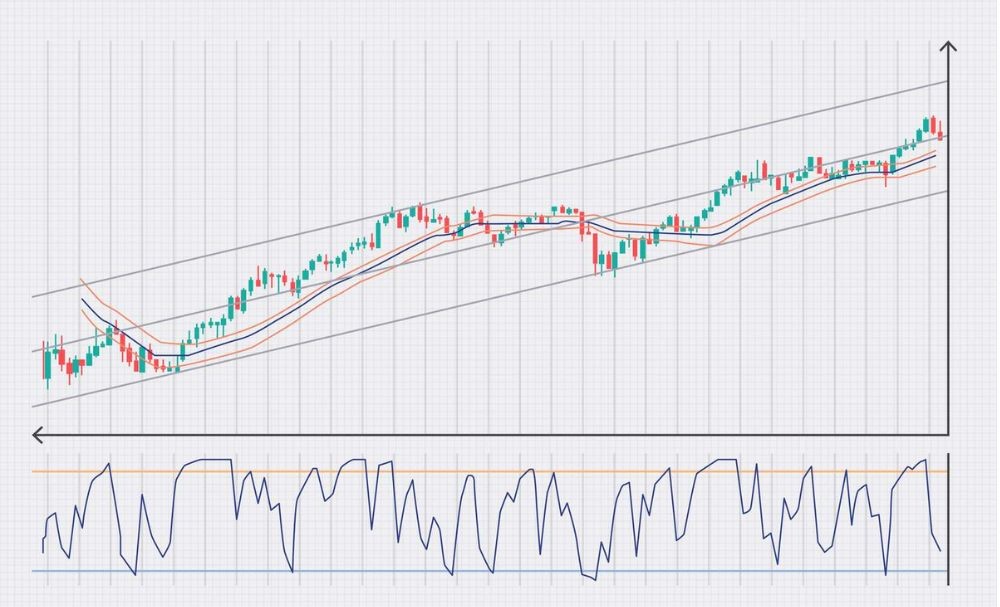
You use trend lines to identify trends by visually connecting significant price points on a chart to create a simple, clear boundary for price action. This fundamental tool helps you see the slope and direction of a trend and also acts as a dynamic level of support or resistance. By drawing a line that follows the flow of the market, you can quickly determine whether buyers or sellers are in control and anticipate where the price might react in the future. Trend lines are one of the most basic yet powerful tools in technical analysis because they provide a straightforward visual reference for the market’s current state. Whether the line is ascending, descending, or horizontal, it offers immediate insight into the trend’s strength, direction, and potential reversal points.
Let’s explore this further. A trend line is essentially a manually drawn line on a chart that connects a series of highs or lows. Its purpose is to show the prevailing direction of price and to identify potential areas where the price might bounce or reverse. For an uptrend, the line is drawn below the price, connecting the swing lows. For a downtrend, it is drawn above the price, connecting the swing highs. The angle or slope of the trend line can also give you clues about the trend’s momentum. A steeper trend line suggests strong momentum, while a flatter trend line indicates weaker momentum. When the price respects a trend line by bouncing off it multiple times, the trend line is considered valid and strong. A decisive break of a valid trend line is often one of the earliest signals that the current trend may be ending and a reversal could be underway.
How Do You Draw an Uptrend Line?
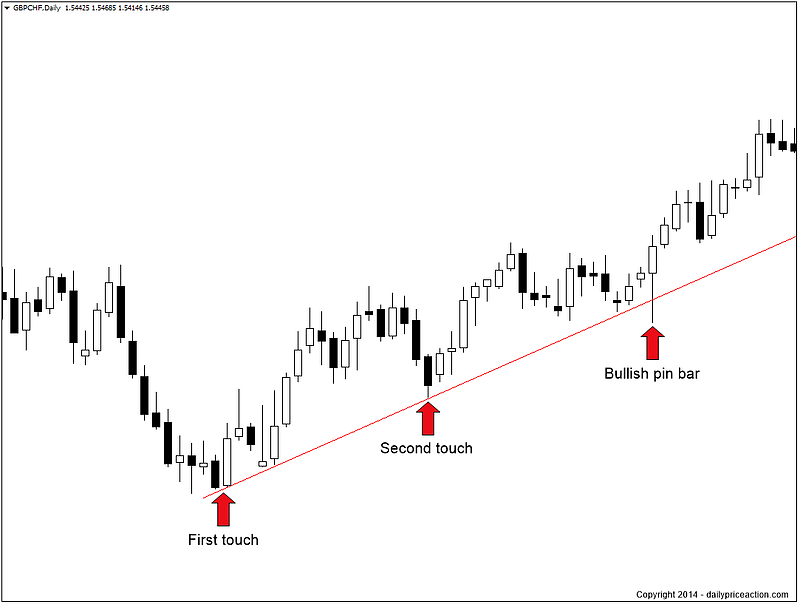
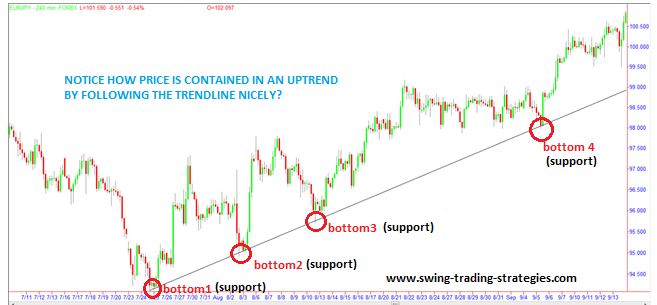
To draw an uptrend line, you must first identify a market that is making higher highs and higher lows. The line itself serves as a dynamic support level, indicating the floor below which buyers are consistently stepping in to push prices higher.
The process is straightforward. First, you need to locate at least two significant swing lows, or “valleys,” on your chart. A swing low is a point where the price made a dip and then started to move back up. The key rule for an uptrend line is that the second swing low must be higher than the first one. Once you have identified these two points, you use the drawing tool in your charting platform to connect them with a straight line. Finally, extend this line out to the right, into the future. This extended line now represents your potential support level.
For example, imagine the EUR/USD price falls to 1.0750, then rallies, then falls again to 1.0800 before rallying once more. You would draw your uptrend line by connecting the 1.0750 low with the 1.0800 low. As long as the price remains above this line, the uptrend is considered intact. Each time the price pulls back and touches the trend line and then bounces up, it validates the strength of the trend. A third touch makes the trend line even more reliable. A clean break below this line would suggest that the buying pressure is weakening and the uptrend might be over.
How Do You Draw a Downtrend Line?
Drawing a downtrend line is the mirror image of drawing an uptrend line. This line acts as a dynamic resistance level, representing a ceiling where sellers consistently emerge to push prices lower. The first step is to identify a chart where the price is making a series of lower highs and lower lows.
 How Long Does a Forex Trend Last?
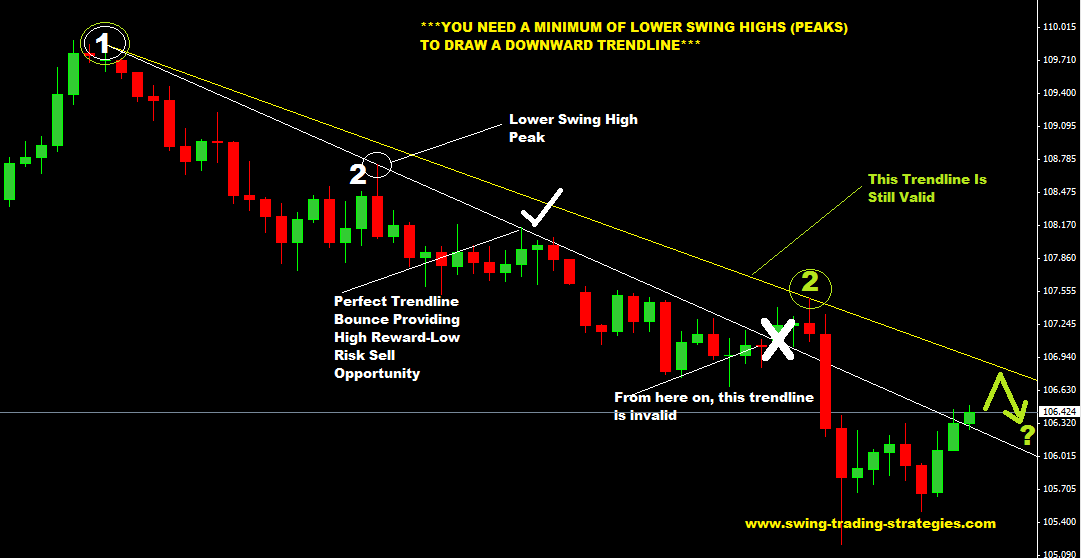
To draw the line, you need to find at least two significant swing highs, or “peaks.” A swing high is a point where the price made a peak and then started to fall. For a downtrend line, the second swing high must be lower than the first one. After identifying these two points, you connect them with a straight line and extend it into the future. This line now serves as your resistance boundary for the downtrend.
For instance, if the GBP/USD pair rallies to 1.2600, then falls, then rallies again but only reaches 1.2550 before falling again, you have two lower highs. You would draw your downtrend line by connecting the 1.2600 peak with the 1.2550 peak. As long as the price continues to stay below this descending line, the downtrend is considered active. When the price rallies up to the trend line and is rejected, it confirms the validity of the trend. A solid and sustained break above the downtrend line is a strong signal that the selling pressure is fading and a potential trend reversal to the upside could be starting.
How Do You Identify Trends with Market Structure?
You identify trends with market structure by observing the pattern of consecutive peaks and troughs, also known as swing highs and swing lows, on a price chart. This method, which forms the basis of price action trading, allows you to understand the market’s directional flow without relying on any indicators. A consistent pattern of higher highs and higher lows signals an uptrend, while a series of lower highs and lower lows indicates a downtrend. By reading the story that these price points tell, you can determine who is in control, buyers or sellers, and anticipate the most likely direction of future price movements. This pure form of analysis gives you a direct look into the market’s underlying psychology.
In detail, market structure analysis involves breaking down price movement into two simple components: impulse moves and corrective moves. An impulse move is a strong price movement in the direction of the main trend. A corrective move, or pullback, is a smaller counter-trend movement before the main trend resumes. In an uptrend, the impulse moves are upward, creating new highs, while the corrective moves are the downward pullbacks that create higher lows. Conversely, in a downtrend, the impulse moves are downward, creating new lows, and the corrective moves are the upward rallies that create lower highs. A change in trend is often signaled by a “break of structure.” For example, in an uptrend, if the price fails to make a new higher high and instead breaks below the previous higher low, it’s a strong indication that the trend may be reversing.
What is the Structure of an Uptrend?
The structure of an uptrend is defined by a consistent and repeating pattern of Higher Highs (HH) and Higher Lows (HL). This formation creates a visual “staircase” effect on the chart, where each step up is higher than the last. This pattern is a clear indication that buyers are in control of the market.
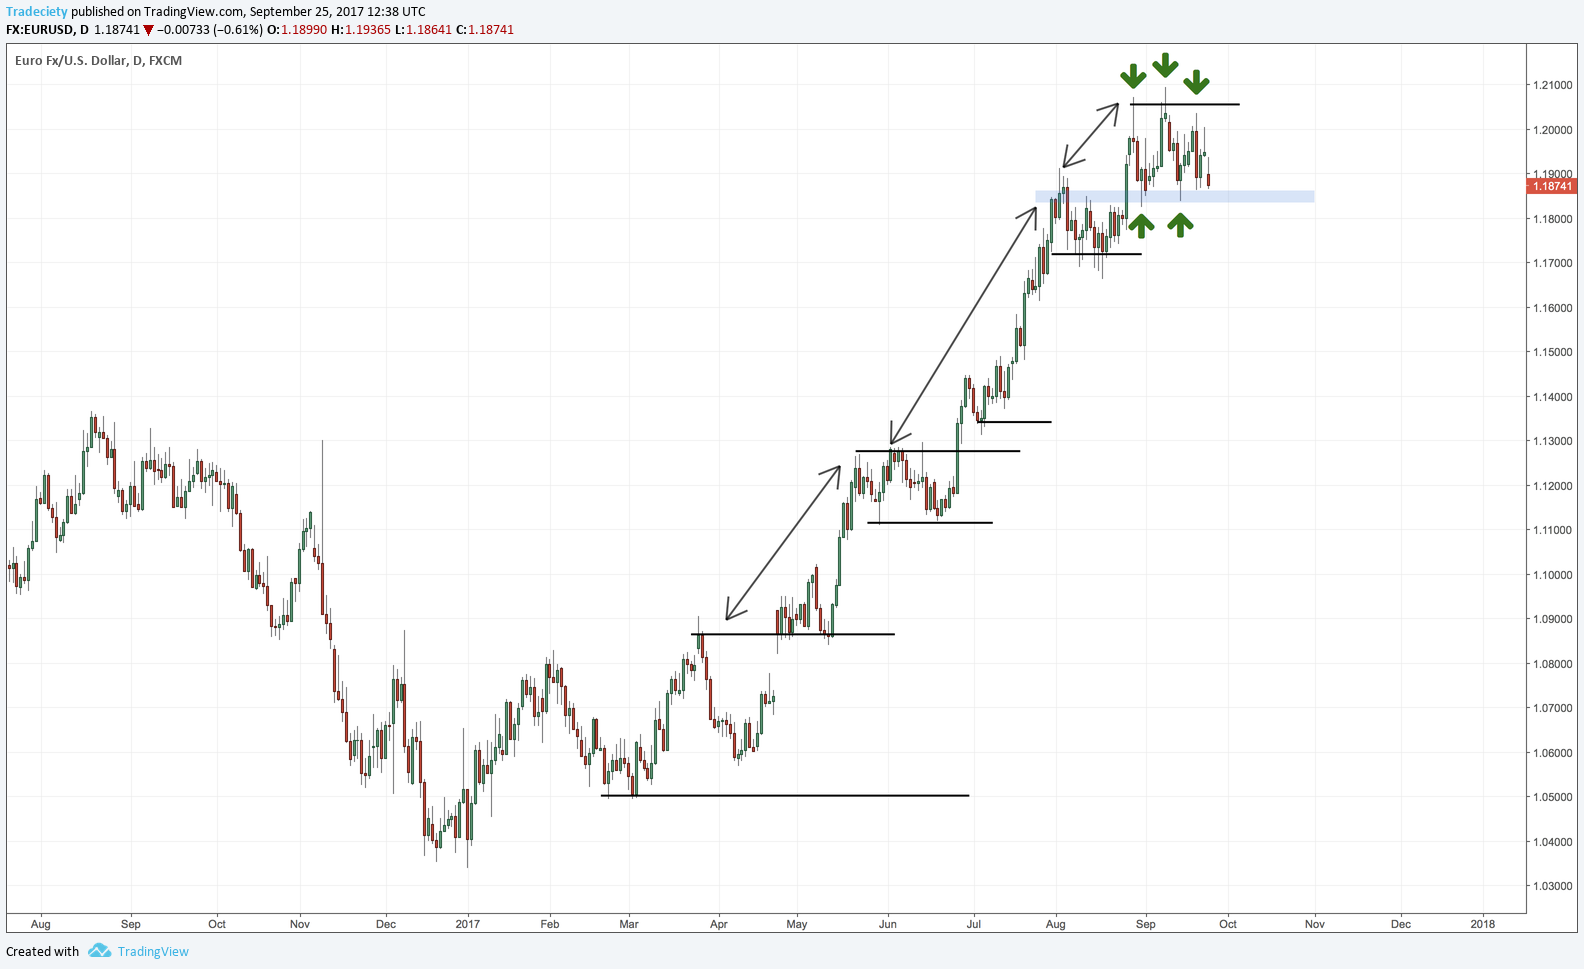
Let’s break it down. The cycle begins when the price makes an upward impulse move, creating a new peak, or a Higher High. This HH is higher than any previous peak in the current sequence. Following this peak, the market will naturally pull back in a corrective move as some traders take profits. This pullback creates a trough, or a Higher Low. This HL is important because it is a low point that is higher than the previous low point. After the HL is formed, buyers step back in with renewed strength, pushing the price up past the previous HH to create a new Higher High. This HH-HL cycle then repeats itself. As long as this pattern of price making a new high, pulling back to a higher low, and then making another new high continues, the uptrend remains intact and healthy. The uptrend is only considered to be in jeopardy when the price fails to make a new Higher High or breaks below the most recent Higher Low.
What is the Structure of a Downtrend?
The structure of a downtrend is the inverse of an uptrend, characterized by a persistent series of Lower Highs (LH) and Lower Lows (LL). This pattern shows that sellers are firmly in control, consistently pushing the price to new depths. Visually, this creates a downward-sloping staircase on the chart.
The process starts with a strong downward impulse move that establishes a new trough, or a Lower Low. This LL is a price point that is lower than any recent low. After this move, the market typically sees a corrective rally as short-term sellers take profits, causing the price to bounce upward. This rally creates a peak, known as a Lower High. This LH is significant because it’s a high point that is lower than the previous high point, showing that buyers lacked the strength to push the price back to its former levels. Following the formation of the LH, sellers regain control and push the price down again, breaking below the previous LL to create a new Lower Low. This cycle of LL-LH repeats, confirming the downtrend’s strength. The downtrend is considered active as long as this structure holds. The first sign of a potential reversal would be the price breaking above the most recent Lower High, which would be a break of the bearish market structure.
How Do You Use Moving Averages to Spot Trends?
You use moving averages to spot trends by observing where the current price is trading in relation to the moving average line and by watching for crossovers between different moving averages. This popular technical indicator simplifies trend identification by smoothing out short-term price fluctuations, giving you a clearer picture of the market’s overall direction. A moving average is essentially a constantly updated average price calculated over a specific number of periods, plotted as a single flowing line on your chart. Its position and slope provide immediate visual cues about the trend’s health, direction, and momentum. When used correctly, moving averages can act as a reliable guide for confirming trends and identifying potential entry and exit points.
To elaborate, moving averages are considered lagging indicators, meaning they confirm a trend that is already in motion rather than predicting a new one. This makes them excellent tools for confirmation. There are two main types: the Simple Moving Average (SMA), which gives equal weight to all prices in the period, and the Exponential Moving Average (EMA), which gives more weight to recent prices, making it more responsive to new information. Traders use various time periods for their moving averages depending on their strategy. Short-term traders might use a 10-period or 20-period MA to track immediate momentum, while long-term traders often rely on the 50-period, 100-period, or the widely-watched 200-period MA to gauge the primary trend.
How Does Price Relative to a Moving Average Indicate a Trend?
The relationship between the current price and a moving average (MA) is one of the simplest and most effective ways to identify a trend. The basic rule is straightforward: if the price is consistently trading above the moving average line, and the line itself is sloping upwards, it suggests an uptrend. Conversely, if the price is consistently trading below a downward-sloping moving average, it suggests a downtrend.
For instance, many traders use the 50-period and 200-period moving averages as key benchmarks. If the price of a currency pair is trading above its 200-period moving average on the daily chart, the long-term sentiment is generally considered bullish. Traders will look for buying opportunities. If the price is below the 200-period MA, the long-term sentiment is bearish, and traders will look for selling opportunities. The moving average often acts as a dynamic level of support or resistance. In a strong uptrend, you will often see the price pull back to the MA, touch it, and then bounce higher, continuing the trend. In a strong downtrend, the price may rally up to the MA, get rejected, and then fall lower. When the price starts to crisscross the moving average frequently, it indicates a lack of a clear trend and suggests the market may be in a sideways or ranging phase.
How Do Moving Average Crossovers Signal a Trend Change?
Moving average crossovers are a popular signal used to identify when a trend might be changing direction. This technique involves plotting two moving averages on a chart: a faster one (with a shorter time period, like a 50-period MA) and a slower one (with a longer time period, like a 200-period MA). A trend change is signaled when the two lines cross each other.
The most well-known crossover signal is the Golden Cross. This is a bullish signal that occurs when the shorter-term moving average crosses above the longer-term moving average. For example, when the 50-day SMA crosses above the 200-day SMA, it suggests that short-term momentum is shifting to the upside and a new, potentially long-lasting uptrend is beginning. This is often interpreted by long-term traders and investors as a strong signal to buy.
The opposite signal is the Death Cross. This is a bearish signal that occurs when the shorter-term moving average crosses below the longer-term moving average. Using the same example, when the 50-day SMA crosses below the 200-day SMA, it indicates that bearish momentum is taking over and a significant downtrend could be starting. This is often seen as a major signal to sell or exit long positions. Because moving averages are lagging indicators, crossovers confirm a trend change after it has already begun, not before. This makes them more suitable for traders who prefer to join established trends rather than trying to predict market tops and bottoms.
What are Advanced Methods and Related Concepts for Trend Analysis?
Advanced trend analysis involves using specific indicators to measure trend strength, distinguishing primary movements from retracements, and confirming signals across multiple time frames. Furthermore, traders use chart patterns and an awareness of common analytical errors to refine their strategies and improve decision making. These concepts move beyond simply drawing a line on a chart, providing a more robust framework for understanding market dynamics and identifying high probability trading opportunities. By integrating these methods, you can gain a deeper insight into whether a trend is sustainable, losing momentum, or about to reverse.
What are the Best Indicators for Identifying Trend Strength?
While many indicators show the direction of a trend, specialized tools are designed to measure its underlying strength or momentum. The Average Directional Index (ADX) is a primary indicator for this purpose. It does not show trend direction, but rather quantifies its strength on a scale of 0 to 100. A reading above 25 typically suggests a strong trend is in place, whether up or down, making it suitable for trend following strategies. A reading below 20 indicates a weak or non-existent trend, suggesting a ranging market where trend strategies may fail. Another powerful tool is the Relative Strength Index (RSI). Although commonly used to identify overbought or oversold conditions, the RSI is also an excellent momentum indicator. In a strong uptrend, the RSI will tend to remain above the 50 level and frequently move above 70. Conversely, in a strong downtrend, the RSI will typically stay below 50. Persistent readings in these zones confirm the trend has strong momentum behind it.
What is the Difference Between a Trend and a Retracement?
Understanding the distinction between a trend and a retracement is essential for effective trade entry and risk management. A trend is the primary, sustained direction of price movement over a significant period. An uptrend consists of higher highs and higher lows, while a downtrend consists of lower lows and lower highs. In contrast, a retracement, often called a pullback or correction, is a temporary, shorter term price movement against the primary trend. For example, during a strong uptrend, a retracement would be a brief period where prices fall before resuming their upward climb. A trend reflects the dominant market sentiment, while a retracement represents a temporary pause or profit taking activity. Key differences help distinguish them.

- Duration and Magnitude: Trends last much longer and cover a larger price distance than retracements.
- Volume: Trends are typically accompanied by higher trading volume in the direction of the trend, whereas volume tends to decrease during a retracement.
- Structure: A trend establishes the overall market direction, while retracements are the smaller counter movements within that larger structure.
How Does Multiple Time Frame Analysis Help Identify Trends?
Multiple time frame analysis is a technique where traders view the same currency pair across different chart durations to build a more complete picture of the market trend. This method helps confirm the validity and strength of a trend identified on a primary time frame. For example, a trader might start with a long-term chart (e.g., daily or weekly) to identify the dominant, overarching trend. If the daily chart shows a clear uptrend, the trader then moves to a medium-term chart (e.g., 4-hour) to see if the structure aligns with the longer term view. Finally, the trader uses a short-term chart (e.g., 1-hour or 15-minute) to pinpoint a precise entry point, perhaps waiting for a small pullback to complete on the shorter time frame before entering a trade in the direction of the main daily trend. This top-down approach helps traders avoid entering trades based on short term noise that contradicts the larger market sentiment, thereby increasing the probability of a successful outcome.
Can Chart Patterns Confirm a Forex Trend?
Yes, chart patterns provide powerful visual confirmation of a trend’s status, signaling either its likely continuation or a potential reversal. These patterns are formed by price action and represent the collective psychology of market participants. They are generally categorized into two groups: continuation patterns and reversal patterns. Continuation patterns, such as flags, pennants, and rectangles, are temporary pauses in an existing trend. A flag pattern, for instance, looks like a small, sloping rectangle after a sharp price move and suggests the market is consolidating before continuing in its original direction. On the other hand, reversal patterns signal that the current trend is losing momentum and may be about to change direction. Common reversal patterns include the head and shoulders, double tops, and double bottoms. A double top, which looks like the letter “M”, indicates that an uptrend has failed to make a new high and is likely to reverse into a downtrend. Using these patterns adds a layer of confirmation to indicator or trend line analysis.
What are Common Mistakes When Identifying Forex Trends?
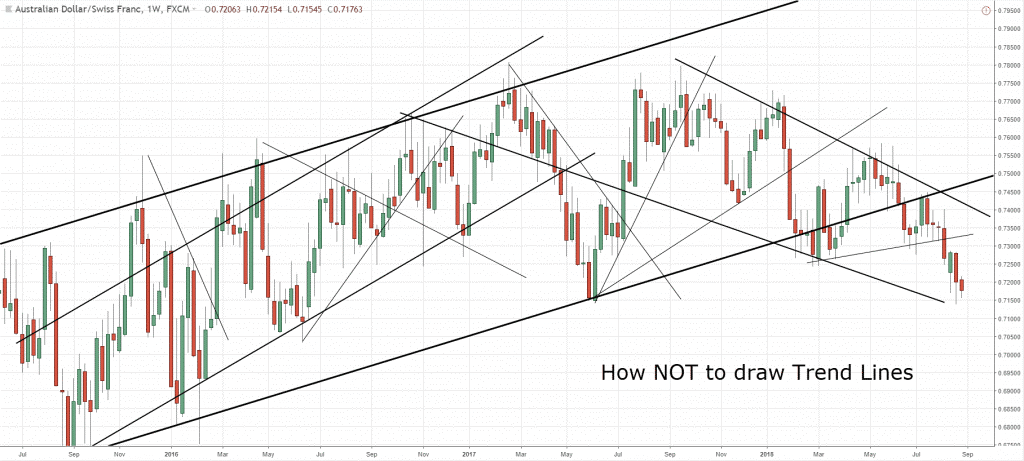
Novice traders often make predictable errors when trying to identify and trade forex trends, which can lead to unnecessary losses. One of the most frequent mistakes is forcing a trend line. This happens when a trader draws a line that cuts through several price candles just to make it fit a preconceived notion of a trend, rather than drawing it accurately across the swing highs or lows. Another common error is ignoring market context, such as failing to account for major economic news releases that can instantly invalidate a technical trend. Overcomplicating analysis by using too many indicators at once, known as analysis paralysis, is also a significant pitfall. This often creates conflicting signals and confusion. Lastly, traders often misinterpret consolidation for a reversal. A sideways, ranging market does not always mean the trend is over. It can simply be a pause before the trend resumes with force. Avoiding these common mistakes requires discipline, patience, and a clear analytical process.
