

Blog
What Is a Forex Candlestick and How Do You Read Its Basic Patterns?

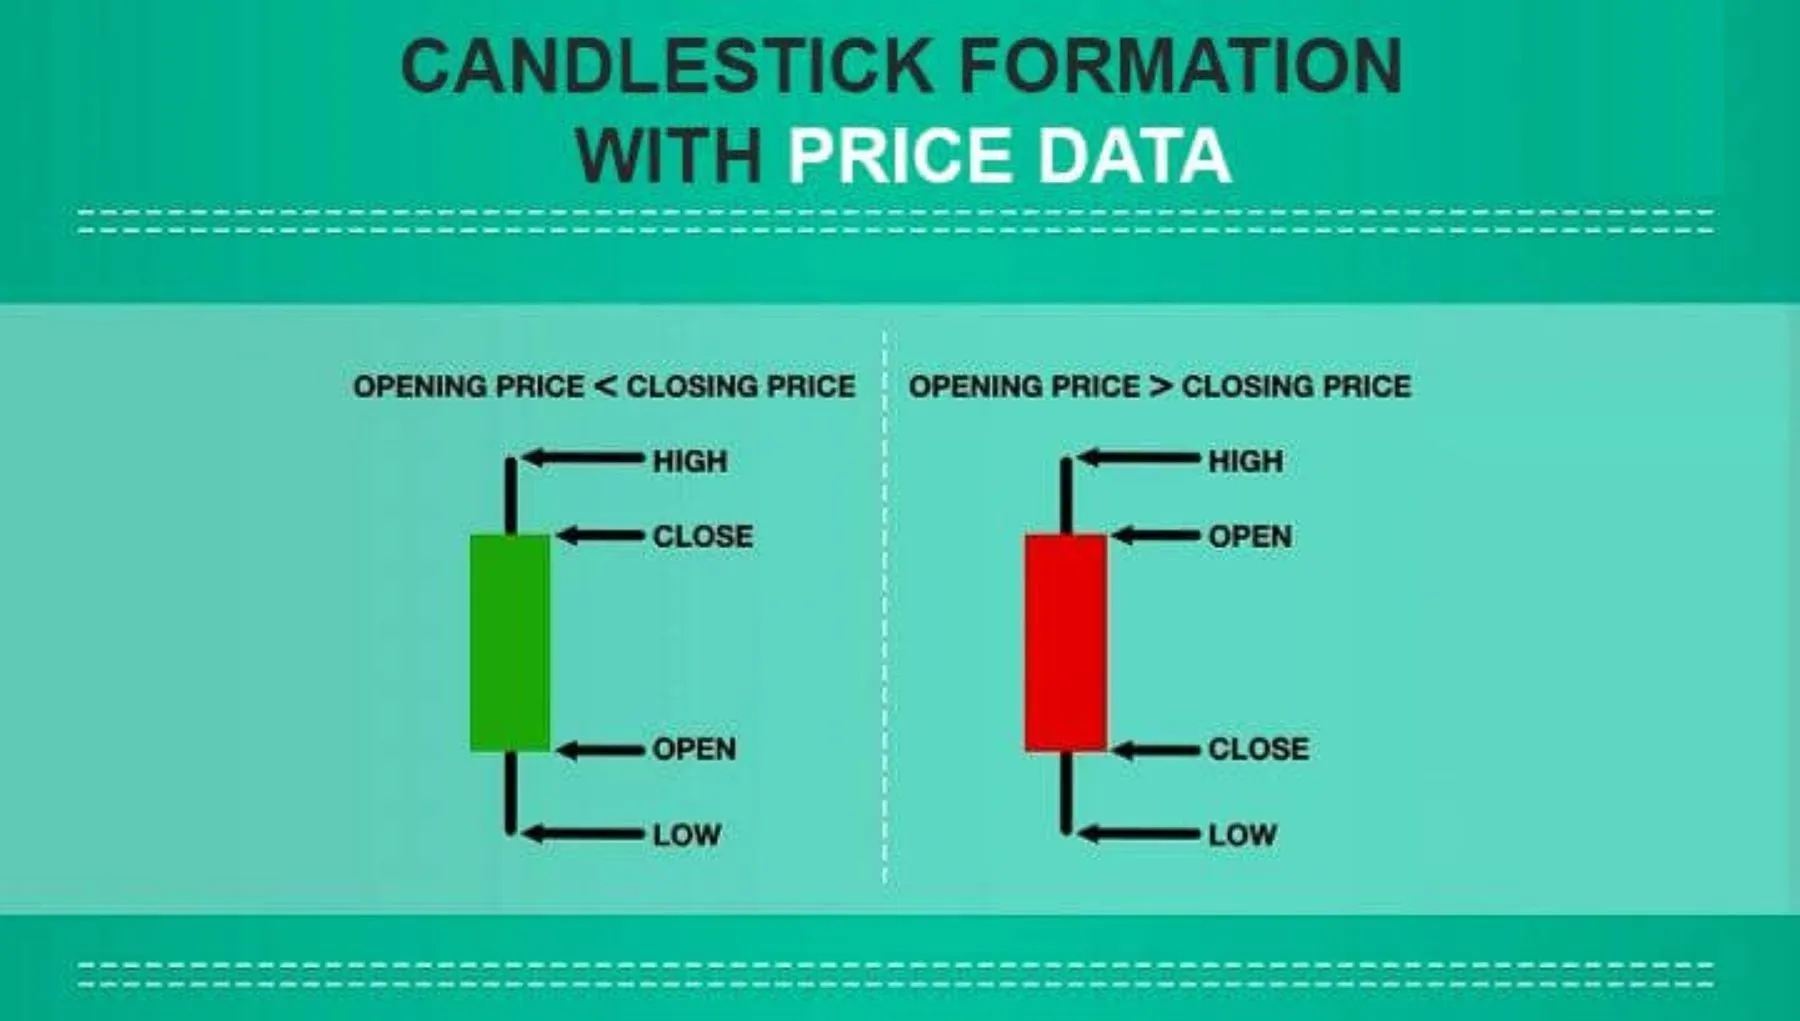
A forex candlestick is a visual representation of a currency pair’s price movement within a specific timeframe, making it a cornerstone of technical analysis for traders. Essentially, each candlestick tells a story of the battle between buyers and sellers by displaying four key pieces of information: the opening price, the highest price, the lowest price, and the closing price. This simple visual format allows traders to quickly gauge market sentiment, momentum, and potential price reversals at a glance, without needing to sift through raw numerical data.
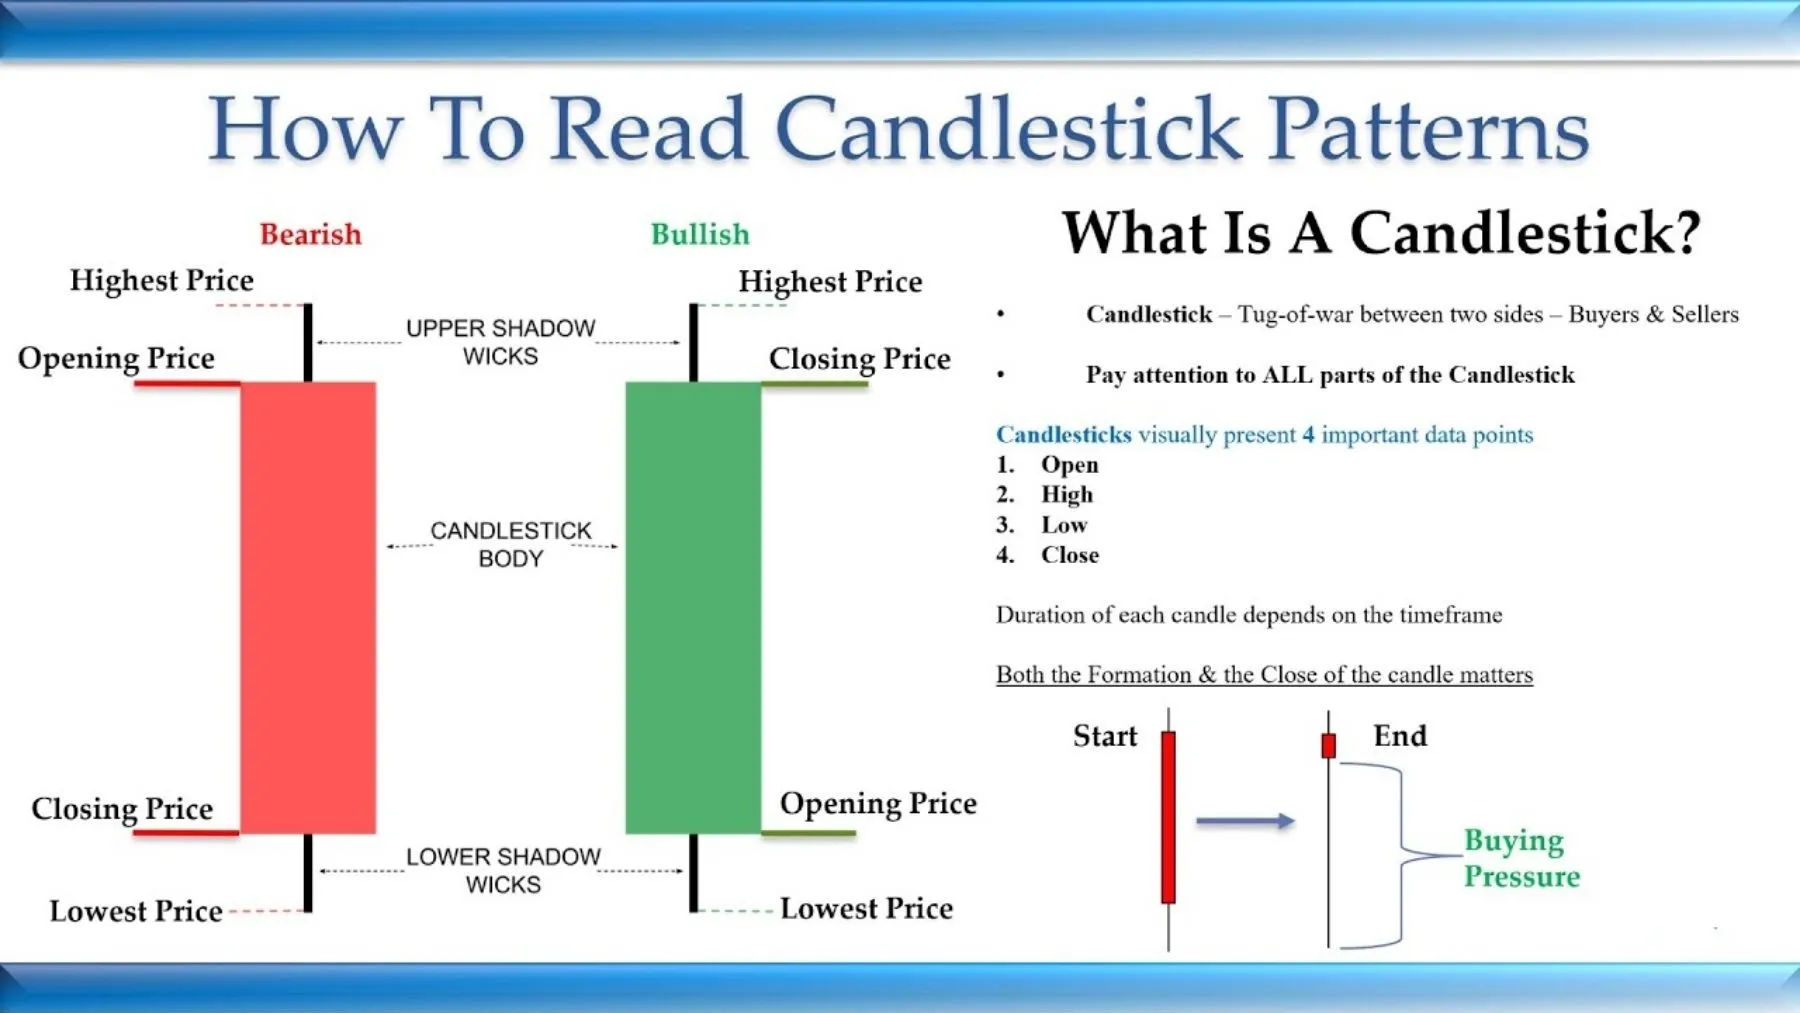
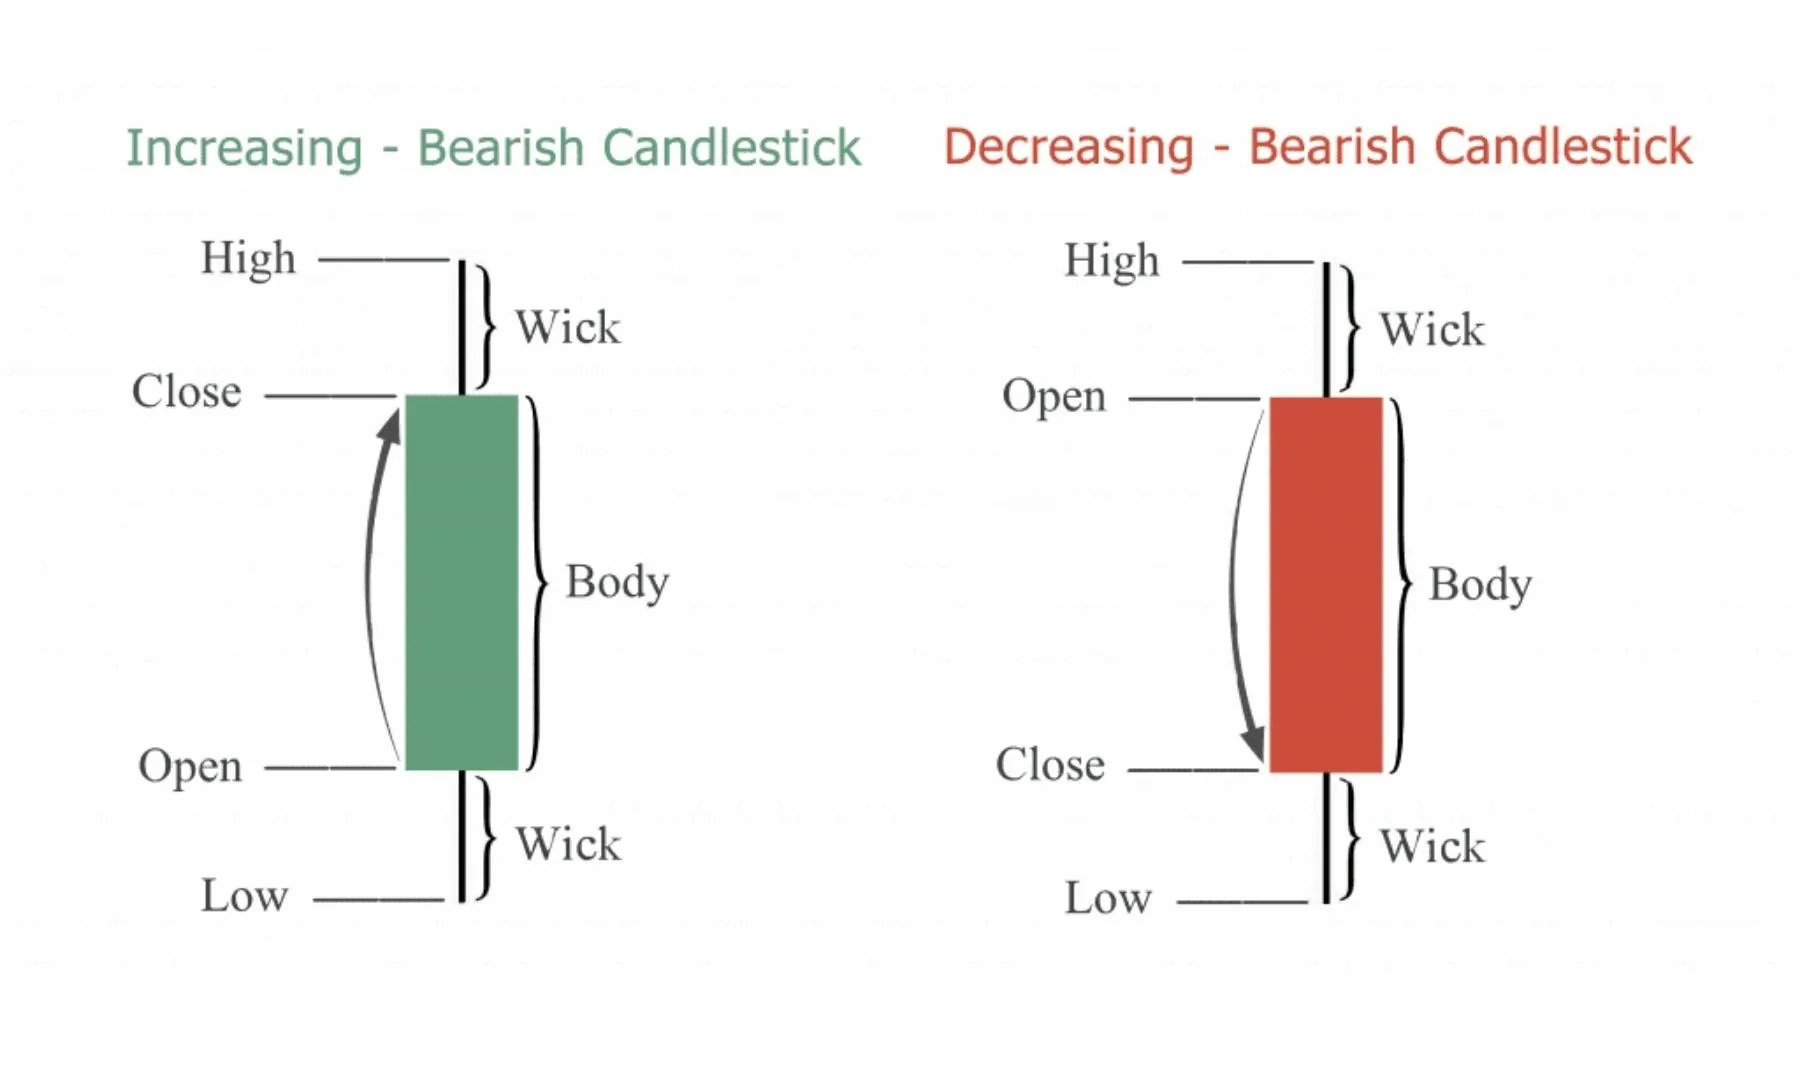
To read a candlestick, you analyze its color, body, and wicks. The color signals the direction of the price movement, the body’s length indicates the strength of that movement, and the wicks, or shadows, reveal the price volatility and any points of rejection. A green or white candle typically means the price closed higher than it opened (bullish), while a red or black candle means it closed lower (bearish). By combining these three elements, you can interpret the market’s behavior during that specific period.
The core components that form every candlestick are the real body and the wicks. The real body is the wide, colored part of the candle that connects the opening and closing prices, representing the net price change. The wicks are the thin lines extending from the top and bottom of the body, showing the highest and lowest price points the currency pair reached before the period ended. The interaction between these parts creates patterns that can signal future market direction.
Understanding these fundamentals is the first step toward using candlestick charts for forex trading. Each candle is a piece of a larger puzzle, and learning to interpret individual candles and their basic patterns gives you a powerful tool for making more informed trading decisions. This guide will break down each component in detail, helping you build a solid foundation for your technical analysis.
What Is a Candlestick in Forex Trading?
A candlestick in forex trading is a single bar on a price chart that visually represents the price movement of a currency pair over a specified period. It is a fundamental tool used in technical analysis because it packs a significant amount of data into a simple, easy-to-read shape. Instead of just showing a single closing price like a line chart, a candlestick provides a complete picture of the price action, revealing the market’s sentiment and momentum. This visual clarity helps traders quickly identify patterns and make predictions about future price movements. Specifically, traders rely on candlesticks to understand the relationship between opening and closing prices, as well as the price extremes reached within a given trading session. This rich data set is what makes candlestick charting so popular among forex traders worldwide.
What Are the Four Key Data Points in a Candlestick?
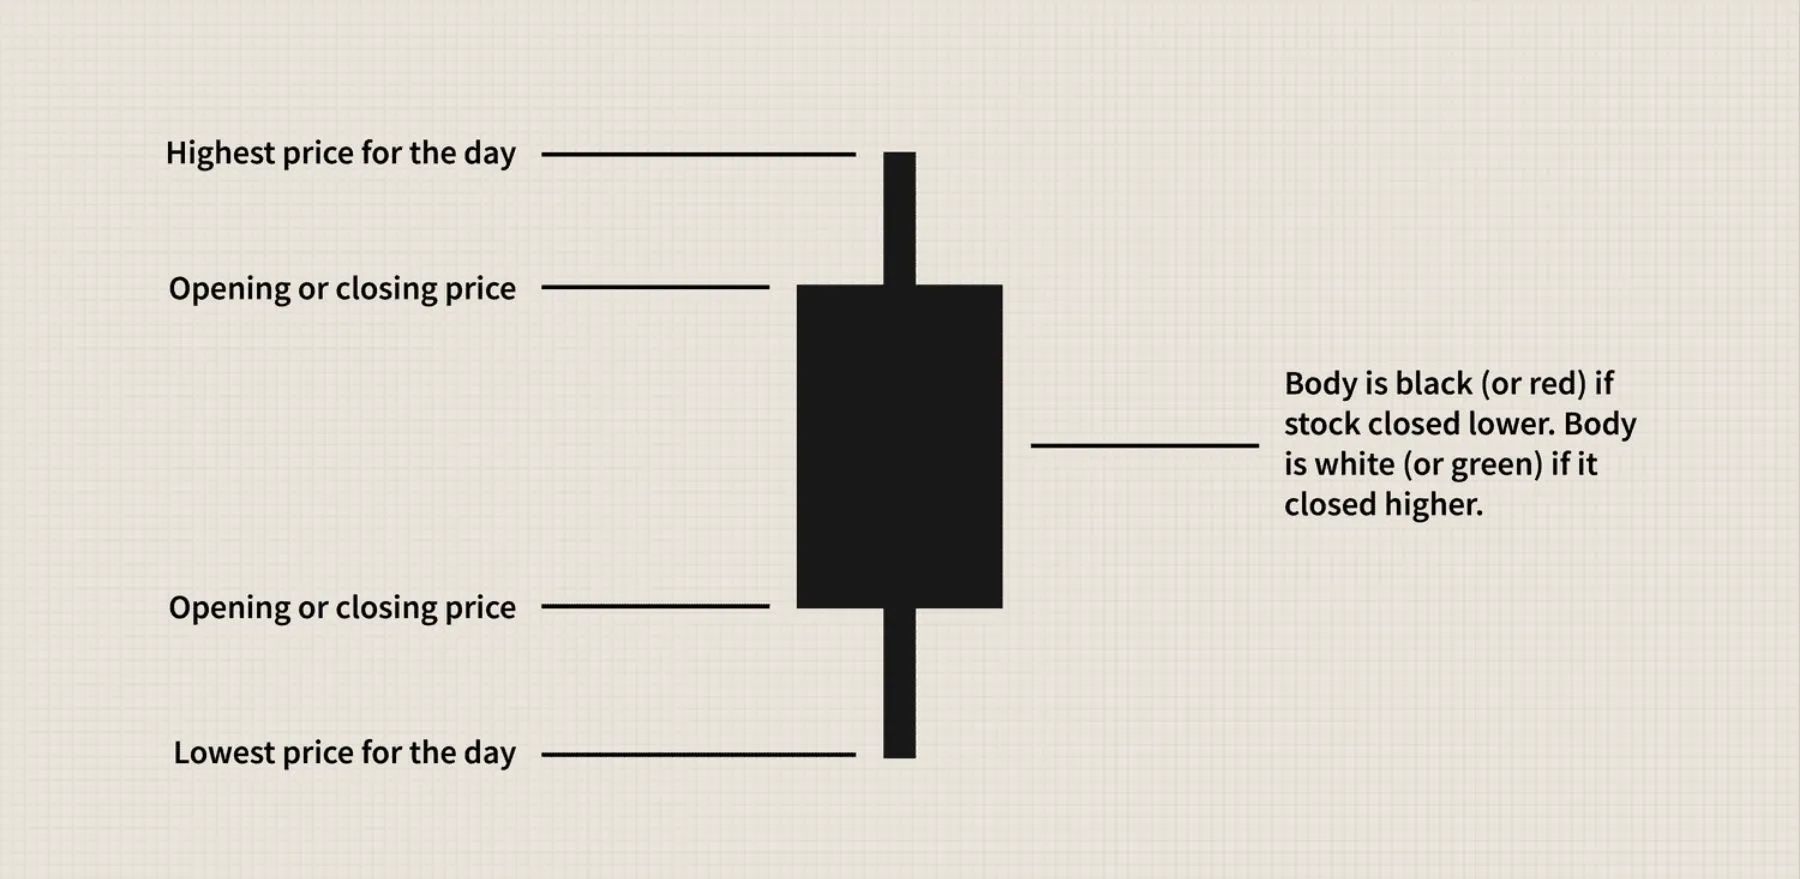
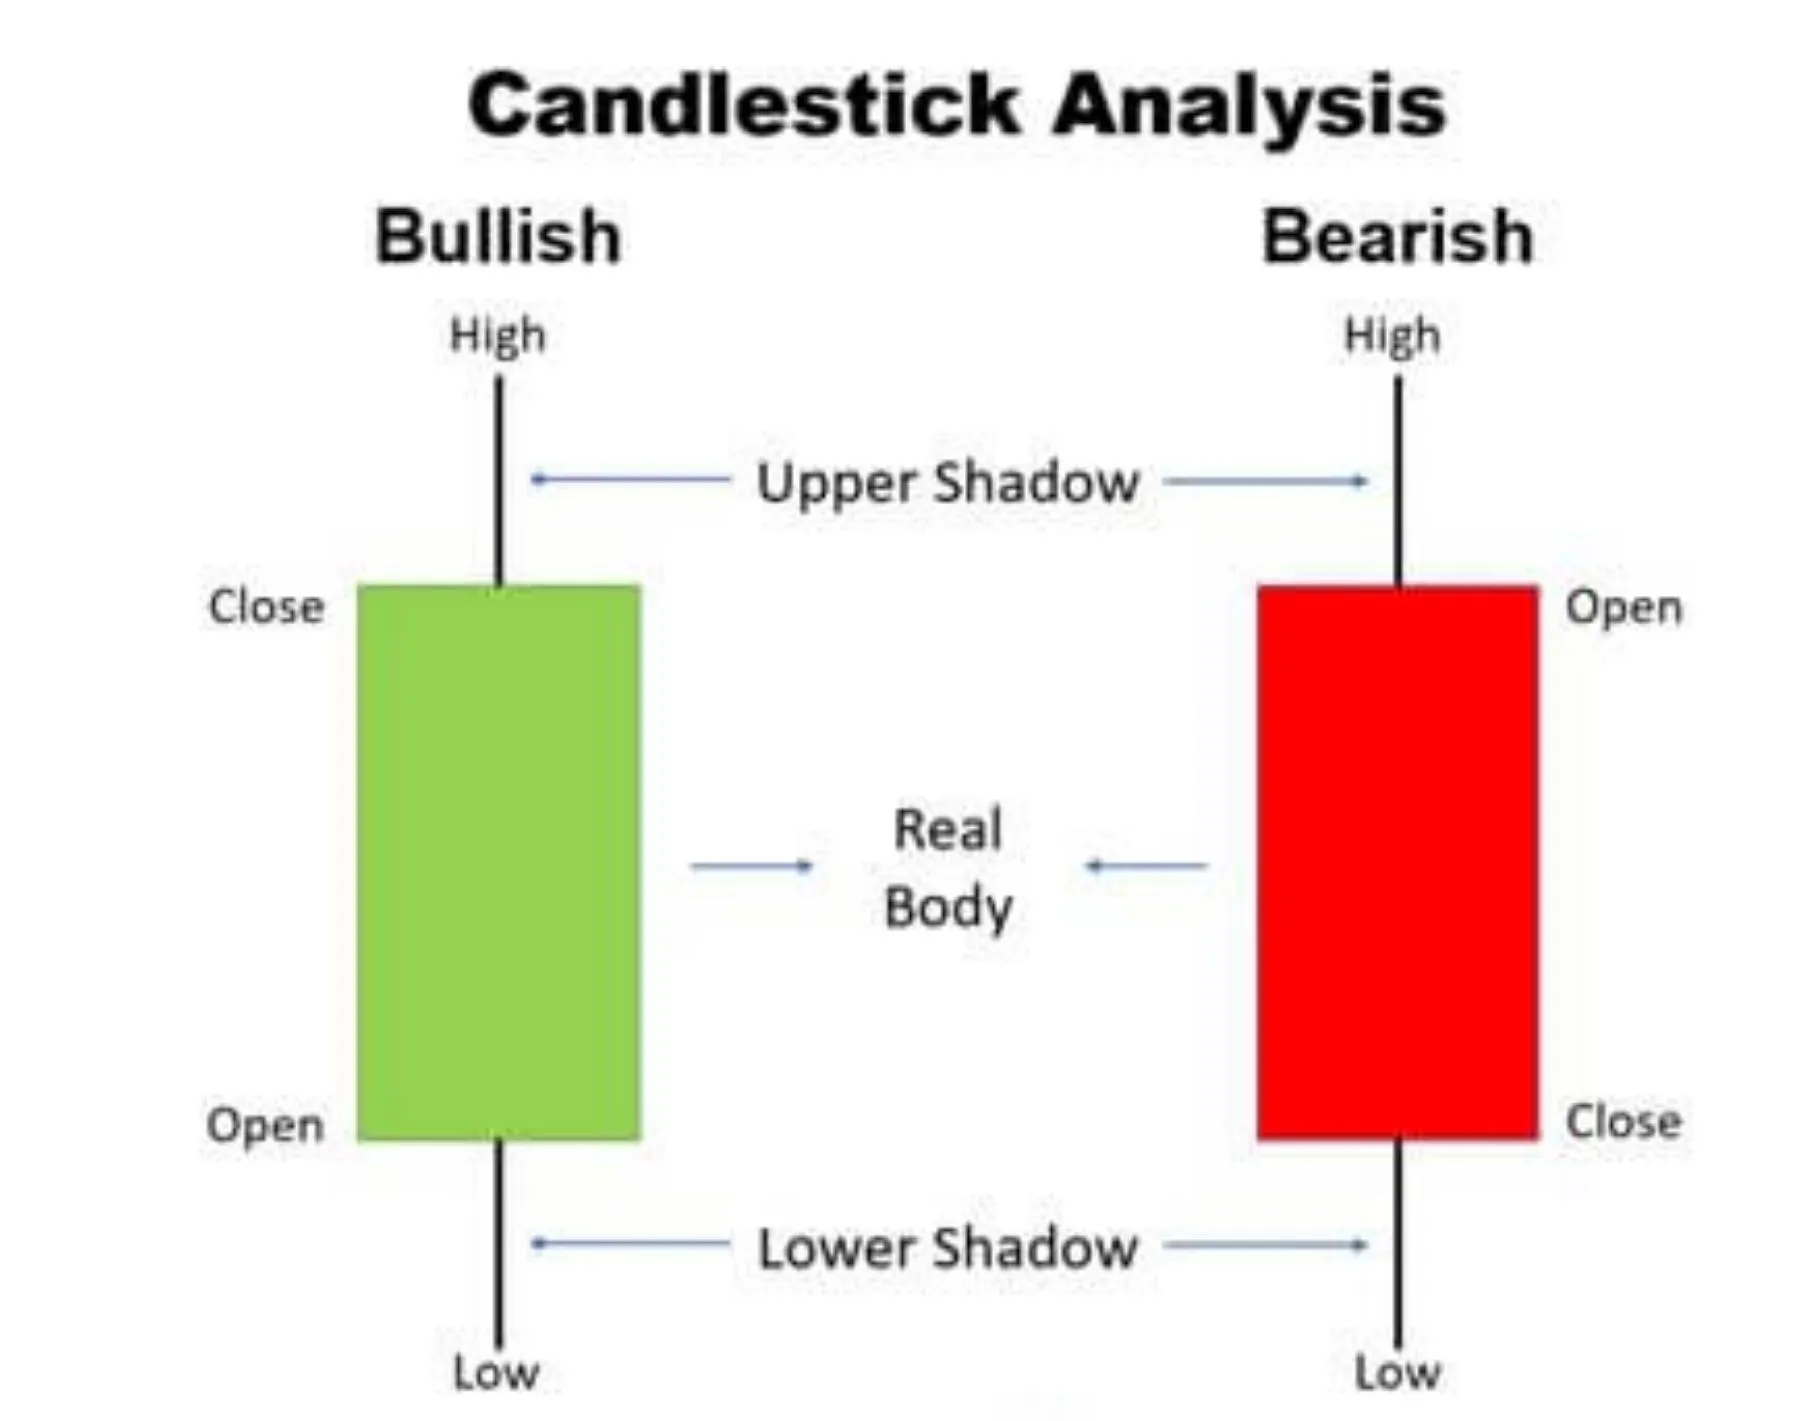
Every single candlestick, regardless of its shape or color, displays four crucial data points known as the OHLC values. These are the Open, High, Low, and Close prices for a specific time period.
- Open (O): This is the price of the currency pair at the very beginning of the selected timeframe. It marks the starting point for the trading session represented by that candle.
- High (H): This is the highest price the currency pair reached at any point during the timeframe. It is represented by the very top of the candle’s upper wick or shadow.
- Low (L): This is the lowest price the currency pair reached during the timeframe. It is shown by the very bottom of the candle’s lower wick or shadow.
- Close (C): This is the final price of the currency pair at the very end of the timeframe. It marks the endpoint for that trading session.
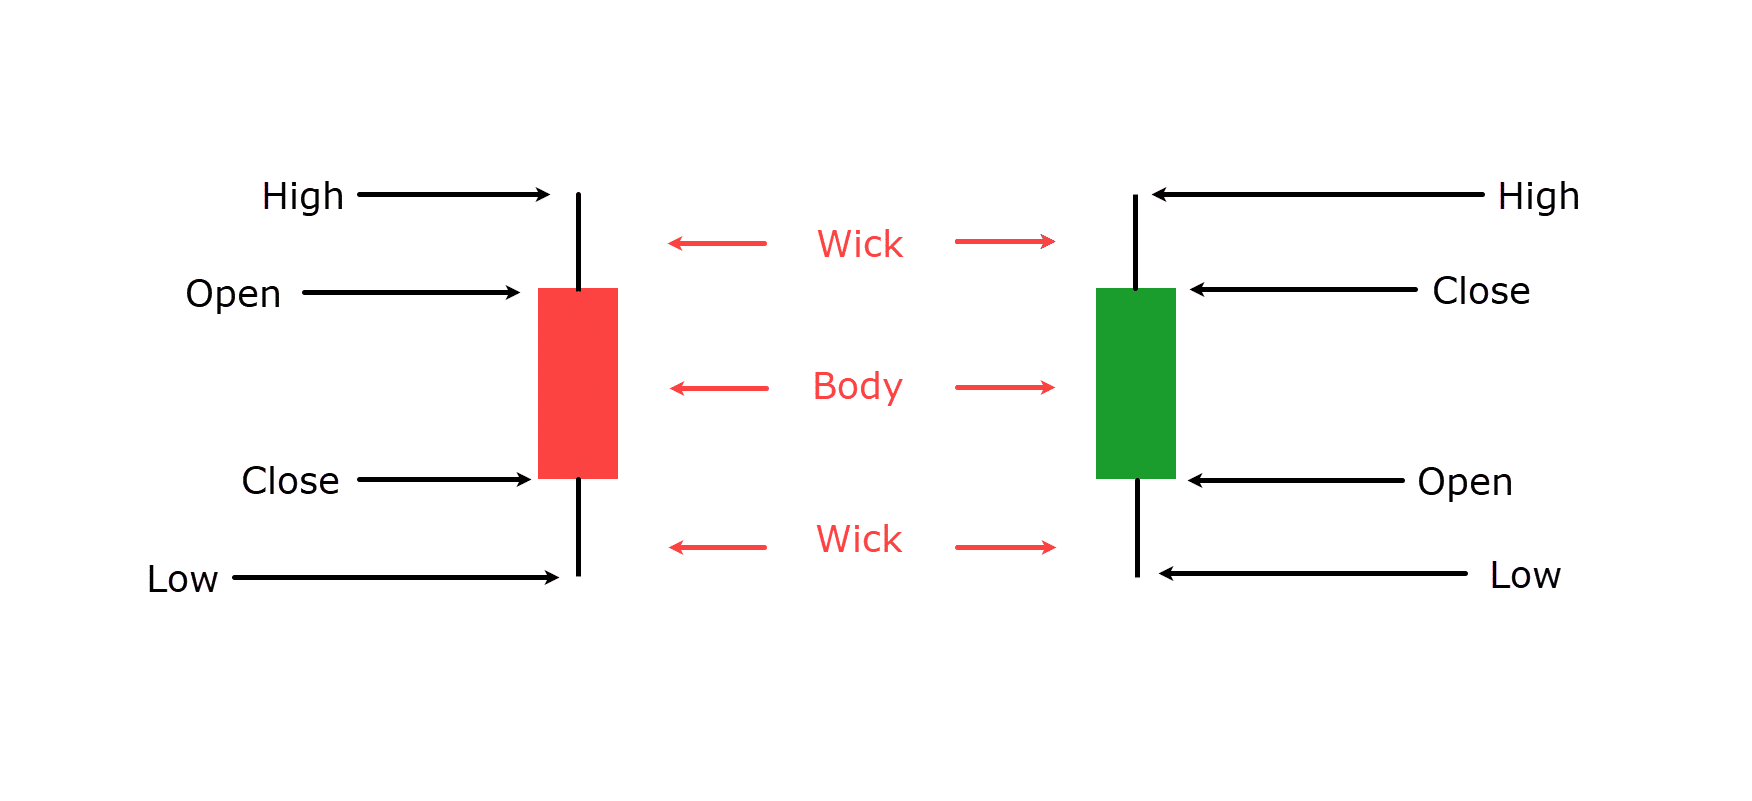
To visualize how these points create a candle, imagine a vertical line connecting the High and the Low price points. This entire range represents all the price fluctuation within the period. On that line, a wider, rectangular box is drawn to connect the Open and Close prices. This box is called the “real body.” The parts of the vertical line that extend above and below the body are the “wicks” or “shadows.” The relationship between these four prices determines the candle’s final appearance and what it tells you about the market.
How Do Different Timeframes Affect Candlesticks?
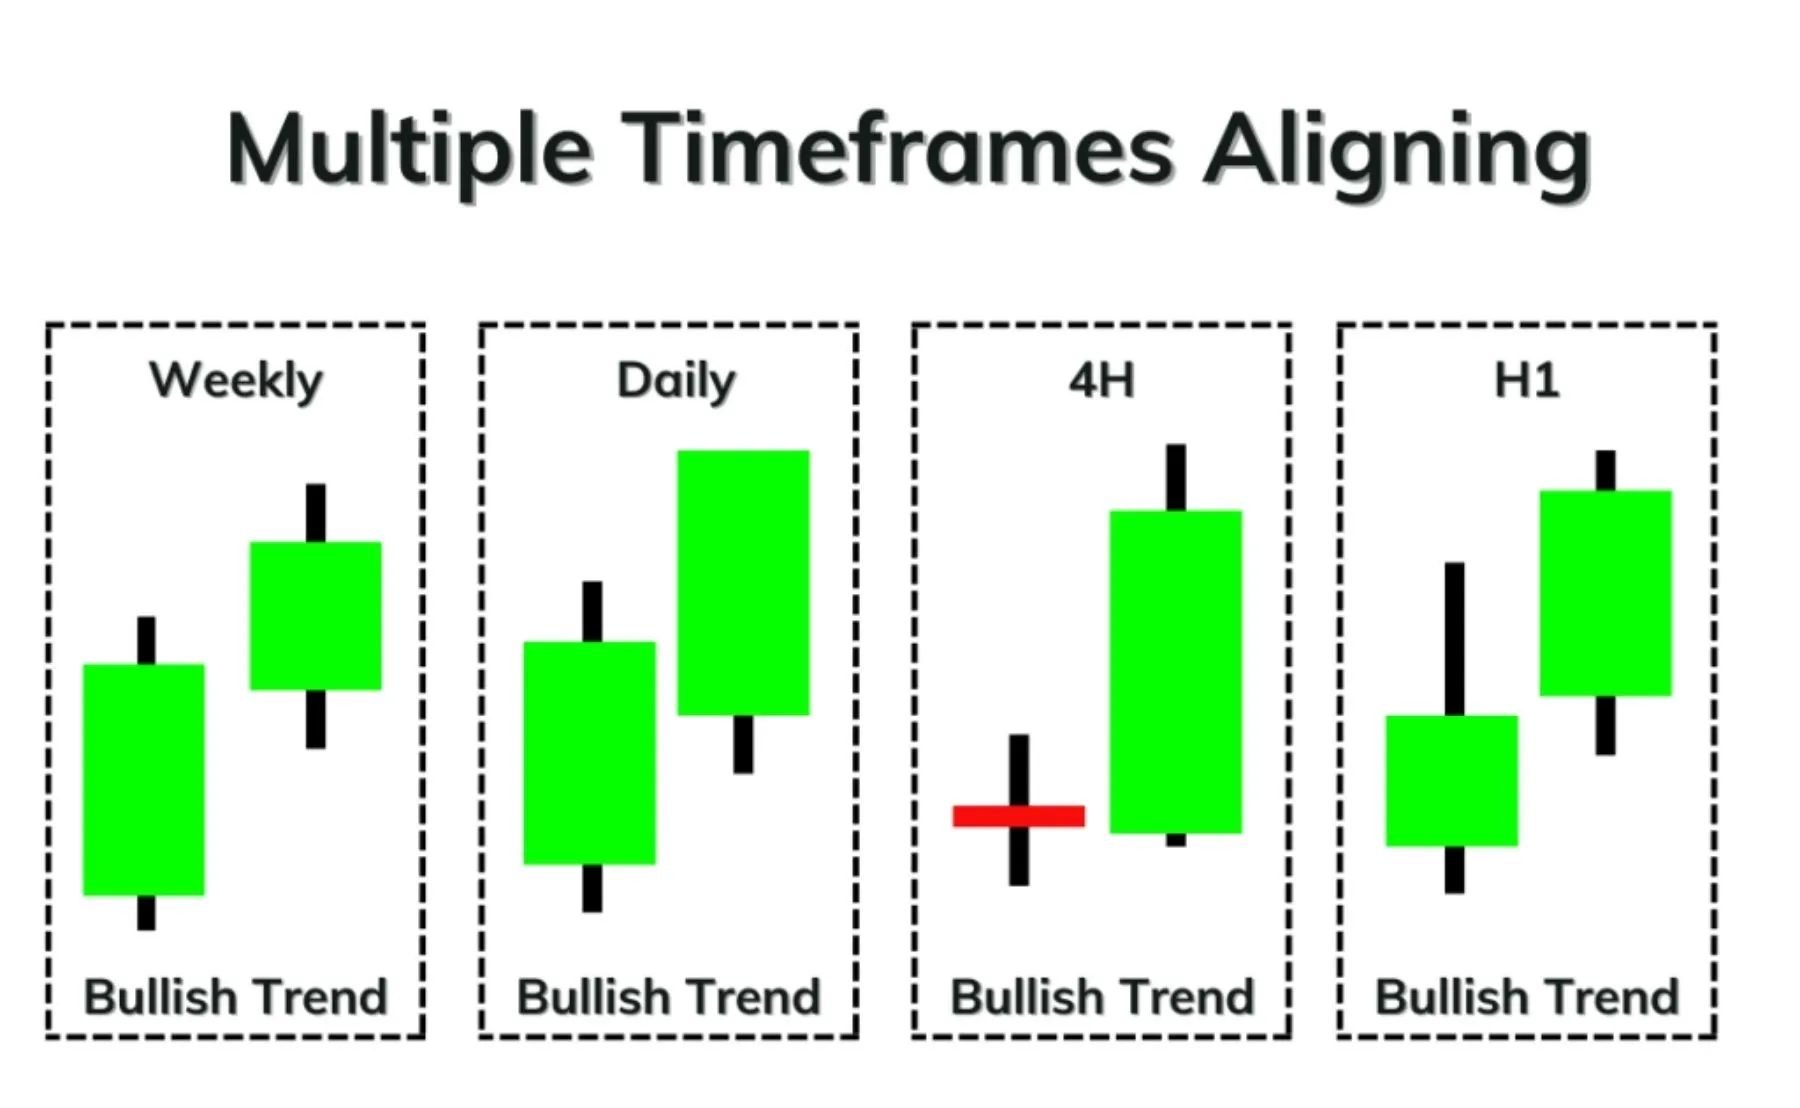
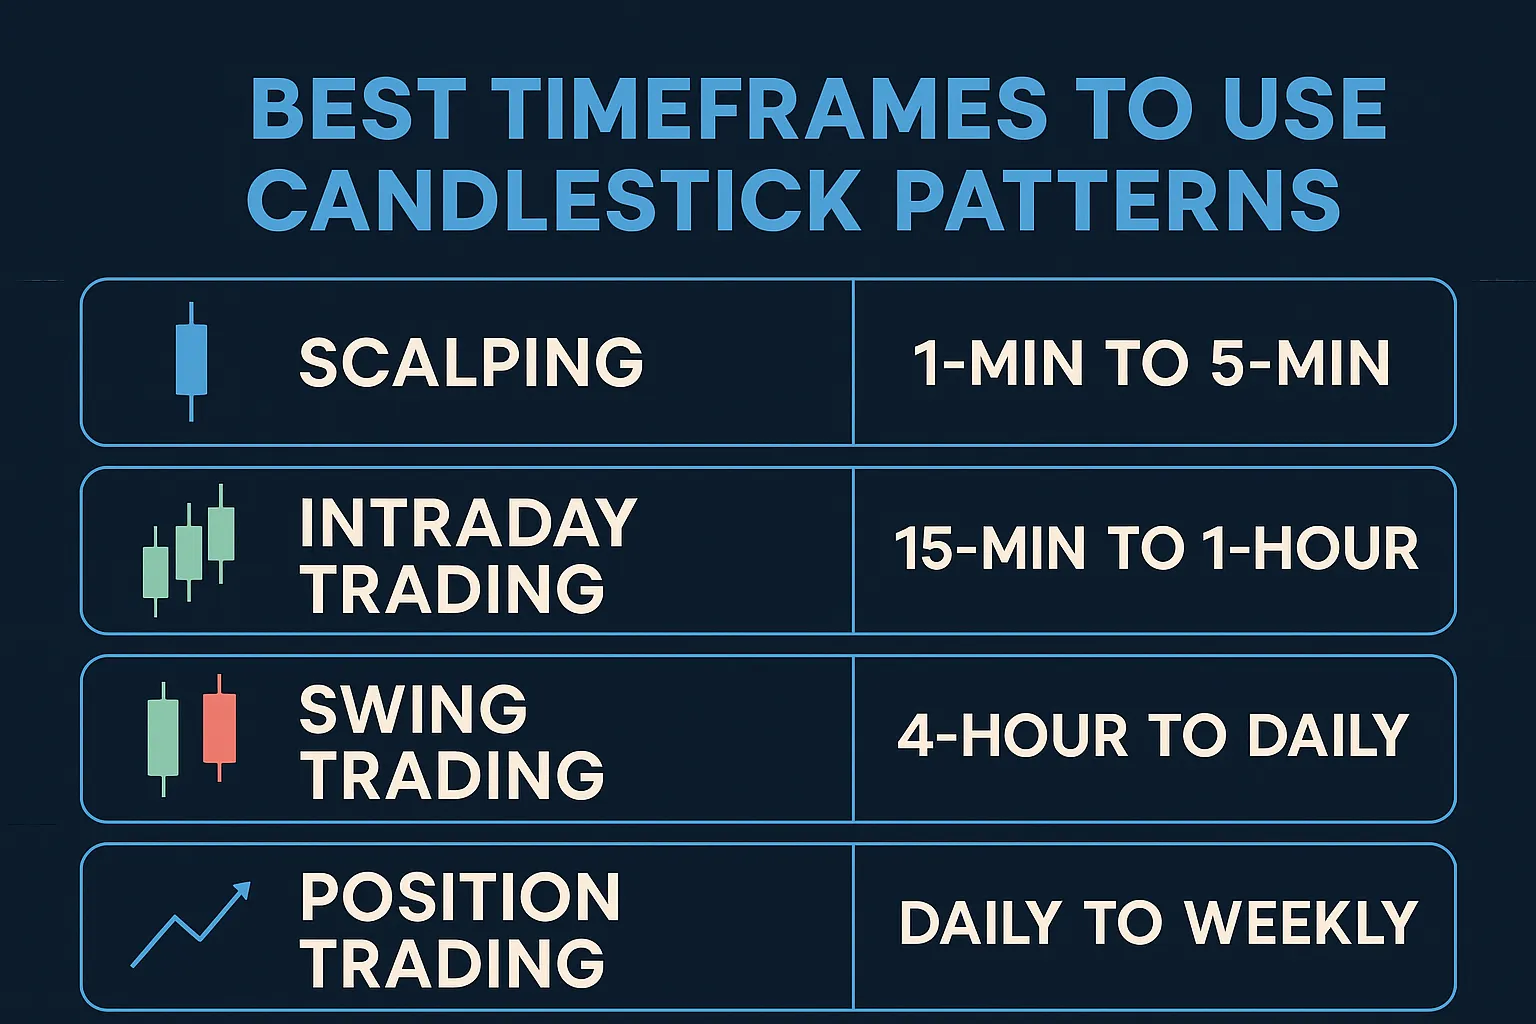
The timeframe you select on your trading chart determines what each candlestick represents. A candlestick can show price action for any period, from one minute (M1) to one hour (H1), one day (D1), one week (W1), or even one month (MN). The chosen timeframe is a critical part of a trading strategy because it changes the context and significance of the patterns you observe. For example, a single daily candlestick encapsulates all the price movement that occurred within a 24-hour period. If you were to switch to an hourly chart, you would see 24 individual hourly candles that make up that one daily candle.
This concept of “fractal” price action is central to technical analysis. Short-term traders, often called scalpers or day traders, tend to focus on lower timeframes like the one-minute (M1), five-minute (M5), or fifteen-minute (M15) charts to make quick trades based on small price fluctuations. In contrast, long-term traders, such as swing or position traders, prefer higher timeframes like the daily (D1), weekly (W1), or monthly (MN) charts. They are looking for larger trends that unfold over weeks or months. A candlestick pattern found on a weekly chart is generally considered more reliable and impactful than the same pattern on a five-minute chart because it is formed from a much larger volume of trading activity and reflects a broader market consensus.
What Are the Core Components of a Candlestick?
The core components of a candlestick are its ‘real body,’ which shows the range between the open and close price, and its ‘wicks’ (or ‘shadows’), which indicate the highest and lowest prices reached. These two parts work together to provide a complete visual summary of the trading activity for a specific period. By learning to read the body and wicks in conjunction, a trader can quickly assess market sentiment, buying and selling pressure, and volatility. The interaction between these elements is what forms the distinct shapes and patterns that technical analysts use to forecast potential market behavior. To understand this better, let’s break down what each of these components signifies.
What Does the Body of a Candlestick Represent?
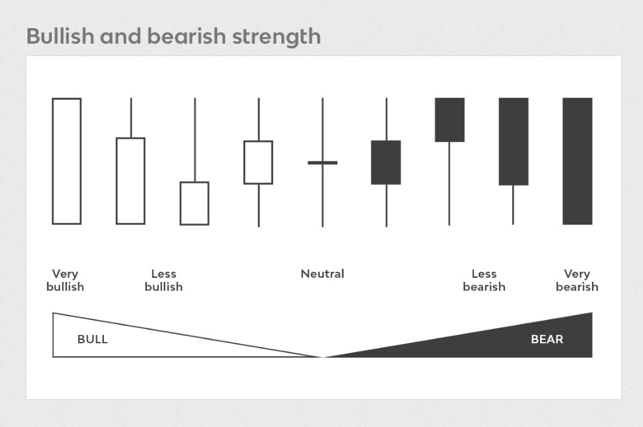
The body of a candlestick, often called the “real body,” is the wide, rectangular part that connects the opening and closing prices. It represents the net price change over the period and is the most immediate indicator of market momentum. The size and color of the body tell a powerful story. A long body suggests strong, decisive price movement in one direction. For instance, a long green body indicates that buyers were in firm control and pushed the price significantly higher from its open. Conversely, a long red body shows that sellers dominated, driving the price down substantially.
On the other hand, a short body signifies limited price movement and often points to market indecision or consolidation. When the body is small, it means the opening and closing prices were very close together, suggesting that neither buyers nor sellers could gain a clear advantage during the period. This lack of direction can sometimes signal a potential pause in the current trend or a warning that a reversal might be on the horizon. The body is the foundation of candlestick analysis, and its length provides the primary context for interpreting the rest of the candle’s features.
What Do the Wicks (or Shadows) of a Candlestick Indicate?
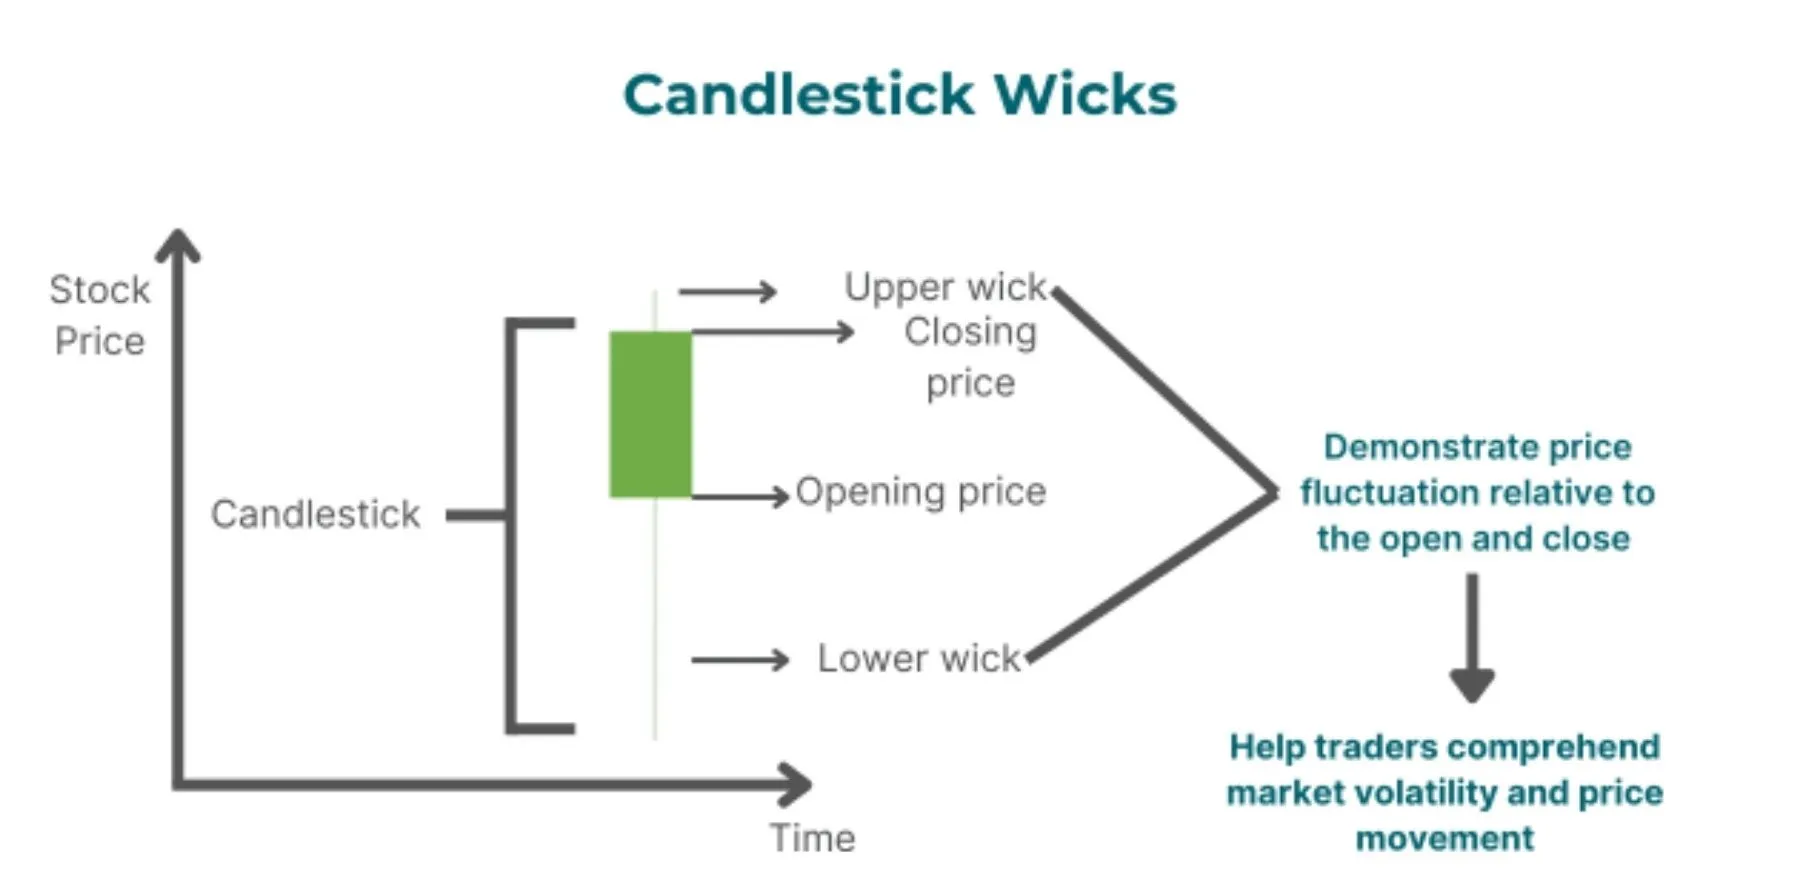
The wicks, also known as shadows or tails, are the thin lines that extend above and below the real body. They represent the full price range of the period, showing the highest and lowest points the currency pair reached before settling at its closing price. The length of the wicks provides critical information about volatility and potential price rejection. The upper wick extends from the top of the body to the session’s high price, while the lower wick extends from the bottom of the body to the session’s low price.
Long wicks are particularly insightful. A long upper wick indicates that buyers tried to push the price higher, but sellers stepped in and forced it back down before the session closed. This price rejection at higher levels can be a bearish signal, suggesting that the upward momentum is weakening. Similarly, a long lower wick shows that sellers attempted to drive the price lower, but buyers entered the market and pushed it back up. This rejection of lower prices is often a bullish signal, indicating that support is forming. In contrast, short or non-existent wicks suggest that the trading action was confined near the open and close, reinforcing the strong momentum indicated by the body.
How Do You Read Bullish and Bearish Candlesticks?
You read bullish and bearish candlesticks by their color: a bullish (green) candle shows the price closed higher than it opened, while a bearish (red) candle shows the price closed lower than it opened. This simple color-coding system allows traders to instantly recognize whether buyers (bulls) or sellers (bears) won the battle for control during a specific trading period. The default colors on most charting platforms are green for bullish and red for bearish, although some traders use white and black, respectively. Understanding this fundamental difference is the first step in interpreting price charts and gauging the overall market sentiment. Let’s look at each type in more detail to see what they signal about market psychology and potential future moves.
What Is a Bullish Candlestick?
A bullish candlestick forms when the closing price is higher than the opening price for a given period. It is typically displayed as a green or white candle on a trading chart. The formation of a bullish candle indicates that buying pressure was stronger than selling pressure during that session. Buyers were in control, successfully pushing the market price up from its opening level. The story it tells is one of optimism and upward momentum. For example, if the EUR/USD currency pair opens the hour at 1.0800 and closes at 1.0850, the result is a bullish candle.
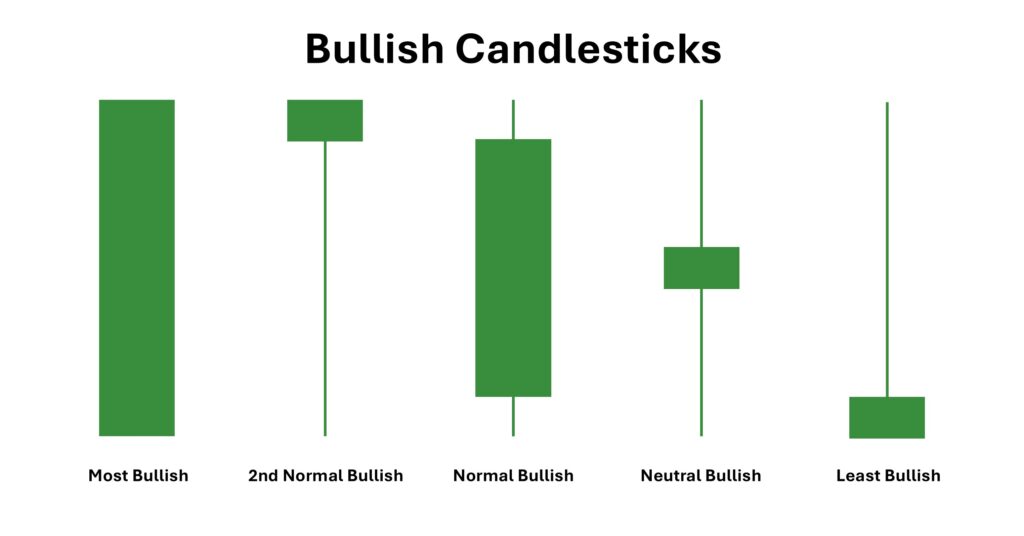
The size of the bullish candle’s body provides additional context. A long green body signifies very strong buying interest, suggesting that the upward trend may continue. This shows a decisive victory for the buyers. A bullish candle with a short body, however, may indicate less conviction from buyers, especially if it has long wicks. For instance, a bullish candle with a long upper wick shows that while buyers managed to close the price higher, sellers put up a significant fight near the session’s high. Interpreting these nuances helps traders understand the strength and sustainability of the bullish sentiment.
What Is a Bearish Candlestick?
A bearish candlestick is the opposite of a bullish one. It forms when the closing price is lower than the opening price, and it is usually colored red or black. This type of candle represents selling pressure, signaling that sellers were more powerful than buyers during the trading period. They successfully drove the market price down from where it started. A bearish candle tells a story of pessimism and downward momentum. For instance, if the GBP/JPY pair opens the day at 190.50 and closes at 190.00, the candlestick for that day will be bearish.
Just like with bullish candles, the body length of a bearish candle is important. A long red body indicates strong selling conviction and suggests that the downtrend is likely to persist. It shows that sellers were in control from nearly the beginning to the end of the session. A bearish candle with a short body might point to weakening selling pressure or a potential pause in the downward move. If that short-bodied bearish candle also has a long lower wick, it reveals that buyers stepped in to defend a price level, pushing the price up from its low before the session closed. This could be an early warning that the bearish trend is losing steam.
What Are the Most Basic Single-Candle Patterns?
The most basic single-candle patterns include the Doji, which signals market indecision, and the Marubozu, which indicates strong one-sided momentum. These individual candlestick formations are valuable because they provide an immediate snapshot of market psychology without needing confirmation from subsequent candles. While complex patterns involve multiple candles, these single-candle signals can act as powerful warnings of potential trend continuations or reversals. Learning to identify them is a crucial skill for any trader using technical analysis. These simple patterns can provide powerful, immediate insights into what the market might do next.
What Is a Doji Candlestick?
A Doji candlestick is a unique pattern characterized by having an open and close price that are nearly identical. This results in a very thin or even non-existent real body, often making the candle look like a plus sign, a cross, or an inverted cross. The key takeaway from a Doji is indecision. It represents a complete standoff between buyers and sellers, where neither side could gain control and push the price in a definitive direction by the end of the period. The wicks can vary in length, but the defining feature is the tiny body.
The context in which a Doji appears is critical to its interpretation. When a Doji forms after a long uptrend, it can be a warning sign that the buying momentum is fading. Buyers are exhausted, and sellers are beginning to match their pressure, which could lead to a potential reversal or a period of consolidation. Similarly, a Doji at the end of a prolonged downtrend suggests that selling pressure is diminishing, and buyers are stepping in to halt the decline. While a single Doji isn’t a guaranteed reversal signal, it is a clear message from the market to pay close attention, as a change in trend may be imminent.
What Is a Marubozu Candlestick?
A Marubozu is the polar opposite of a Doji. It is a candlestick that has a long real body but no upper or lower wicks, or extremely short ones. The name “Marubozu” means “bald head” or “shaven head” in Japanese, referring to its lack of wicks. This pattern signals complete and utter dominance by either buyers or sellers throughout the entire trading period. It represents extreme, one-sided momentum and conviction. There are two types of Marubozu: bullish and bearish.
A Bullish Marubozu is a long green (or white) candle with no wicks. This means the opening price was the absolute low of the period, and the closing price was the absolute high. Buyers were in complete control from the opening bell to the closing bell, and there was no significant selling pressure at any point. This is a very strong bullish signal, often indicating the continuation of an uptrend or the start of a powerful reversal from a bottom. A Bearish Marubozu is a long red (or black) candle with no wicks. It signifies that the open was the high of the period and the close was the low. Sellers dominated the entire session without any meaningful opposition from buyers. It is a potent bearish signal that can confirm a downtrend or signal a sharp reversal from a top.
What Are the Advanced Candlestick Patterns and Strategies?
Advanced candlestick patterns are multi-candle formations that provide deeper insights into market psychology and potential price movements, forming the basis for complex trading strategies. Furthermore, moving beyond single candles allows traders to identify more reliable signals for potential trend reversals or continuations. These patterns tell a story about the battle between buyers and sellers over a specific period, offering clues that a single candle cannot.
What Are the Most Common Bullish Reversal Patterns?
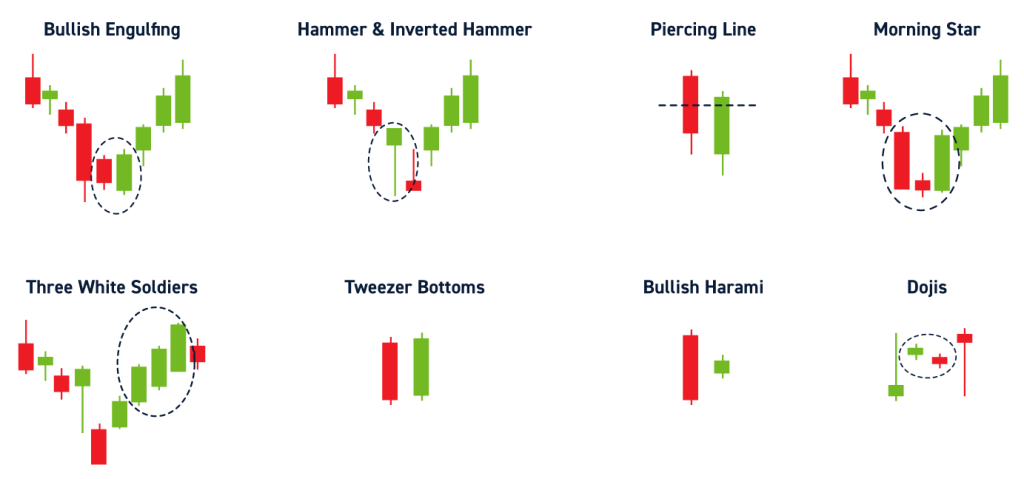
Bullish reversal patterns are formations that appear during a downtrend and signal a potential shift in momentum from sellers to buyers. They suggest that the downward price movement is losing steam and an upward trend may be about to begin. Recognizing these patterns can help traders identify potential entry points for long positions.
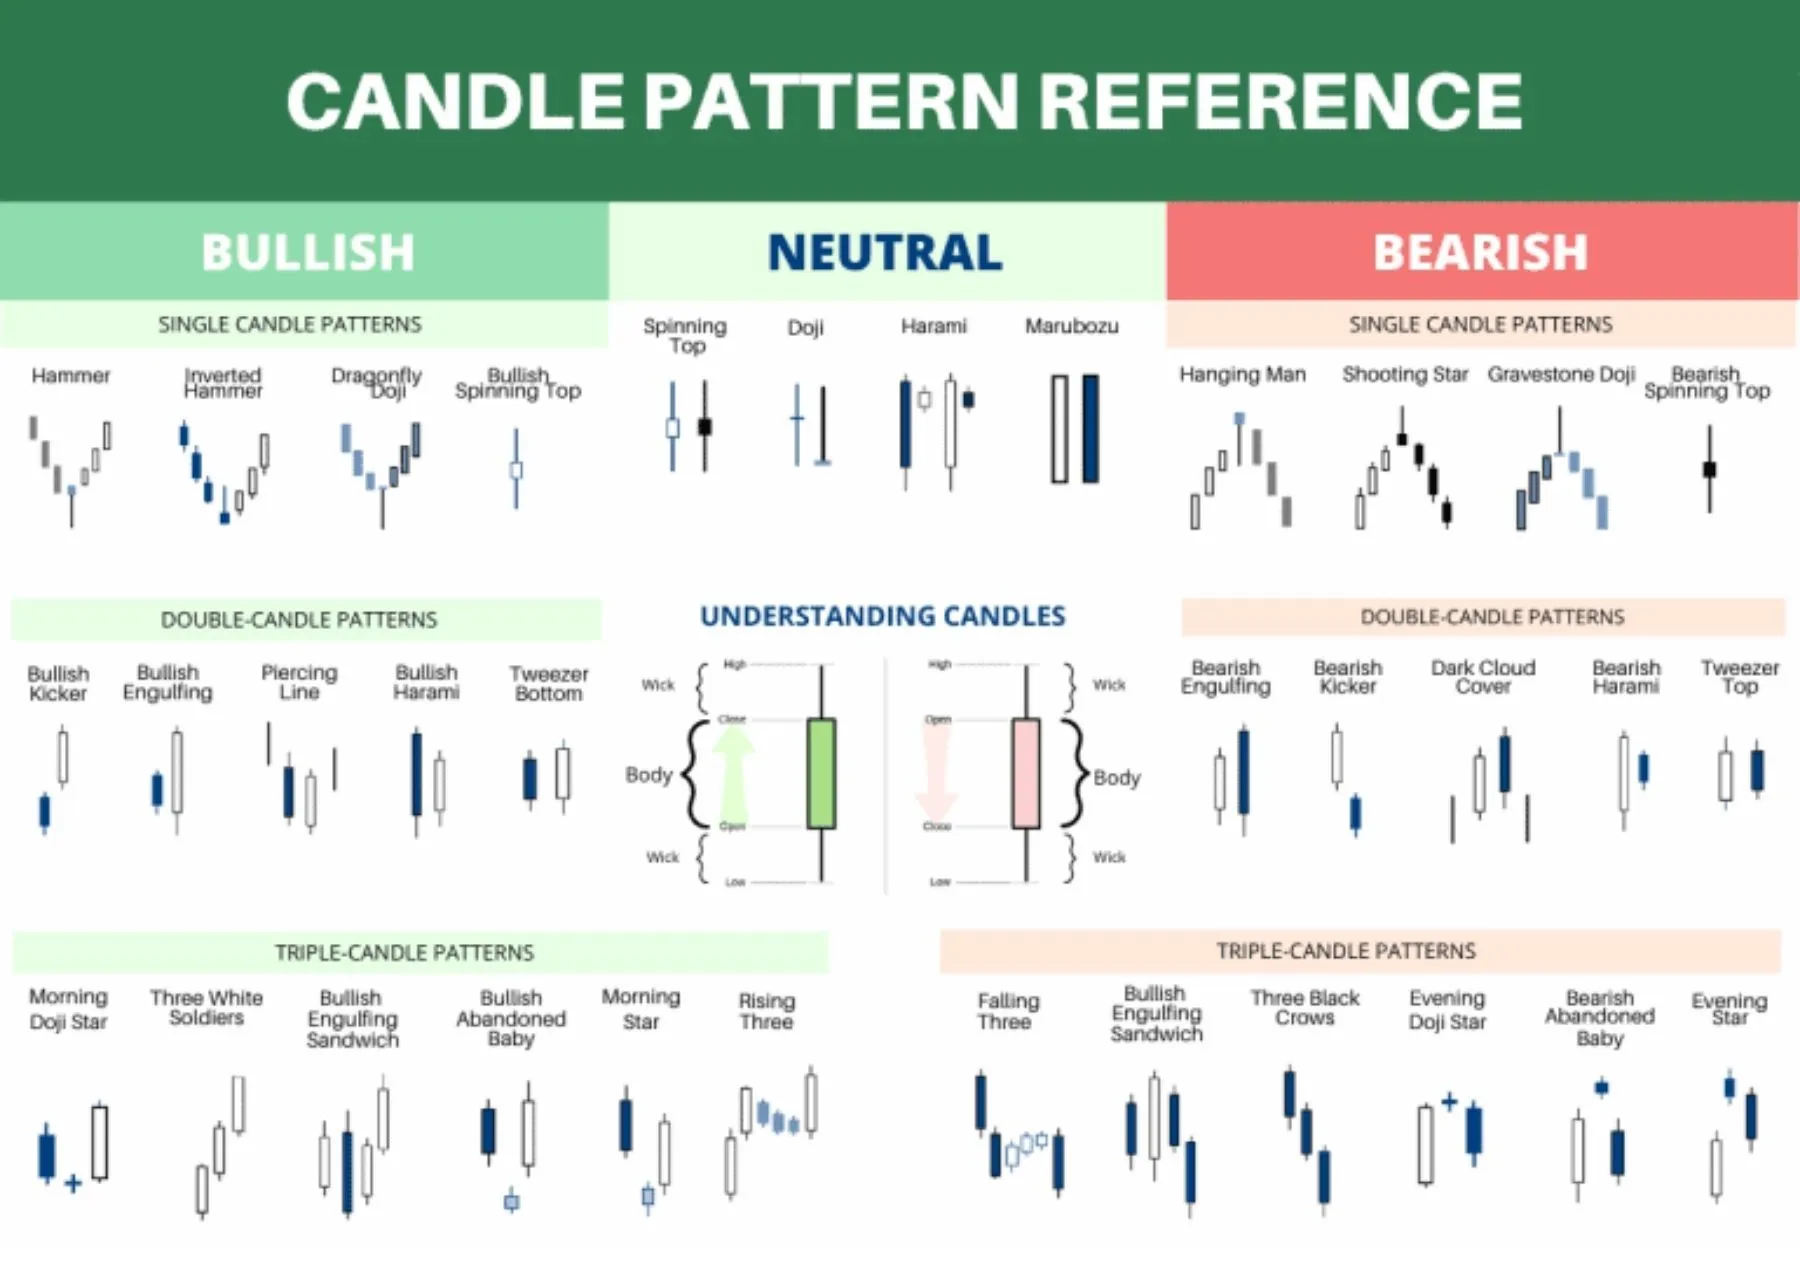
- Hammer: This pattern is formed by a single candle with a short body at the top and a long lower wick, which is at least twice the size of the body. It looks like a hammer and appears at the bottom of a downtrend. The long lower wick shows that sellers tried to push the price down, but buyers stepped in and drove the price back up to close near the open, indicating strong buying pressure.
- Bullish Engulfing: This two-candle pattern occurs when a small bearish (red) candle is followed by a larger bullish (green) candle that completely “engulfs” the previous one. This powerful signal indicates that buyers have overwhelmed sellers and are now in control, suggesting a strong potential for a price reversal upwards.
- Morning Star: This is a three-candle pattern. It starts with a long bearish candle, followed by a small-bodied candle (which can be bullish or bearish), and finishes with a long bullish candle that closes well into the first candle’s body. The small middle candle signifies market indecision, and the final green candle confirms that buyers have taken control.
What Are the Most Common Bearish Reversal Patterns?
In contrast to bullish patterns, bearish reversal patterns appear during an uptrend and warn that the upward momentum is fading. These patterns suggest that sellers are starting to overpower buyers, potentially leading to a downtrend. Traders watch for these formations to consider exiting long positions or opening short positions.
- Shooting Star: This is the bearish counterpart to the Hammer. It has a small body at the bottom and a long upper wick, appearing at the top of an uptrend. The long upper wick signifies that buyers attempted to push the price higher, but sellers aggressively entered the market and forced the price back down to close near the open. This shows that selling pressure is increasing.
- Bearish Engulfing: The opposite of its bullish counterpart, this pattern consists of a small bullish (green) candle followed by a large bearish (red) candle that completely engulfs the first. This pattern demonstrates a decisive shift in market sentiment where sellers have seized control from buyers, often preceding a sharp price decline.
- Evening Star: This is the bearish equivalent of the Morning Star. It begins with a long bullish candle, followed by a small, indecisive candle, and is completed by a long bearish candle. This three-candle formation illustrates that the preceding uptrend’s confidence has been broken, and sellers are now driving the market downwards.
What Is the Difference Between Reversal and Continuation Patterns?
Understanding the distinction between reversal and continuation patterns is fundamental to using candlesticks for strategic trading. While both provide clues about future price direction, they signal very different outcomes. Reversal patterns suggest that a prevailing trend is about to end and change direction. For example, a Bullish Engulfing pattern at the end of a long downtrend indicates the trend may reverse to an uptrend.
Continuation patterns, on the other hand, signal that the market is simply taking a pause before continuing in the same direction. They represent a temporary period of consolidation or indecision within a strong trend. An example is the Rising Three Methods pattern, which appears in an uptrend. It consists of a long bullish candle, followed by three small bearish candles that stay within the range of the first candle, and is completed by another long bullish candle. This formation shows that despite some minor selling, the buyers remain in firm control and the uptrend is likely to resume.
Are Candlestick Patterns a Reliable Indicator for Trading?
While candlestick patterns are a valuable tool for market analysis, they are not a foolproof or completely reliable indicator when used in isolation. Their effectiveness is rooted in probabilities, not certainties. A pattern may suggest a high probability of a certain price move, but there is never a guarantee. False signals are common, where a pattern forms but the expected price movement does not happen. This can occur due to unexpected news events, low trading volume, or other market forces.
The reliability of a candlestick pattern increases substantially when its context is considered. For instance, a bullish Hammer pattern is far more meaningful if it forms at a major support level than if it appears randomly in the middle of a price range. Without this additional context, a trader is essentially acting on incomplete information. Therefore, candlestick patterns should be viewed as one piece of a larger analytical puzzle rather than a standalone trading system that predicts the future with absolute accuracy.
How Can Candlestick Patterns Be Combined with Other Indicators?
To improve the accuracy of trading signals, traders often combine candlestick patterns with other technical indicators for confirmation. This multi-indicator approach helps filter out false signals and increases confidence in a trading decision. Using multiple sources of confirmation ensures that a signal is not just a random fluctuation but a reflection of genuine market sentiment.
A common strategy is to use candlestick patterns in conjunction with support and resistance levels. For example, if a Shooting Star pattern appears right at a well-established resistance level, the signal for a bearish reversal is much stronger. Another popular combination is using moving averages. A bearish engulfing pattern that forms after the price has crossed below a key moving average, like the 50-period MA, provides added confirmation of a shift to a downtrend. Furthermore, oscillators like the Relative Strength Index (RSI) are excellent confirmation tools. A bullish reversal pattern, such as a Morning Star, appearing when the RSI is in the “oversold” territory (below 30) gives a much stronger buy signal.