

Blog
What Is a Drawdown in Forex and What Are the Steps to Recover?


A forex drawdown is the reduction in your account equity from a peak to a subsequent low point, and the key steps to recover involve stopping trading to analyze mistakes, reducing position sizes, and focusing only on high-probability setups. It represents the percentage loss your capital has endured from its highest point before recovering. Every trader, regardless of skill level, will experience drawdowns; they are an unavoidable part of engaging with financial markets. The goal is not to avoid them entirely, but to manage their depth and duration.
Measuring drawdown is important because it serves as a key indicator of a trading strategy’s risk and volatility, helping you understand the potential capital reduction you might face. A strategy that generates a 50% annual return but experiences 40% drawdowns is far riskier and harder to trade psychologically than one that returns 25% with only 10% drawdowns. Understanding this metric allows you to assess risk tolerance and choose strategies that align with your financial and emotional capacity.
The main causes of a trading drawdown are a combination of poor risk management, overleveraging, and emotional trading decisions like revenge trading or FOMO. While unexpected market events can trigger losses, the most severe drawdowns are almost always a result of a breakdown in a trader’s discipline. Mechanical errors, such as risking too much on a single trade, are often rooted in psychological pressures to make back prior losses or chase unrealistic profits.
Ultimately, a drawdown is more than just a number; it is a test of your strategy’s resilience and your own mental fortitude. How you handle and recover from these periods defines your long-term success as a trader. By understanding what a drawdown is, its causes, and how to calculate it, you can create a clear, actionable plan to navigate these challenging periods and emerge a stronger, more disciplined market participant.
What Is a Drawdown in Forex Trading?
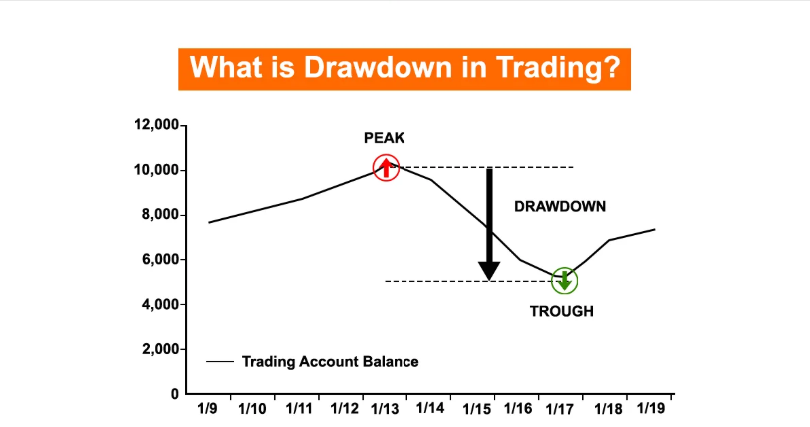
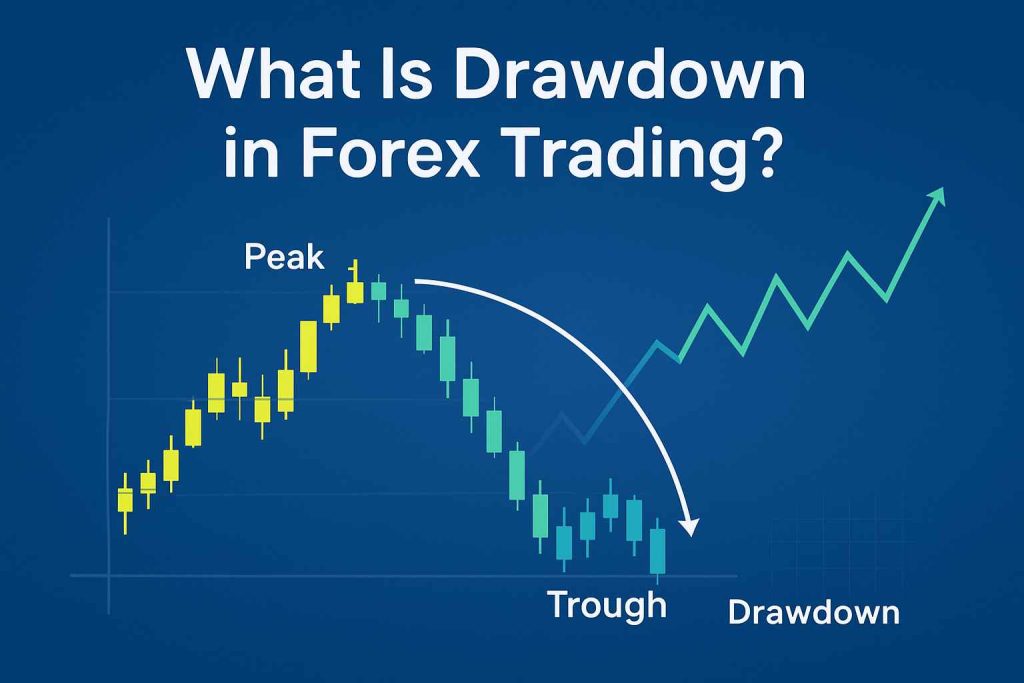
A drawdown in forex trading is the measure of decline in account equity from a peak value to a subsequent trough, indicating the financial risk of a strategy. This metric is one of the most important for evaluating the performance and risk profile of any trading system. To understand this better, think of your trading account balance as a line on a graph that moves up and down over time. A drawdown measures the drop from the highest point on that graph to the next lowest point. For instance, if your account grows from $10,000 to a peak of $12,000 and then falls to $9,000 before rising again, the drawdown is measured from the $12,000 peak to the $9,000 trough, not from your initial deposit. It’s a direct reflection of the potential loss you could experience after a period of success. This concept is fundamental because it quantifies the pain a trader must endure while executing their strategy, making it a critical factor in risk management and psychological preparation.
What Is the Difference Between a Floating Loss and a Drawdown?
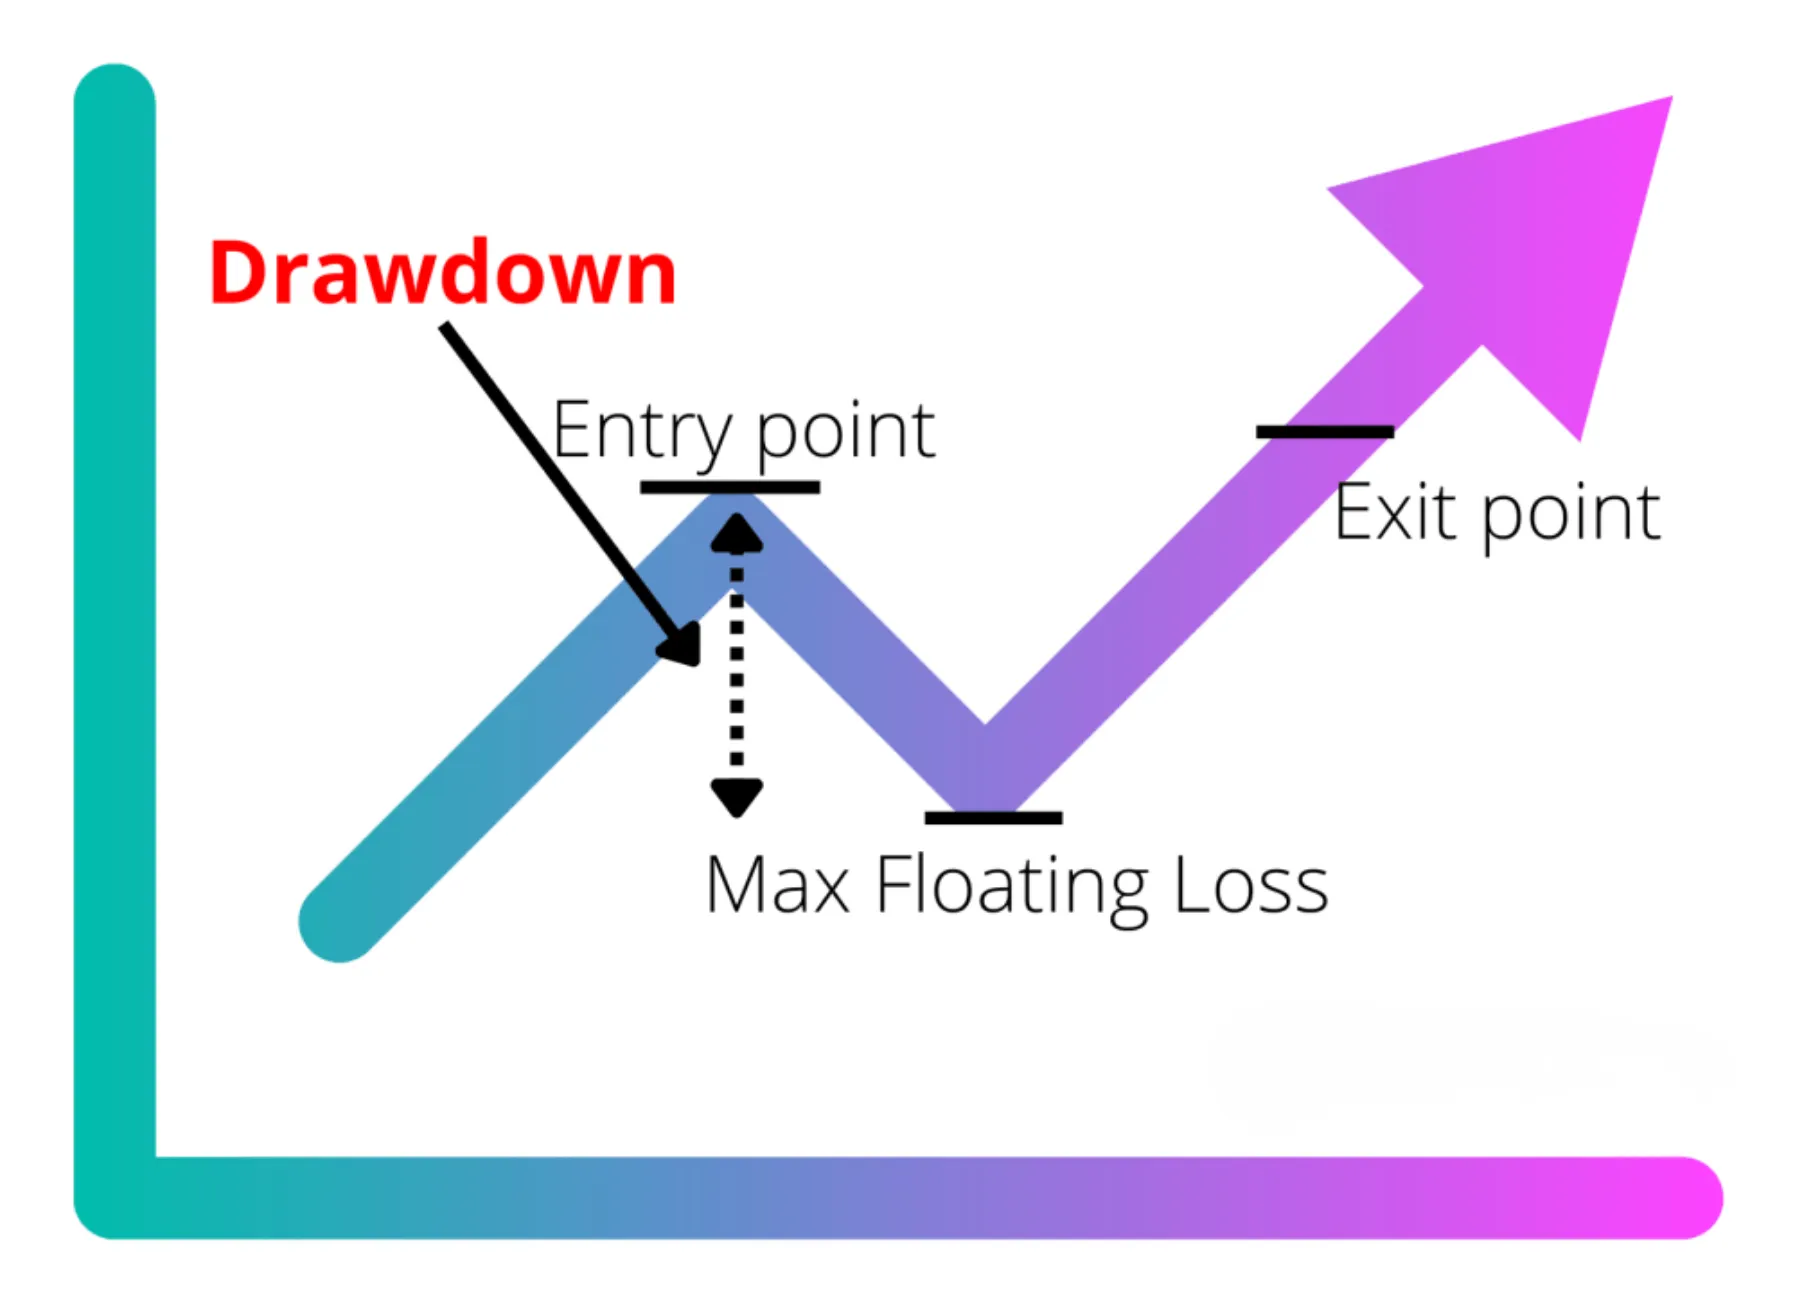
The key difference is that a drawdown measures the peak-to-trough decline of your entire account equity, while a floating loss refers to the unrealized, negative value of a single open position. A drawdown is a historical measure of your whole account’s performance, whereas a floating loss is a real-time snapshot of one trade.
For example, imagine your account equity reaches a new high of $25,000. You then open a trade on EUR/USD that currently shows a floating loss of -$500. This -$500 is not your drawdown. Your account equity is now $24,500. If you open another trade and it also goes into a loss, and your total equity drops to $22,000, your drawdown is now calculated from the $25,000 peak. The drawdown would be $3,000, or 12%. The floating losses are simply the components that contributed to this overall equity decline.
A trader could have several open positions, some with floating profits and others with floating losses. The drawdown is concerned with the net effect of all closed and open trades on the total account equity. You could even close a trade for a profit, pushing your equity to a new peak, and the very next trade could start a drawdown period. A floating loss is temporary and only becomes a realized loss when you close the trade. A drawdown, however, tracks the real impact on your account’s value, reflecting both realized and unrealized losses from a high-water mark.
Why Is Measuring Drawdown Important for a Trader?
Measuring drawdown is essential because it is a primary indicator of a trading strategy’s inherent risk and volatility. It provides a realistic expectation of the potential losses you might face while following a particular system. Without this information, a trader is essentially flying blind, unaware of how much capital they might need to weather the inevitable losing streaks. For instance, a strategy with a historical maximum drawdown of 30% tells you that you must be prepared to see your account value decrease by nearly a third at some point. If your risk tolerance is only 15%, this strategy is not suitable for you, no matter how profitable it appears on paper.
Furthermore, drawdown is a critical metric for self-assessment and psychological management. Knowing your strategy’s typical drawdown helps you stay disciplined during losing periods. When a 10% drawdown occurs, a trader who knows this is within the historical norm is less likely to panic, abandon their strategy, or make emotional mistakes like “revenge trading.” They can trust the process. Conversely, if the drawdown exceeds historical limits, it serves as a clear signal that something is wrong, either with the strategy or the current market conditions, prompting a necessary re-evaluation.
Finally, professional investors and proprietary trading firms place immense weight on drawdown figures. When evaluating a trader or an automated system, the maximum drawdown is often considered more important than the total return. A smooth equity curve with low drawdowns demonstrates consistency and robust risk management. It shows that a trader can generate profits without exposing their capital to catastrophic risk, which is the hallmark of a professional and sustainable trading career.
What Are the Main Causes of a Trading Drawdown?
The main causes of a trading drawdown are poor risk management, overleveraging, flawed strategy execution, and psychological factors like emotional trading. While it is easy to blame the market for losses, the most significant drawdowns are almost always rooted in a trader’s own actions or lack of preparation. These factors can work in isolation or, more commonly, combine to create a perfect storm that rapidly erodes account equity. For instance, a string of losses due to normal market fluctuations can trigger an emotional response, leading a trader to double down with excessive leverage in an attempt to win back the money quickly. This combination of a psychological trigger and a mechanical risk management failure is a classic recipe for a deep drawdown. Let’s explore the psychological and mechanical drivers in more detail.
What Role Does Trading Psychology Play in Drawdowns?
Trading psychology is arguably the single largest contributor to severe drawdowns because it influences every decision a trader makes. Emotions can override even the most well-defined trading plan. One of the most destructive emotional behaviors is revenge trading. After taking a frustrating loss, a trader may feel the market has “taken” something from them and feel an urgent need to get it back. This leads to abandoning their strategy, taking impulsive, low-probability trades, and often increasing position sizes, which turns a small, manageable loss into a devastating one.
Another major psychological pitfall is the Fear of Missing Out (FOMO). This occurs when a trader sees a currency pair making a strong move and jumps in without proper analysis, fearing they will miss out on a big profit. These entries are typically late, occurring near points of exhaustion where the market is likely to reverse. This leads to immediate losses and contributes to the drawdown.
Finally, the inability to accept a loss is a common psychological flaw driven by ego. A trader might enter a position that quickly moves against them. Instead of closing the trade and accepting the small, planned loss as defined by their stop-loss, they hold on, hoping it will turn around. They might even move their stop-loss further away, allowing the loss to grow exponentially. This single behavior of not respecting stop-losses is responsible for some of the most catastrophic account blow-ups and is a direct path to a deep drawdown.
How Do Poor Risk Management and Overleveraging Cause Drawdowns?
While psychology provides the “why,” poor risk management provides the “how” behind major drawdowns. These are the mechanical errors that translate bad decisions into significant financial damage. The most fundamental error is risking too much per trade. Professional traders often advise risking no more than 1-2% of account capital on any single trade. A trader risking 10% per trade only needs a few consecutive losses to face a 30-40% drawdown, a level from which recovery is mathematically and psychologically difficult. With 1% risk, that same losing streak results in a much smaller, manageable drawdown.
Overleveraging is another primary cause. Forex brokers offer high leverage, which allows traders to control large positions with a small amount of capital. While this amplifies potential profits, it also magnifies losses at the same rate. Using excessive leverage means that even a small price movement against your position can result in a substantial loss relative to your account size. For example, with 100:1 leverage, a 1% move against you results in a 100% loss of the margin used for that trade. This volatility can quickly trigger a margin call and liquidate positions, cementing a massive drawdown.
Lastly, the incorrect use of stop-loss orders is a critical mechanical failure. A stop-loss is a trader’s primary defense mechanism. Failing to use one is like driving without brakes. Similarly, setting a stop-loss that is too tight on a volatile pair can lead to being stopped out prematurely before the trade has a chance to work. Conversely, setting it too wide invalidates the risk-to-reward ratio. The worst mistake, as mentioned earlier, is moving a stop-loss to accommodate a losing trade. Proper risk management involves defining your exit point before you enter and sticking to it, no matter what.
How Do You Calculate a Forex Drawdown?
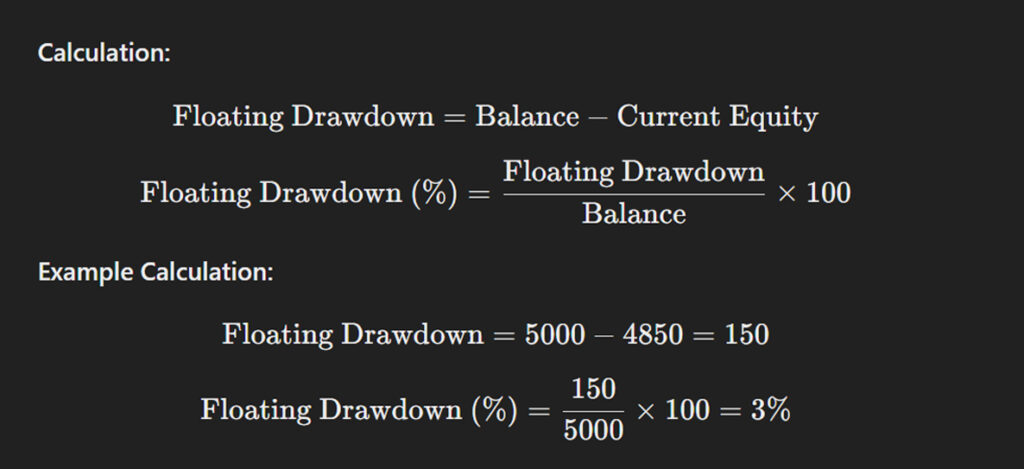
To calculate a forex drawdown, you find the difference between a peak equity point and a subsequent low point, then express it as a percentage of the peak equity. This calculation is straightforward and provides a clear, quantitative measure of the risk associated with your trading strategy. It helps you move beyond a simple win/loss ratio to understand the real-world volatility and potential pain involved in your trading. For example, knowing you have a 60% win rate is good, but if your strategy also has a 50% maximum drawdown, it’s an extremely risky system. The calculation itself is simple, but it is vital to distinguish between different types of drawdowns to get a complete picture of your performance. Let’s break down the most common formulas and types.
What Is the Formula for Peak-to-Valley Drawdown?
The most common and useful way to measure drawdown is the peak-to-valley method, often referred to as Relative Drawdown or Maximum Drawdown. It quantifies the largest percentage drop your account has experienced from any high point.
The formula is:
Drawdown (%) = ( (Peak Equity – Trough Equity) / Peak Equity ) * 100
Here’s a simple example to illustrate it.
1. You start with an initial deposit of $10,000.
2. After a series of successful trades, your account equity grows to a new peak of $15,000. This is your Peak Equity.
3. The market turns, and you experience a losing streak. Your account equity falls to $11,250. This is your Trough Equity.
4. You then start winning again, and your account begins to recover.
To calculate the drawdown experienced during this period, you would apply the formula:
- Drawdown = ( ($15,000 – $11,250) / $15,000 ) * 100
- Drawdown = ( $3,750 / $15,000 ) * 100
- Drawdown = 0.25 * 100
- Drawdown = 25%
This tells you that your strategy subjected your capital to a 25% loss from its highest point. This is the figure most traders and investors use to assess the risk of a trading system.
What Is the Difference Between Absolute and Relative Drawdown?
While Relative Drawdown is the most common, it’s also helpful to understand Absolute Drawdown, as they measure two different aspects of risk.
Relative Drawdown (or Peak-to-Valley Drawdown) measures the drop from the highest equity peak to the subsequent lowest trough, as explained above. It reflects the volatility and risk inherent in the trading strategy itself, regardless of your starting capital. It answers the question: “What is the biggest loss I can expect after a winning period?” This is the most important metric for evaluating a strategy’s performance over time because it shows its resilience.
Absolute Drawdown, on the other hand, measures how far your account equity has dropped below your initial deposit. The calculation only considers your starting capital as the peak.
The formula is:
Absolute Drawdown (%) = ( (Initial Deposit – Lowest Equity) / Initial Deposit ) * 100
Using our previous numbers:
- Initial Deposit: $10,000
- Lowest Equity Point in the account’s history: Let’s say it dropped to $9,000 at one point.
- Absolute Drawdown = ( ($10,000 – $9,000) / $10,000 ) * 100 = 10%
If your account equity never falls below your initial $10,000 deposit, your Absolute Drawdown is 0%, even if you experience a large Relative Drawdown (e.g., from a peak of $20,000 down to $15,000). Absolute Drawdown specifically answers the question: “How much of my initial investment was at risk?” It’s a measure of capital preservation from day one.
What Are the Key Steps to Recover from a Drawdown?
The key steps to recover from a drawdown are to immediately stop trading, analyze your losing trades, reduce your risk and position size, and rebuild your confidence with small wins. A drawdown is both a financial and an emotional event, and a successful recovery requires addressing both aspects. Trying to aggressively trade your way out of a drawdown is the fastest way to make it worse. Instead, a structured, defensive, and analytical approach is required. This process is not about making back the money quickly; it is about restoring discipline, validating your strategy, and slowly rebuilding your account and your mental capital. Following a clear plan removes emotion from the equation and puts you back in control of your trading.
Should You Stop Trading Immediately After a Major Drawdown?
Yes, you should absolutely stop trading for a period after experiencing a major drawdown. Continuing to trade while in a state of emotional distress is a recipe for disaster. When you are in a drawdown, you are not thinking clearly. Your judgment is likely clouded by frustration, anger, or a desperate need to “get even” with the market. This emotional state leads to impulsive decisions, breaking your trading rules, and taking on excessive risk, which only digs the hole deeper. This is often called a “drawdown spiral.”
Taking a break, whether for a few days or a week, serves several critical purposes. First, it acts as a circuit breaker, preventing you from making further emotional mistakes. Second, it allows time for the negative emotions to subside, so you can approach the problem with a clear and analytical mindset. You cannot effectively diagnose what went wrong if you are still in the heat of the battle. The goal of this break is to shift your focus from the outcome (the money lost) to the process (the decisions that led to the loss). By stepping away from the charts, you give yourself the mental space needed to conduct a proper post-mortem of your trading performance without the pressure of needing to place the next trade.
How Can You Create a Drawdown Recovery Plan?
A drawdown recovery plan is a systematic checklist that guides your return to trading. It focuses on capital preservation and rebuilding confidence through disciplined execution. Here are the essential steps to include in your plan:

1. Analyze Your Losing Trades.
This is the most important step. Go through your trading journal or platform history and review every losing trade that contributed to the drawdown. Ask yourself critical questions: Did I follow my trading plan? Was my analysis sound? Did I move my stop-loss or exit too early? Was this a strategic failure or a psychological one? You must identify the root cause. If your strategy is flawed, it needs fixing. If your discipline broke down, you need to address that behavior.
2. Reduce Your Position Size.
When you resume trading, do not use your previous position size. Cut your risk per trade significantly, perhaps in half (e.g., from 2% risk to 1%) or even more. Trading with a smaller size reduces financial and psychological pressure. The goal is no longer to hit home runs and recover quickly; it is to get back into a rhythm of executing your plan flawlessly. Small, consistent wins are powerful confidence builders.
3. Re-evaluate Your Trading Strategy.
Does your strategy still hold an edge in the current market conditions? Markets change, and a strategy that worked well in a trending market may fail in a ranging one. You may need to adjust your strategy’s parameters, be more selective with your setups, or even switch to a different approach temporarily. This might involve more rigorous backtesting or trading on a demo account to validate any changes before risking real capital again.
4. Focus on High-Probability Setups Only.
Become extremely selective. During a recovery phase, you should only be taking your absolute best, “A+” trade setups. These are the trades that align perfectly with every rule in your trading plan. Avoid marginal or ambiguous setups. Being patient and waiting for the perfect opportunity reinforces discipline and increases your probability of success, which is crucial for rebuilding your confidence one trade at a time.
5. Set Realistic Recovery Goals.
Do not fixate on recovering the entire drawdown in a short period. This creates undue pressure. Instead, set small, process-oriented goals. For example, your goal might be to have five consecutive trades where you follow your plan perfectly, regardless of the outcome. Or, aim for a single profitable week, even if the profit is only 0.5%. By focusing on disciplined execution rather than the monetary target, the financial recovery will naturally follow.
What Else Should You Know About Managing Forex Drawdowns?
Effective drawdown management involves understanding different drawdown types, implementing preventative risk rules, and developing psychological resilience. Furthermore, traders must recognize how drawdown relates to their specific strategy, risk tolerance, and performance metrics like the risk-to-reward ratio.
What Are the Different Types of Drawdowns Traders Monitor?
To properly evaluate a trading strategy, traders monitor several types of drawdowns, each offering a unique perspective on performance and risk. The most common metric is the Maximum Drawdown (MDD), which represents the largest single peak-to-trough drop in account equity. It shows the worst historical loss a strategy has endured, giving a clear picture of its maximum pain point. Another useful metric is the Average Drawdown. This calculates the average of all drawdown periods, providing a more typical expectation of the losses you might encounter. A strategy could have a high MDD from one rare event but a very low average drawdown, suggesting overall stability. Lastly, Drawdown Duration measures the time it takes for an account to recover from a loss and reach a new equity peak. This is critical for understanding how long your capital might be tied up in a recovery phase. A strategy that recovers quickly is often preferable to one that stays “underwater” for months.
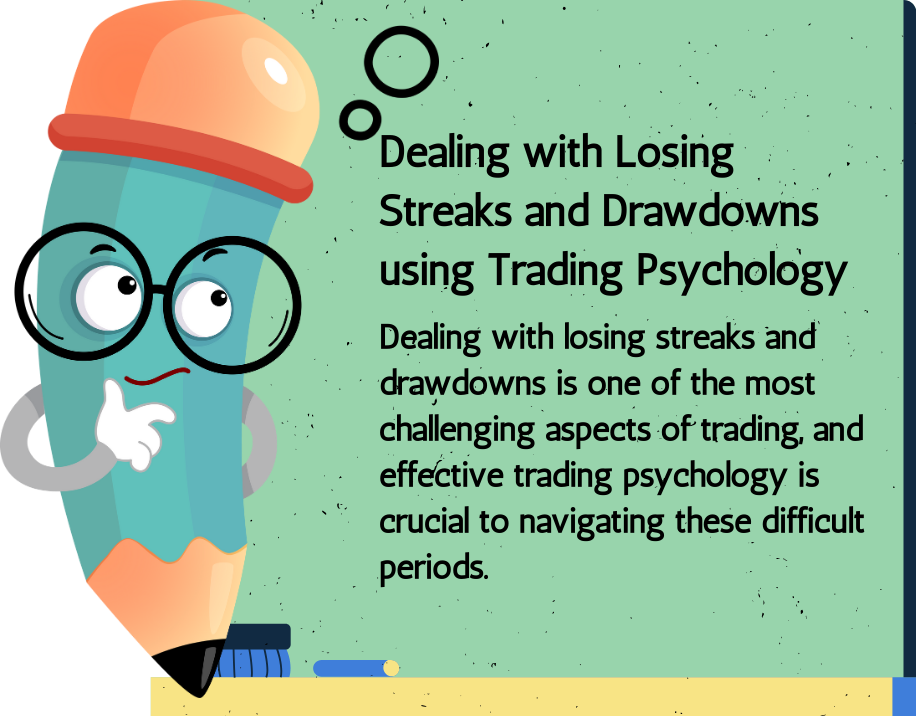
Analyzing these different drawdown types gives you a more complete risk profile.
- Maximum Drawdown highlights the worst-case scenario.
- Average Drawdown shows the typical losing periods.
- Drawdown Duration reveals how long recovery might take.
How Do You Mentally Cope with a Trading Drawdown?
Managing the psychological impact of a drawdown is as important as managing the financial side. A string of losses can trigger fear, self-doubt, and anxiety, leading to poor decisions like “revenge trading” or abandoning a perfectly good strategy at the worst possible time. The first step is to maintain a detailed trading journal. Documenting every trade, including your reasoning and emotional state, helps objectify your performance. During a drawdown, reviewing your journal can reinforce that such periods are a normal, backtested part of your system. It shifts your focus from emotional reactions to analytical review. Another key strategy is to stick to your predefined trading plan. You created this plan with a clear, rational mind. A drawdown is not the time to improvise. Trusting your rules and execution provides a framework that protects you from impulsive actions. Finally, do not be afraid to step away from the charts. Taking scheduled breaks or practicing mindfulness can help detach your self-worth from your account balance and prevent emotional burnout.
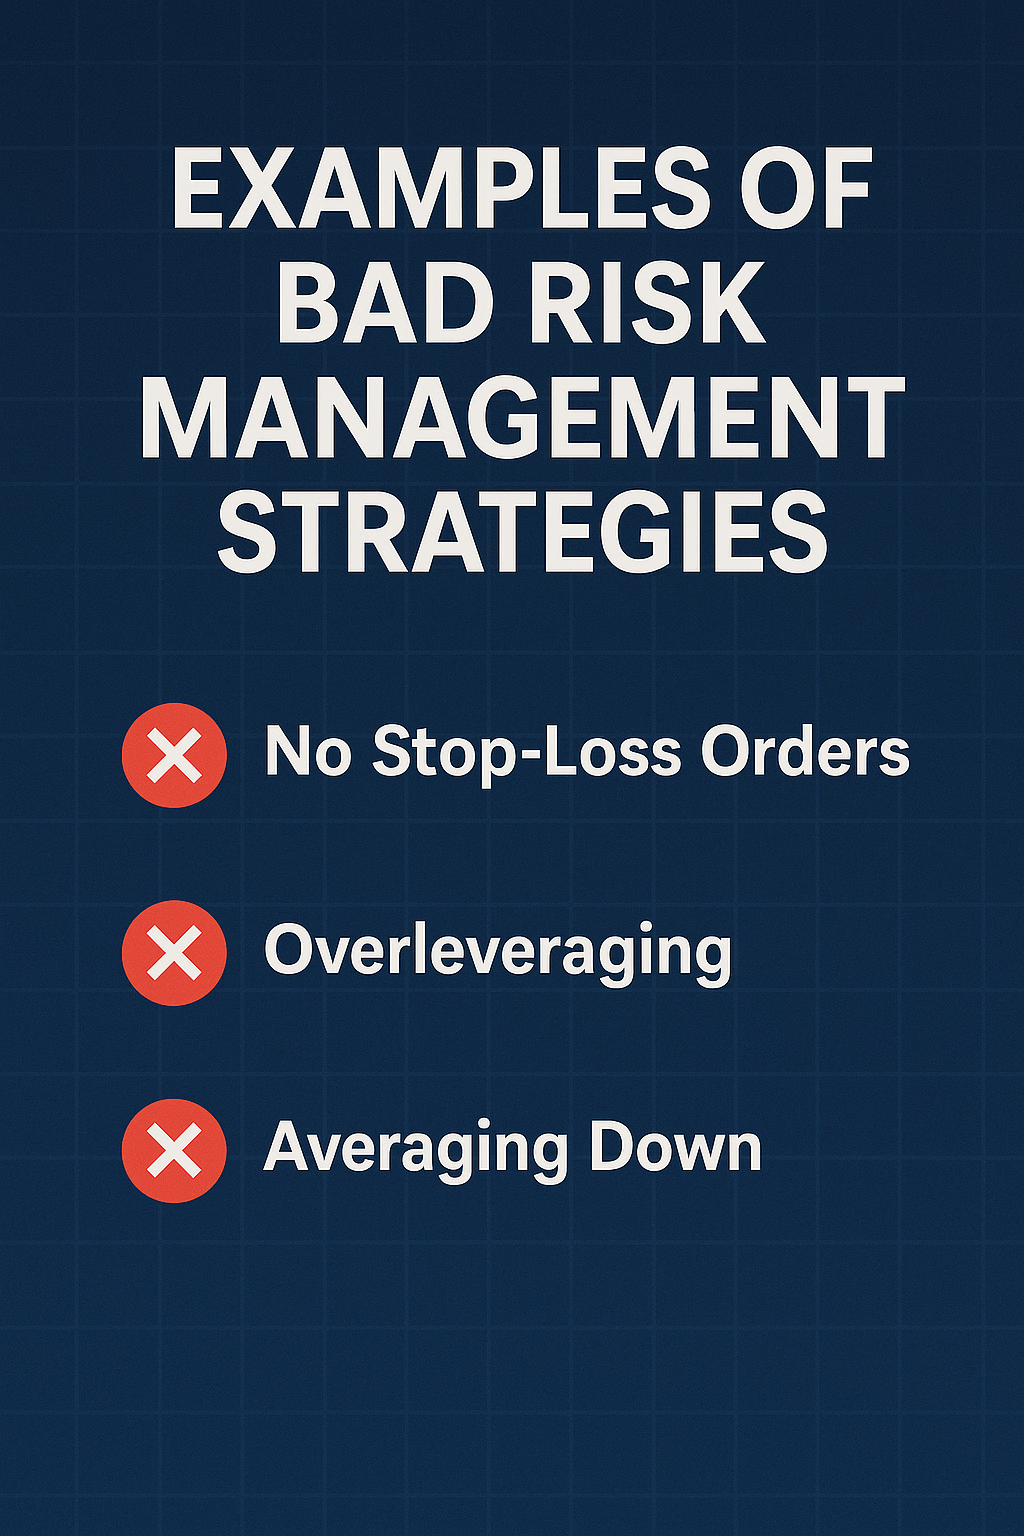
These mental strategies help you navigate difficult periods with discipline.
- Maintain a journal to stay objective and analytical.
- Adhere strictly to your trading plan to avoid emotional errors.
- Take breaks to clear your mind and reduce stress.
What Risk Management Rules Help Prevent Future Drawdowns?
While you cannot eliminate drawdowns entirely, you can implement strict risk management rules to control their size and frequency. The most fundamental of these is the 1% rule, which dictates that you should never risk more than 1% of your total trading capital on any single trade. This simple guideline ensures that no single loss can significantly harm your account. Even a streak of ten consecutive losses would only result in a manageable drawdown of less than 10%. Another powerful tool is setting a maximum loss limit. This acts as a circuit breaker, forcing you to stop trading for the day or week once a certain loss threshold is reached, for example, 3% of your account. This prevents a single bad day from turning into a catastrophic week by removing you from the market when you are likely not in a good state to trade. These rules are enforced through proper position sizing, where the size of your trade is calculated based on your stop-loss distance and the 1% risk amount, ensuring consistent risk exposure across all trades regardless of market volatility.
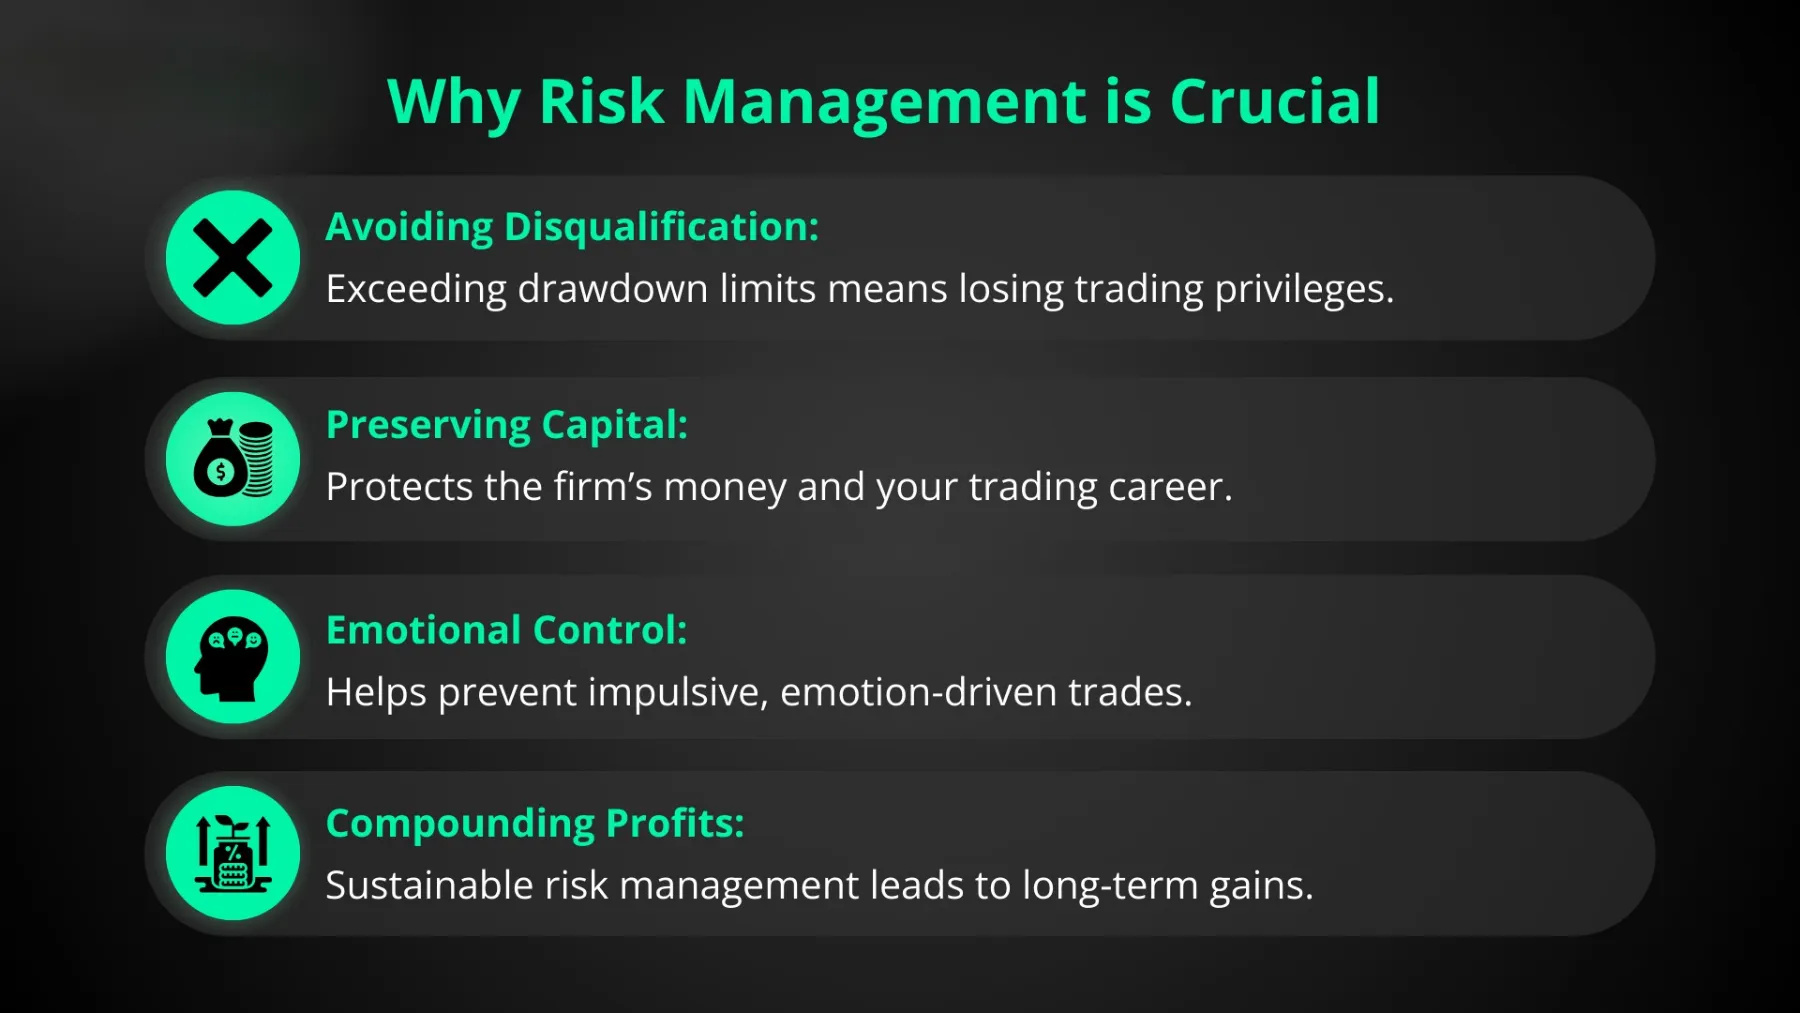
Proactive risk management is the best defense against severe drawdowns.
- Limit risk on any single trade to 1% of your capital.
- Set a hard stop on your trading activities after a certain daily or weekly loss.
- Calculate position size based on your stop loss and risk percentage.
What Is Considered an Acceptable Drawdown Percentage in Forex?
There is no universal answer for an acceptable drawdown percentage, as it depends heavily on individual circumstances and goals. The primary factor is a trader’s personal risk tolerance. An aggressive trader aiming for high returns of 50% or more annually might be comfortable with a maximum drawdown of 30-40%, viewing it as the cost of achieving high growth. In contrast, a conservative trader or retiree looking for steady, modest gains of 10% per year might find any drawdown over 15% to be unacceptable. The trading strategy itself also sets expectations. For instance, a long-term swing trading strategy might naturally experience deeper drawdowns as positions are held through significant market swings, whereas a high-frequency scalping strategy may have very small but frequent drawdowns. Institutional funds and professional prop firms often have strict, mandated limits, frequently capping maximum drawdown at 10-20% to protect investor capital. For most independent retail traders, a maximum drawdown below 25% is often considered a reasonable target to aim for.
Ultimately, an acceptable drawdown is one that allows you to continue trading your system without emotional distress.
- Your personal risk appetite dictates what you can tolerate.
- Different trading styles have different inherent drawdown characteristics.
- Many traders aim to keep their maximum drawdown below 25%.
How Does Drawdown Relate to Your Strategy’s Risk-to-Reward Ratio?
A strategy’s drawdown profile is intrinsically linked to its risk-to-reward ratio (R:R), which compares the potential loss of a trade (risk) to its potential profit (reward). Strategies that target a high risk-to-reward ratio, such as 1:3 or greater, can often recover from drawdowns more quickly. Because a single winning trade can erase three or more losses, the account can reach a new equity high even with a low win rate. However, this structure also means that such strategies can be prone to longer losing streaks, which can lead to deeper drawdowns before a large winning trade turns things around. Conversely, strategies with a low risk-to-reward ratio, like 1:1 or even 2:1 (risking $2 to make $1), require a very high win rate to be profitable. These systems tend to have shallower, more frequent drawdowns. The danger is that a rare but statistically expected losing streak can wipe out the profits from many previous winning trades, making recovery a slow and difficult process.

Understanding this relationship helps you align your strategy with your psychological profile.
- High R:R strategies may have deep drawdowns but recover quickly.
- Low R:R strategies often have smaller drawdowns but can struggle to recover from losing streaks.
- Your tolerance for losing streaks should influence the R:R profile you choose.