

Blog
How to Read and Use a Forex Economic Calendar for Trading

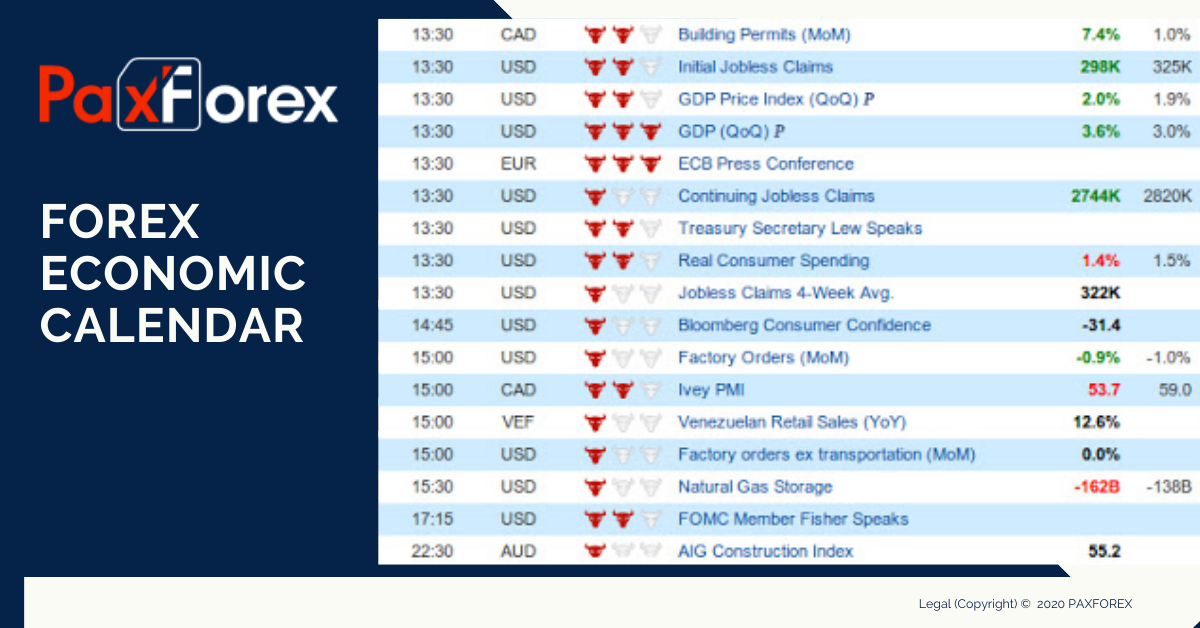
To effectively read and use a forex economic calendar, you must first interpret the key components of each entry, including the event name, its impact level, and the difference between the ‘Actual’ and ‘Forecast’ data. You then use this information by planning trades around high-impact events to manage risk or by capitalizing on significant data surprises that can trigger market volatility and create trading opportunities. This two-step process of interpretation followed by application is fundamental to integrating economic news into your trading strategy.
A forex economic calendar is a real-time schedule of upcoming economic news releases and macroeconomic data reports that are known to affect currency valuations. Think of it as a forward-looking timetable for financial markets. It lists events from around the globe, such as interest rate decisions, inflation reports, and employment figures, giving traders advanced notice of when potentially market-moving information will be released. This allows for proactive planning rather than reactive trading.
The calendar is essential for forex traders because it helps them anticipate periods of high market volatility, manage risk appropriately, and identify potential trading setups based on economic data outcomes. By knowing when a major report is due, a trader can decide whether to avoid the market’s potential chaos or to specifically trade the news release. This foreknowledge is a powerful tool for protecting capital and finding profitable entry and exit points.
Ultimately, mastering the economic calendar transforms a trader from a passive market participant into an informed strategist. It provides the context behind currency movements, helping you understand why a market is moving, not just that it is moving. Let’s explore how to break down the calendar’s components and apply them directly to your trading decisions.
What Is a Forex Economic Calendar?
A forex economic calendar is a chronological schedule of upcoming economic news releases from various countries, which provides traders with data that can influence currency prices. It serves as a foundational tool for fundamental analysis, allowing traders to track macroeconomic events that directly impact a nation’s economic health and, consequently, the value of its currency. Instead of being caught off guard by sudden price spikes or drops, traders can consult the calendar to see what data is scheduled for release, at what time, and which currencies are likely to be affected. This includes everything from central bank announcements and inflation data to employment statistics and manufacturing reports. The primary purpose is to provide a clear, forward-looking view of events that can inject volatility into the forex market, helping traders prepare, manage risk, and spot potential opportunities.
Why Is an Economic Calendar Essential for Forex Traders?
An economic calendar is essential for forex traders because it is a primary tool for managing risk and identifying opportunities. The forex market is heavily influenced by the economic health of countries, and the calendar is the schedule that tells you exactly when new health reports are coming out.

First and foremost, the calendar is a risk management tool. High-impact news releases, such as central bank interest rate decisions or Non-Farm Payrolls reports, can cause extreme and immediate volatility. Prices can move hundreds of pips in seconds, potentially triggering stop-losses or causing significant slippage. By consulting the calendar, you know when these events are happening. This knowledge allows you to make informed decisions, such as reducing your position size, widening your stop-loss to account for the volatility, or even closing your trades entirely before the release to avoid the unpredictable market reaction. Ignoring the calendar is like sailing in the ocean without checking the weather forecast; you might be fine, or you might sail directly into a hurricane.
Second, the calendar is a source of trading opportunities. While some traders avoid news, others specialize in trading it. A significant deviation between the forecasted data and the actual released figure can create a strong, directional move in a currency pair. For instance, if inflation data comes in much higher than analysts predicted, it might signal that the central bank will raise interest rates sooner than expected. This can cause the country’s currency to strengthen rapidly. Traders who understand this relationship can position themselves to profit from these moves. The calendar provides the setup, and the data release provides the trigger for these trading strategies. Without it, you would miss these potentially profitable, event-driven market movements.
What Types of Information Does an Economic Calendar Provide?
A typical economic calendar provides several core data points for each scheduled event, presented in a clear, standardized format. Understanding each piece of information is the first step to reading the calendar correctly. These components work together to give you a complete picture of an upcoming news release.
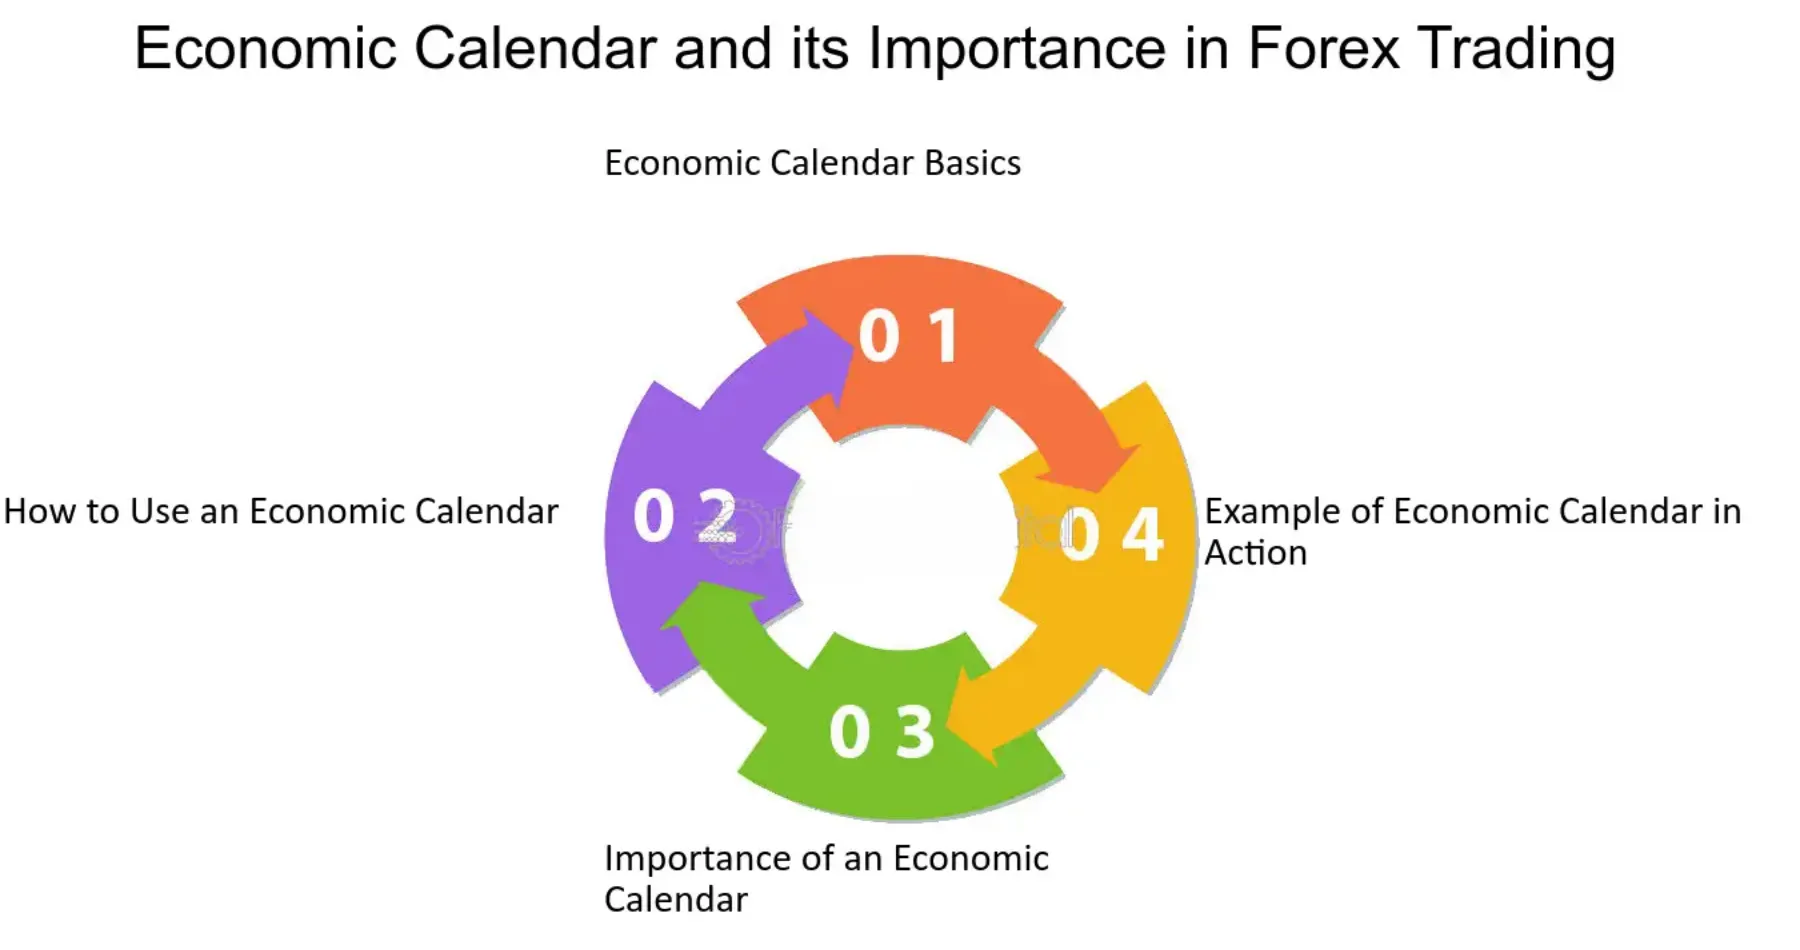
Here are the key types of information you will find on most economic calendars:
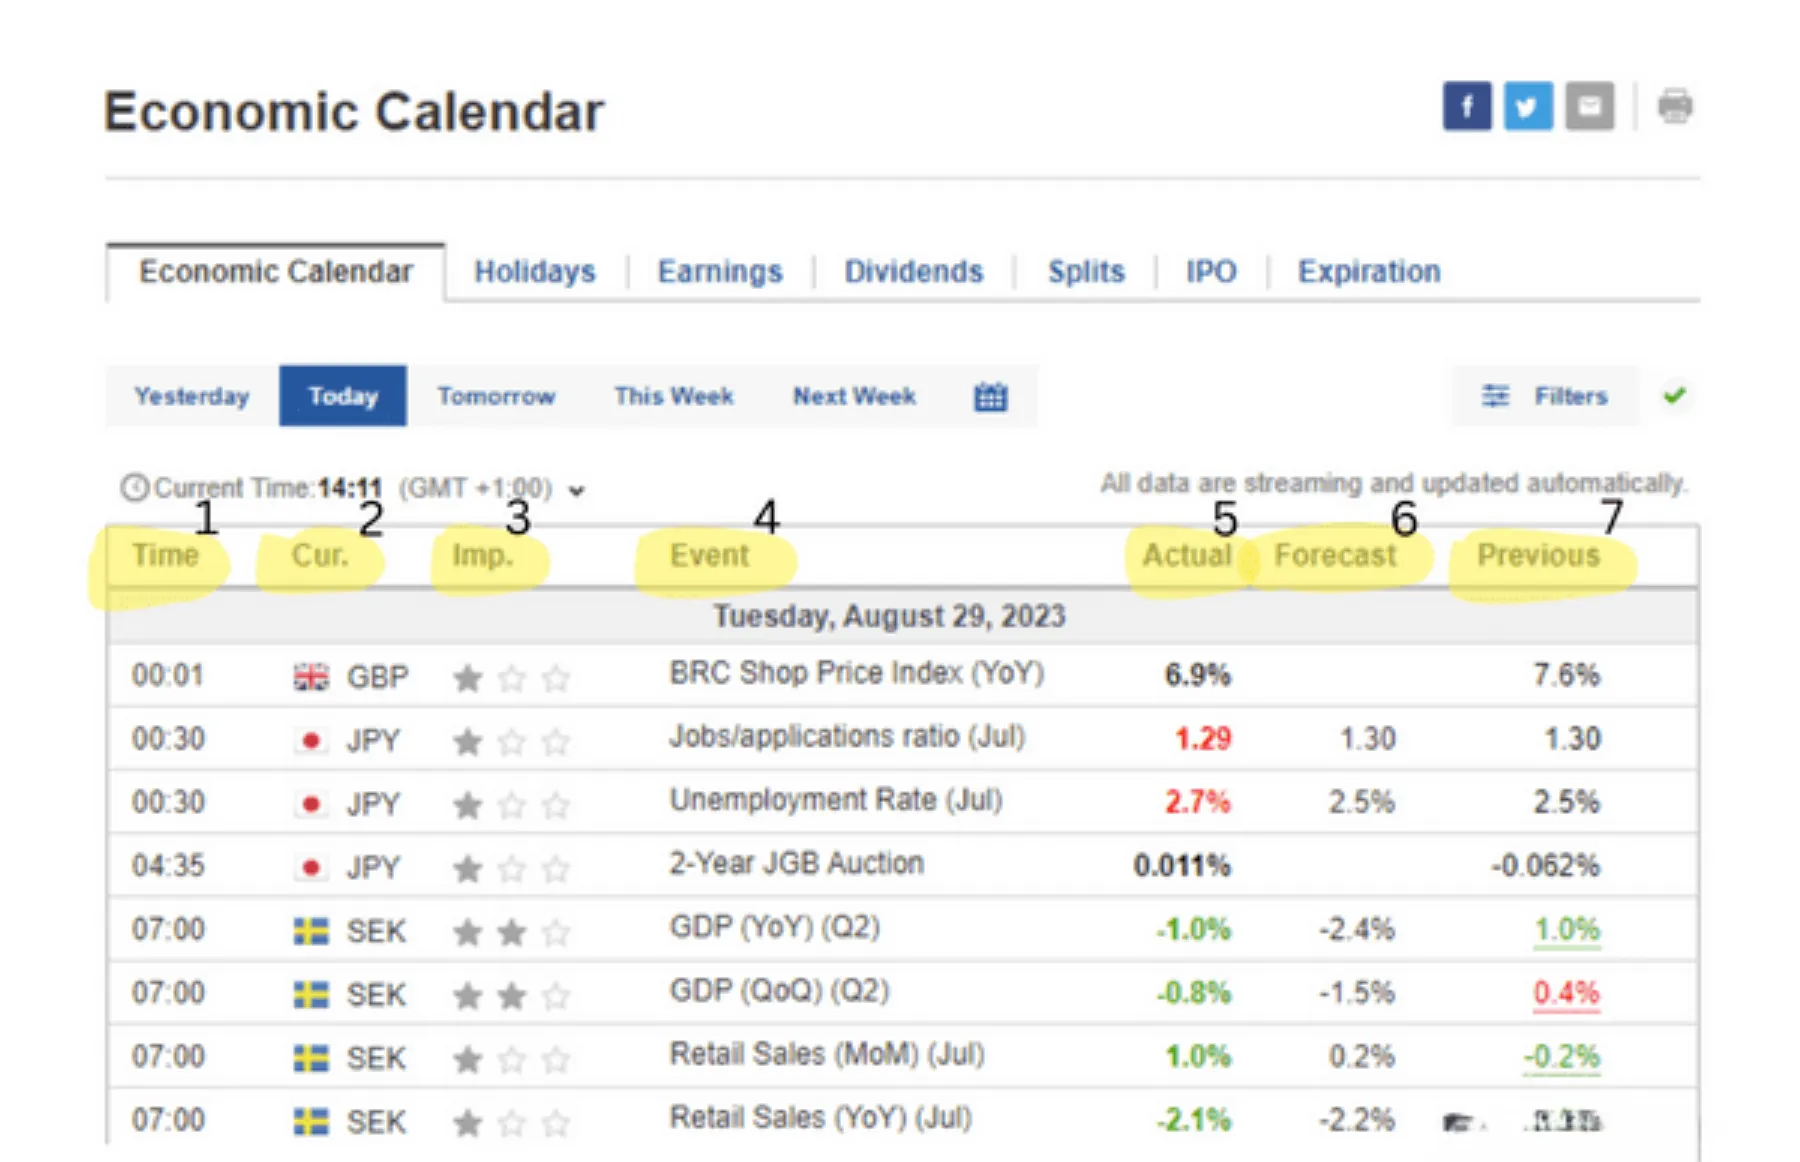
- Date and Time: This shows the exact date and time the economic data is scheduled for release. Most calendars allow you to set the timezone to your local time, which is very important for accurate timing.
- Currency: This specifies the currency, and by extension the country, that the data release pertains to. It is usually represented by its three-letter ISO code, such as USD (United States Dollar), EUR (Euro), or JPY (Japanese Yen). This tells you which currency pairs will be most directly affected.
- Event Name: This is the name of the specific economic report or announcement, for example, “Consumer Price Index (CPI),” “Gross Domestic Product (GDP),” or “Interest Rate Decision.”
- Impact: This is a visual rating of the event’s potential to move the market. It is often color-coded or uses symbols (like stars or bullhorns) to indicate High, Medium, or Low impact. High-impact events are the ones that traders watch most closely.
- Actual: This field is initially blank and is populated with the official data figure the moment it is released. This is the “real” number.
- Forecast: This shows the consensus estimate from market analysts and economists for the upcoming data release. The market often prices in this expected number ahead of the release.
- Previous: This shows the result from the last time this particular report was released (e.g., last month or last quarter). It provides context for the current data.
What Are the Key Components to Read on an Economic Calendar?
There are six key components to read on a calendar entry: the event time and date, the affected currency, the event name, its impact level, and the previous, forecast, and actual data figures. Each component provides a specific piece of the puzzle, and reading them together allows a trader to build a complete picture of a potential market-moving event. Understanding how to interpret each element is the foundation of using the calendar for trading. You start by identifying the event and its importance, then analyze the numerical data to gauge the market’s likely reaction. Let’s explore how each of these components contributes to your analysis and decision-making process, turning a simple schedule into a powerful trading tool.
How Do You Interpret Event Impact Levels?
Interpreting event impact levels is one of the quickest and most effective ways to filter the noise on an economic calendar. Most calendars use a simple, visual system to classify events, typically with colors or symbols, to indicate how much market volatility is expected upon the data release. This allows you to immediately see which events demand your attention and which can likely be ignored.

The most common system includes three tiers:
- High Impact: Often marked in red or with three stars/bulls. These are the most important economic releases that have a high probability of causing significant and immediate price movement in the related currency pairs. Examples include Central Bank Interest Rate Decisions, Non-Farm Payrolls (NFP), Consumer Price Index (CPI), and Gross Domestic Product (GDP) reports. When you see a high-impact event, you should be on high alert. This is a signal to review your open positions, consider your risk exposure, and decide on your strategy, whether it is to trade the event or to stay out of the market to avoid the volatility.
- Medium Impact: Typically marked in orange or yellow or with two stars/bulls. These events can still move the market, but the resulting volatility is usually less severe than that of high-impact events. Examples might include retail sales figures, trade balance data, or business sentiment indexes. While they may not cause massive price swings, they can still influence intraday trends and present trading opportunities, especially if the data deviates substantially from the forecast.
- Low Impact: Usually marked in gray or green or with one star/bull. These data releases rarely have a noticeable effect on the forex market. They represent more minor economic indicators that are not closely watched by the majority of market participants. For most forex traders, especially those who are not scalping for very small moves, low-impact events can generally be disregarded.
What Do “Actual,” “Forecast,” and “Previous” Figures Mean?
The “Actual,” “Forecast,” and “Previous” figures are the numerical heart of an economic calendar entry. They provide the context for the data release and are the primary drivers of the market’s reaction. Understanding what each one represents is fundamental to trading the news.
Let’s break them down:
- Previous: This is the data figure from the immediately preceding report. For a monthly report like CPI, it would be last month’s number. For a quarterly report like GDP, it would be the previous quarter’s figure. The “Previous” value serves as a baseline, helping you understand the recent trend of that particular economic indicator. Is the economy improving, worsening, or staying the same compared to the last period?
- Forecast: This is the median prediction from a group of market analysts surveyed before the official data release. It represents the market’s general expectation. Before the news is released, market prices often reflect this consensus view. For example, if analysts forecast a strong jobs report, the currency may strengthen in the hours leading up to the release in anticipation of good news.
- Actual: This is the official figure that is released to the public at the scheduled time. This number is what truly matters. The market reacts not just to the number itself, but to how it compares with the “Forecast” number. This comparison creates the “surprise” element. If the Actual figure is significantly different from the Forecast, it can trigger high volatility as traders rapidly adjust their positions to reflect the new information. A positive surprise (Actual better than Forecast) generally strengthens the currency, while a negative surprise (Actual worse than Forecast) generally weakens it.
How Do You Identify the Affected Currency?
Identifying the affected currency on an economic calendar is a straightforward process, as each event is explicitly tied to a specific country’s economy. This is usually indicated by the three-letter currency code listed next to the event name. For example, any event associated with the United States will be labeled with USD. A report on German manufacturing will be labeled with EUR because Germany is a key member of the Eurozone. A release about Japan’s unemployment rate will be labeled with JPY.
This currency code is your primary guide to determining which forex pairs will experience the most volatility. The rule is simple: the event will have the most direct and pronounced impact on pairs that include that specific currency. For instance, if the U.S. Non-Farm Payrolls (a high-impact USD event) is about to be released, you should expect major price movements in pairs like:
- EUR/USD
- GBP/USD
- USD/JPY
- AUD/USD
- USD/CAD
If you are trading a cross-pair that does not include the USD, like EUR/GBP, you might still see some secondary effects, but the most violent and direct price action will be concentrated in the major pairs involving the U.S. dollar. Therefore, the first step in using the calendar is to filter it to show only the events for the currencies you are actively trading. If you only trade EUR/USD and GBP/USD, you would primarily focus on events labeled EUR, GBP, and USD, as news from any of these three economies can directly influence your open positions.
How Do You Use an Economic Calendar to Make Trading Decisions?
You use an economic calendar for trading by first identifying high-impact events relevant to your traded currency pairs and then deciding whether to trade the volatility, avoid the event, or adjust your risk parameters. This process transforms the calendar from a simple schedule into an active component of your trading plan. It’s not just about knowing what’s happening; it’s about creating a specific, actionable plan for each major event. This involves analyzing the potential outcomes and defining your response in advance, whether that means entering a new trade based on a data surprise or defensively managing an existing one to protect your capital. Let’s break down the practical steps for integrating the calendar’s information into your day-to-day trading.
How Can You Plan Trades Around Scheduled News Events?
Planning trades around scheduled news events is a proactive approach that separates prepared traders from those who simply react. It involves creating a clear strategy before a high-impact release occurs. There are two primary approaches: defensive planning to manage risk and offensive planning to seek opportunities.

For defensive planning, the main goal is to protect your capital from the extreme volatility that news releases can create. If you have an open position in a currency pair that will be affected, you have several options. First, you could close the position entirely before the announcement. This is the safest approach, as it removes all risk associated with the event. Second, you could reduce your position size. This allows you to stay in the trade but limits your potential loss if the market moves against you. A third option is to widen your stop-loss. During news events, prices can whip back and forth violently before settling on a direction. A wider stop-loss gives your trade more room to breathe and avoid being stopped out by temporary noise.
For offensive planning, you are looking to capitalize on the price movement generated by the news. One common strategy is to wait for the data to be released and then trade the initial directional move, assuming it’s backed by a significant “surprise” in the data. Another approach involves placing pending orders, such as a buy stop and a sell stop, on either side of the current price just before the announcement. The idea is that the resulting volatility will trigger one of the orders, catching the breakout in whichever direction it goes. This is a high-risk strategy but can be effective in very volatile conditions.
How Can You Identify Trading Opportunities from Data Surprises?
Identifying trading opportunities from data surprises is a core news trading strategy that relies on the “deviation” between the actual and forecast figures. The market’s initial reaction is almost always driven by this surprise element. A significant deviation creates a clear, logical reason for a currency to either strengthen or weaken, providing a high-probability trading signal.

The basic principle is straightforward. For a positive economic indicator like GDP or retail sales, if the Actual > Forecast, it’s a positive surprise, and the currency is likely to strengthen. If the Actual < Forecast, it’s a negative surprise, and the currency is likely to weaken. For a negative indicator like the unemployment rate, the logic is reversed: a lower-than-forecast number is good news.
To execute this, you must be ready at the moment of the release. For example, imagine the U.S. Non-Farm Payrolls report is due. The forecast is for 180,000 new jobs. The actual number comes in at 250,000. This is a major positive surprise, signaling that the U.S. economy is much stronger than anticipated. This would likely cause the U.S. dollar to rally strongly. A trader could immediately enter a long position on a pair like USD/JPY or a short position on EUR/USD to capitalize on this dollar strength. The key is speed and having a predefined plan. You must know what constitutes a “significant” surprise for a given report and have your trading platform ready to execute the moment the data hits the wire.
Which Economic Indicators Have the Most Impact on the Forex Market?
The economic indicators with the most impact on the forex market are central bank interest rate decisions, employment data like Non-Farm Payrolls (NFP), inflation reports (CPI), and Gross Domestic Product (GDP) figures. These are considered “high-impact” events because they provide direct insight into a country’s economic health and future monetary policy direction, which are the primary drivers of a currency’s long-term value. While many reports are released each week, these specific indicators are watched by the entire market, from institutional banks to retail traders, and consistently have the power to cause significant and immediate volatility. To understand the forex market, you must understand why these particular reports matter so much.
Why Are Central Bank Interest Rate Decisions Important?
Central bank interest rate decisions are arguably the single most powerful driver of currency values in the forex market. The interest rate set by a country’s central bank, such as the Federal Reserve in the U.S. or the European Central Bank in the Eurozone, determines the return an investor receives for holding that country’s currency. This directly influences global capital flow.
The principle is based on interest rate differentials. Large institutional investors, like hedge funds and pension funds, are constantly seeking the highest possible return on their capital. If Country A has an interest rate of 5% while Country B has an interest rate of 2%, investors will be incentivized to sell Country B’s currency and buy Country A’s currency to take advantage of the higher yield. This increased demand for Country A’s currency causes its value to appreciate.
Therefore, not only the current interest rate but also the market’s expectation of future rate changes is important. The statements and press conferences that accompany rate decisions are scrutinized for clues about future monetary policy. If a central bank signals that it is likely to raise rates in the future (a “hawkish” stance), its currency will often strengthen in anticipation. Conversely, if it hints at cutting rates (a “dovish” stance), the currency will likely weaken. Because of this direct link to global capital flow, interest rate decisions are the bedrock of fundamental analysis in forex.
Why Is the Non-Farm Payrolls (NFP) Report a Market Mover?
The Non-Farm Payrolls (NFP) report is a major market mover because it is one of the most timely and comprehensive indicators of the health of the United States economy, the largest economy in the world. Released on the first Friday of every month by the U.S. Bureau of Labor Statistics, the NFP report measures the number of new jobs created in the U.S. during the previous month, excluding farm workers, government employees, private household employees, and non-profit organization employees.

Its significance comes from its close relationship with the dual mandate of the U.S. Federal Reserve: to achieve maximum employment and price stability. Strong job growth is a clear sign of a robust and expanding economy. When more people are working, they have more money to spend, which boosts consumer spending and drives economic growth. This strength can lead to inflationary pressures, which may prompt the Federal Reserve to raise interest rates to keep the economy from overheating.
Because the NFP data provides a direct and early look at employment trends, the market watches it intensely for clues about future Fed policy. A much stronger-than-expected NFP number often leads to a rally in the U.S. dollar, as traders bet on future interest rate hikes. A weaker-than-expected number can cause the dollar to fall, as it signals economic weakness and potentially a more dovish stance from the Fed. The report’s historical ability to cause massive, immediate price swings in USD pairs has cemented its status as a must-watch event for all forex traders.
How Do Inflation Reports (CPI) Influence Currencies?
Inflation reports, most notably the Consumer Price Index (CPI), have a profound influence on currencies because they directly impact a central bank’s monetary policy decisions. The CPI measures the average change over time in the prices paid by urban consumers for a market basket of consumer goods and services. In simple terms, it is the most widely used measure of inflation.
Central banks around the world have a mandate to maintain price stability, which means keeping inflation under control, typically around a target rate of 2%. If inflation starts to rise too far above this target, it erodes the purchasing power of the currency, which is bad for the economy. To combat rising inflation, a central bank will typically raise interest rates. Higher interest rates make borrowing more expensive, which cools down economic activity and helps bring inflation back under control.
This link between inflation and interest rates is what forex traders watch. When a CPI report shows inflation is heating up and is higher than forecasted, traders will anticipate that the central bank may need to act by raising rates sooner or more aggressively than previously expected. This anticipation of higher future interest rates makes the currency more attractive to foreign investors, causing its value to rise. Conversely, if inflation is very low or falling (disinflation), it gives the central bank room to cut interest rates to stimulate the economy, which would typically cause the currency’s value to fall.
What Are Some Advanced Considerations for Using an Economic Calendar?
Advanced considerations include using specific news trading strategies, understanding the difference between indicator types, accounting for data revisions, and customizing the calendar to your personal trading plan. Additionally, traders must weigh the risks and rewards of trading during high volatility periods and filter out irrelevant information to make focused decisions.
What Are the Most Common News Trading Strategies?
Traders have developed several distinct strategies to approach the volatility that follows a major economic data release. One popular method is trading the initial spike, a momentum strategy where a trader enters a position in the direction of the initial, powerful price move immediately following the news. This requires fast execution and a platform with low latency. Another approach is trading the reversal, also known as fading the move. This strategy is based on the idea that the initial market reaction is often an overreaction. A trader using this method waits for the initial spike to lose momentum and then enters a trade in the opposite direction, expecting the price to correct. A third, more conservative strategy is to wait for the trend to establish. Instead of trying to catch the first move, these traders wait for the market to digest the news and establish a clear, stable trend in the hours that follow the release. This approach sacrifices the potential for quick profits in exchange for a higher probability trade based on confirmed market sentiment.
What Is the Difference Between Leading and Lagging Economic Indicators?
Understanding the distinction between leading and lagging indicators is fundamental for interpreting an economic calendar correctly. Leading indicators are data points that attempt to predict future economic activity, giving traders a potential glimpse into where the economy is headed. They often reflect consumer and business sentiment or early-stage economic processes. For example, building permits are a leading indicator because they signal future construction activity and investment. Similarly, the Consumer Confidence Index (CCI) suggests future spending habits. In contrast, lagging indicators are data points that confirm economic activity that has already occurred. They provide a clear picture of past performance but offer no predictive value. Gross Domestic Product (GDP) is a classic lagging indicator, as it measures the economic output of a previous quarter. The unemployment rate is another, as it reflects the state of the job market in the prior month. While leading indicators are used for forecasting, lagging indicators are used to confirm trends and assess the overall health of the economy after the fact.

How Do Data Revisions Affect Market Analysis?
Many key economic indicators, like GDP and Non-Farm Payrolls (NFP), are released as preliminary estimates and are subject to future revisions. These revisions can significantly alter market perception and cause delayed volatility long after the initial announcement. A revision occurs when more complete data becomes available, allowing government agencies to publish a more accurate figure. For instance, an initial NFP report might show 200,000 jobs added, causing a positive market reaction. However, a revision a month later might downgrade that number to 150,000. This change can undermine the initial positive sentiment and cause the currency to weaken as traders readjust their expectations about the economy’s health. What does this mean for a trader? It means that you should always be aware that the first number is not always the final word. Experienced traders often look at the revision of the previous month’s data, which is typically released at the same time as the current month’s preliminary data, to get a more complete picture of the economic trend.

Should You Avoid Trading During Major News Releases?
Deciding whether to trade during a major news release depends entirely on your risk tolerance and trading experience. Many traders, especially beginners, should consider avoiding the market during these periods due to extreme volatility and unpredictable conditions. During high-impact news like an interest rate decision or NFP report, the market can experience immense price swings, widened spreads, and significant slippage, where your order is filled at a much different price than intended. These conditions can lead to substantial losses very quickly. On the other hand, some experienced traders specialize in news trading precisely because of this volatility. They see it as a high-reward opportunity, using specific strategies to profit from the large price movements. For these traders, the potential for quick, substantial gains outweighs the risks. Ultimately, if you are a conservative trader who prefers stable market conditions or are still learning, staying on the sidelines during the first 15 to 30 minutes of a major release is a sound risk management practice.

How Can You Customize an Economic Calendar for Your Trading Style?
A default economic calendar can be overwhelming, displaying dozens of events from countries whose currencies you do not trade. Customizing your calendar by filtering for currency and impact level allows you to reduce noise and focus only on events relevant to your strategy. Most online economic calendars provide powerful filtering tools. First, you should filter by country or currency. If you only trade EUR/USD and GBP/USD, there is no need to see data releases from Japan or Australia. By selecting only the United States, Eurozone, and the United Kingdom, you immediately create a cleaner, more manageable view. Second, you can filter by impact level. Events are typically categorized as low, medium, or high impact. Low-impact events rarely move the market and can often be ignored. By setting your filter to show only medium and high-impact events, you ensure that you are only alerted to the news that has a real potential to create trading opportunities and affect your open positions. This simple customization transforms the calendar from a flood of information into a precise tool tailored to your specific trading plan.
