

Blog
What Is a Moving Average Crossover Strategy and How Does It Generate Forex Signals?


A moving average crossover strategy is a popular technical analysis tool that uses two or more moving averages of different lengths to identify changes in trend direction and generate trading signals. The core principle is that a crossover event, where a shorter-term moving average crosses over a longer-term one, signals a potential shift in market momentum. This approach helps traders visualize trend strength and timing for entering or exiting positions in the forex market. It simplifies complex price action into a clear, visual indicator based on averaged price data over time.
The strategy generates forex signals through the interaction of these two moving averages. Specifically, a buy signal is triggered when the faster (shorter-period) moving average crosses above the slower (longer-period) one, while a sell signal is triggered when the fast moving average crosses below the slow one. This mechanism provides a simple, rules-based method for identifying potential trading opportunities. For example, if a 20-day moving average crosses above a 50-day moving average, it suggests that recent price momentum is turning positive, signaling a potential entry for a long position.
The key components required for this strategy are straightforward. Traders need at least two moving averages: a “fast” moving average with a shorter time period and a “slow” moving average with a longer time period. The fast average is more sensitive to recent price changes, while the slow average provides a smoother representation of the longer-term trend. The contrast between these two lines is what creates the actionable crossover signals that form the foundation of the entire strategy.
By plotting these averages on a chart, traders can effectively filter out the day-to-day market “noise” and focus on the underlying trend. This strategy is not designed to predict tops or bottoms but rather to confirm that a new trend has likely begun. Throughout this guide, we will explore exactly how these crossovers work, the different types of moving averages you can use, and common settings that traders apply to suit their specific goals.
What is a Moving Average Crossover Strategy?
A moving average crossover strategy is a technical analysis approach that uses two or more moving averages of different time periods to identify changes in market momentum and generate buy or sell signals. This strategy is one of the most fundamental and widely used methods for trend identification in financial markets, including forex. By plotting these averages on a price chart, traders can visually determine the direction and strength of a trend and receive objective signals for entering or exiting trades. The entire concept is built on the interaction between a fast-reacting, short-term average and a slower, more stable long-term average. When these two lines intersect, or “cross over,” it indicates a potential change in the market’s direction, providing a mechanical trigger for a trading decision. Because it relies on past price data, it is considered a trend-following or lagging indicator, meaning it confirms a trend once it has already started rather than predicting a future one.
What Are the Key Components of This Strategy?
The moving average crossover strategy is built on two primary components: a fast moving average and a slow moving average. The “fast” moving average has a shorter look-back period, such as 10, 20, or 50 periods. Because it averages prices over a shorter timeframe, it reacts much more quickly to recent price changes. Think of it like a speedboat, it can change direction rapidly in response to the immediate waves (price action). This sensitivity allows it to provide early indications of a potential shift in momentum. For instance, if a currency pair suddenly starts to rally, the 10-period moving average will begin to angle upwards much sooner than a 200-period average would.

The second component is the “slow” moving average, which has a longer look-back period, such as 100 or 200 periods. This average incorporates a larger data set, making it much smoother and less reactive to short-term price fluctuations. To continue the analogy, the slow moving average is like an oil tanker. It takes a significant amount of time and sustained effort to change its course. Its purpose is to define the broader, more established trend. By ignoring minor price spikes and pullbacks, it gives the trader a clearer picture of the market’s underlying direction. The combination of the nimble speedboat (fast MA) and the steady oil tanker (slow MA) is what creates the powerful signals of this strategy.
What is the Goal of a Moving Average Crossover Strategy?
The primary goal of a moving average crossover strategy is to signal the potential start of a new trend or the confirmation that a current trend is losing steam and may be reversing. It is fundamentally a trend-following system. This means it is not designed to predict market tops or bottoms with pinpoint accuracy. Instead, its strength lies in helping traders join a trend shortly after it has established itself and exit before the trend completely dies out. By waiting for the fast moving average to cross the slow moving average, a trader is essentially waiting for confirmation that the market’s momentum has shifted in a meaningful way.

For example, a bullish crossover (fast MA moving above the slow MA) does not predict that a new uptrend will happen. Rather, it confirms that the recent upward price movement has been strong enough to alter the short-term trend relative to the long-term trend. This confirmation gives the trader a more objective, rules-based reason to enter a long trade, rather than relying on gut feeling or trying to catch a falling knife. Similarly, a bearish crossover provides confirmation that downside momentum is building. The strategy aims to remove emotion and subjectivity from trading by providing clear, visual entry and exit signals based on the mathematical interaction of these price averages.
How Does a Moving Average Crossover Generate Trading Signals?
A moving average crossover generates trading signals when the shorter-period ‘fast’ moving average crosses either above (a buy signal) or below (a sell signal) the longer-period ‘slow’ moving average. This mechanical process provides clear, objective triggers for traders based on shifts in momentum. The logic is that the fast moving average reflects recent market sentiment, while the slow moving average represents the established, longer-term trend. When the recent sentiment becomes strong enough to cross the established trendline, it signals a potential change in the market’s overall direction. This interaction removes guesswork by creating a simple, visual rule: if line A crosses line B, a specific action is warranted. For traders, this means they don’t have to interpret complex price patterns or candlestick formations on their own. The crossover itself is the signal, making it one of the most straightforward ways to implement a rules-based trading system. Let’s explore the two types of signals this system generates in more detail.
What is a Bullish Crossover Signal?
A bullish crossover signal, often called a “buy” signal, occurs when the fast moving average crosses from below to above the slow moving average. This event is a visual indication that short-term momentum is accelerating to the upside and is becoming stronger than the longer-term average trend. For example, imagine you are watching the EUR/USD pair using a 20-period moving average (the fast one) and a 50-period moving average (the slow one). If the price of EUR/USD begins to rise steadily, the 20-period MA, being more sensitive, will start to curve upwards more quickly than the 50-period MA. When the 20-period MA physically crosses above the 50-period MA on the chart, the bullish crossover is confirmed.

This signal suggests to traders that a new uptrend may be starting or that an existing uptrend is resuming after a period of consolidation. Traders who follow this strategy would interpret this crossover as a potential opportunity to enter a long position. The rationale is that the force of recent buyers has been strong enough to pull the short-term average price above the long-term average, indicating a potential continuation of that upward movement. The wider the separation between the two moving averages after the crossover, the stronger the perceived momentum of the new trend.
What is a Bearish Crossover Signal?
A bearish crossover signal, which serves as a “sell” or “short” signal, is the exact opposite of a bullish crossover. It occurs when the fast moving average crosses from above to below the slow moving average. This action indicates that short-term momentum is weakening and turning to the downside, with recent prices falling faster than the longer-term average. Using the same EUR/USD example with a 20-period and 50-period MA, if the currency pair starts to decline, the 20-period MA will react first and begin to slope downwards. When it eventually crosses below the more stable 50-period MA, a bearish signal is generated.

This crossover suggests that a new downtrend could be forming or that an existing downtrend is picking up speed. For a trader, this is a signal to consider entering a short position or exiting any existing long positions. The logic is that the recent selling pressure has been powerful enough to drag the short-term average price beneath the established long-term average, signaling that sellers are now in control of the market. Just as with the bullish signal, the degree of separation between the lines after the crossover can help gauge the strength of the bearish momentum. A sharp downward angle and increasing distance between the MAs can suggest a strong and accelerating downtrend.
What Are the Main Types of Moving Averages Used?
The two main types of moving averages used are the Simple Moving Average (SMA), which gives equal weight to all prices, and the Exponential Moving Average (EMA), which prioritizes recent prices. The choice between an SMA and an EMA is a critical decision when building a crossover strategy, as each one calculates the average differently and, therefore, behaves differently on a chart. An SMA provides a smoother line and is less susceptible to short-term price spikes, which some traders prefer for identifying long, stable trends. On the other hand, an EMA reacts more quickly to price changes, which can provide earlier signals but may also lead to more false alarms. Understanding the distinct characteristics of each type is essential for tailoring the strategy to your specific trading style, risk tolerance, and the market conditions you are trading in. Neither is definitively “better” than the other; their effectiveness depends entirely on the trader’s objectives.
What is a Simple Moving Average (SMA)?
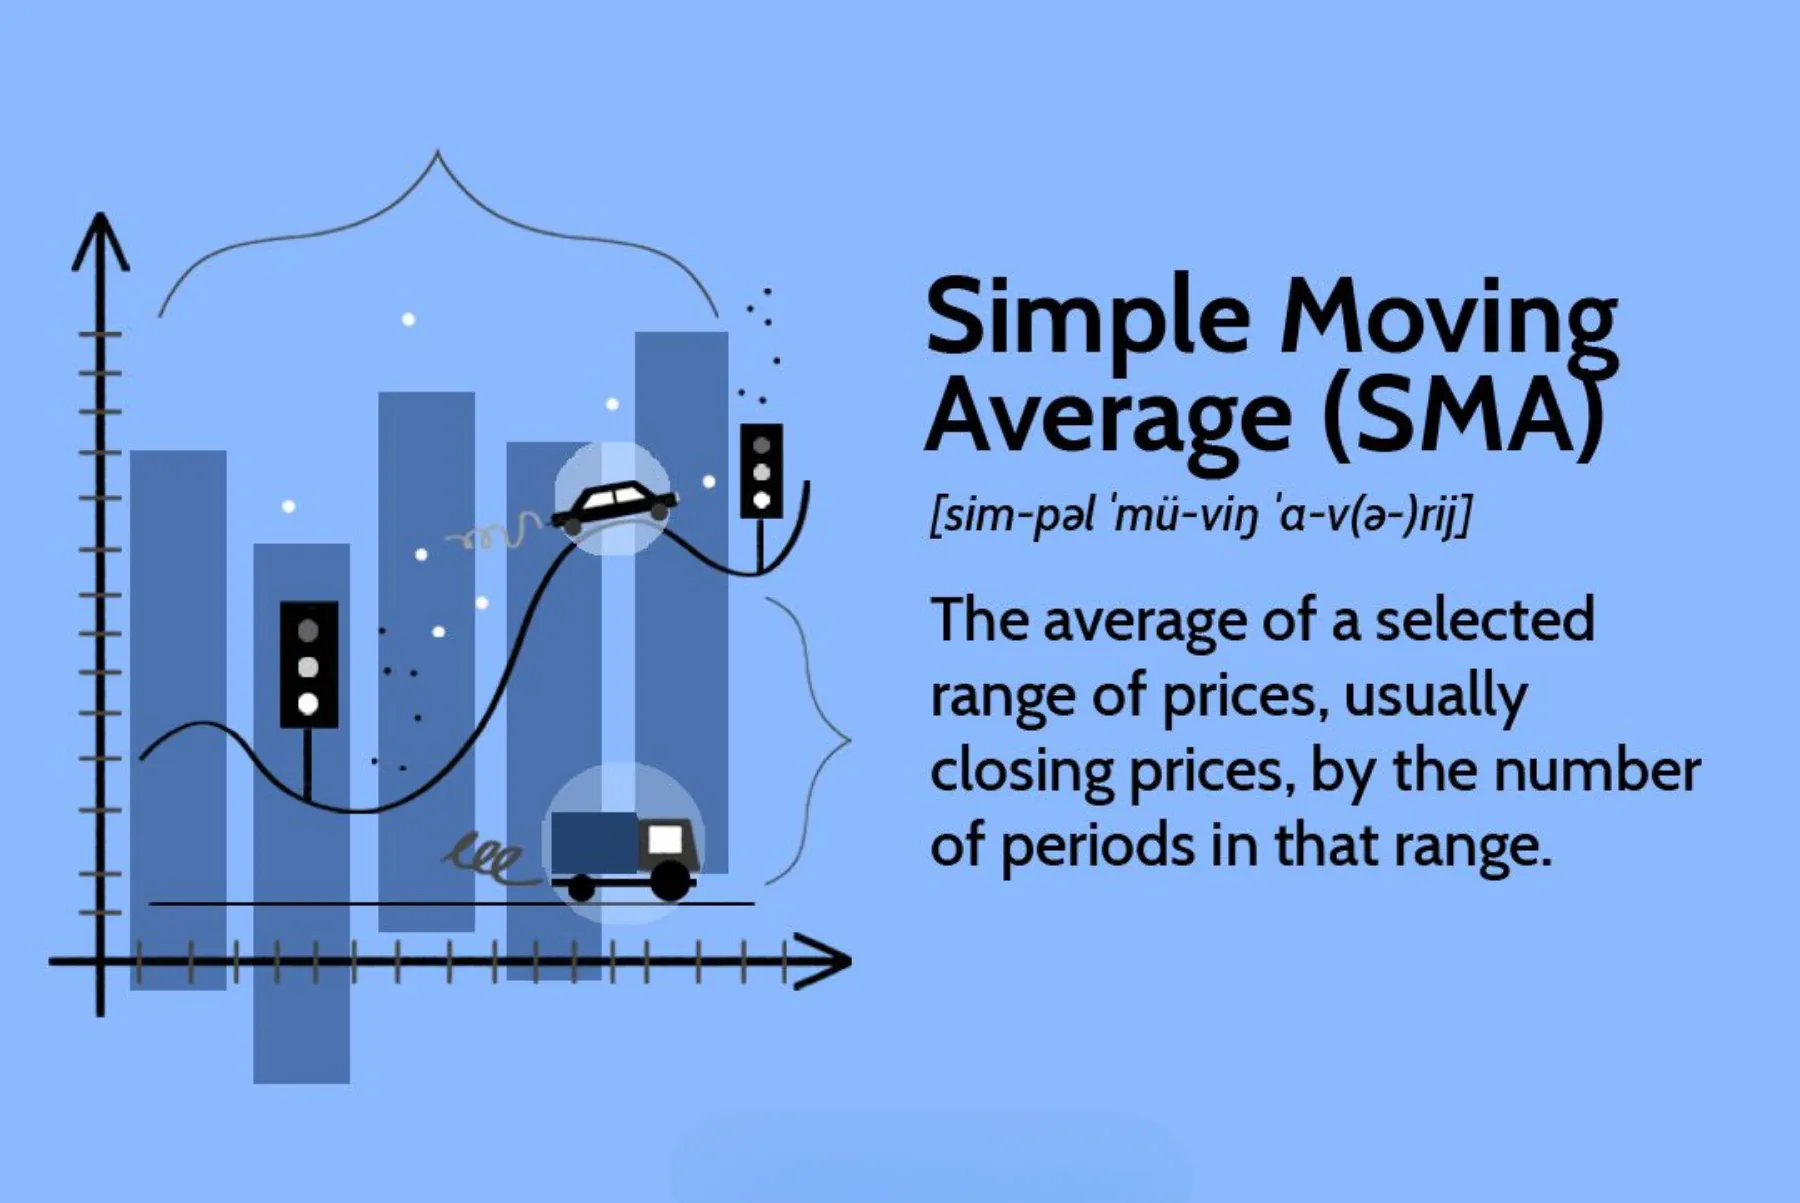
A Simple Moving Average (SMA) is the most basic type of moving average and is calculated by summing up the closing prices of a security over a specific number of periods and then dividing that sum by the number of periods. For instance, a 20-day SMA is the average closing price over the last 20 trading days. The key characteristic of the SMA is that it gives equal weight to every data point in the calculation. The oldest price in the period (day 20) has the exact same influence on the average as the most recent price (day 1).
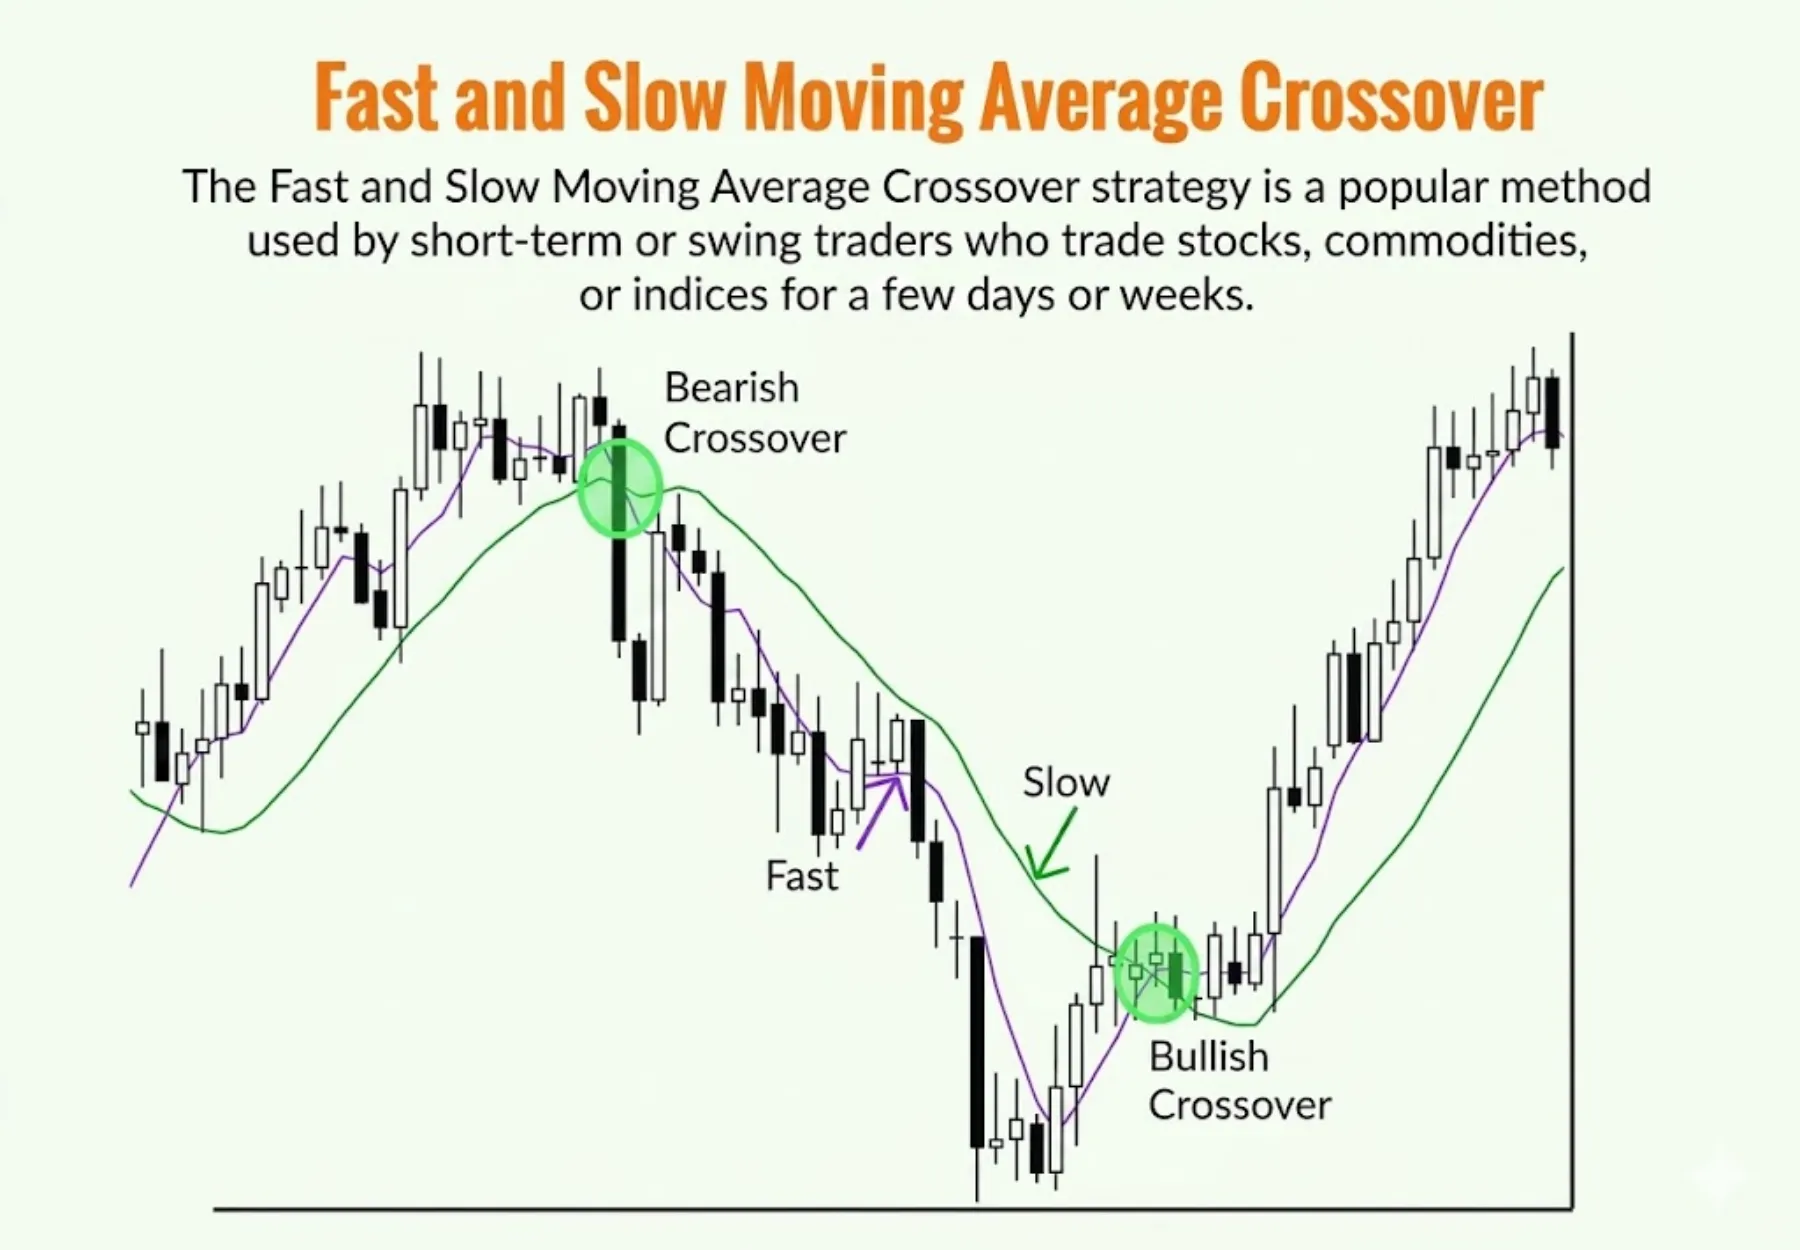
This equal weighting results in a very smooth line on the chart. Because it is not overly influenced by any single day’s price action, the SMA is excellent at filtering out market noise and providing a clear view of the long-term trend. However, this smoothness comes at a cost. The SMA is inherently slow to react to new price information, which means its signals will lag more than those from other moving average types. A trader using an SMA-based crossover strategy might enter a new trend later than a trader using an EMA. While this can mean missing out on some early profits, it can also protect the trader from getting tricked by short-lived price spikes or “whipsaws” that quickly reverse.
What is an Exponential Moving Average (EMA)?
An Exponential Moving Average (EMA) is a more complex type of moving average that gives greater weight and significance to the most recent price data. Unlike the SMA, where every data point is treated equally, the EMA uses a formula that prioritizes recent prices, causing the average to react more quickly to new information. The weighting applied to the most recent price depends on the specified period of the EMA, but the oldest data points have a diminishing impact on the final average.
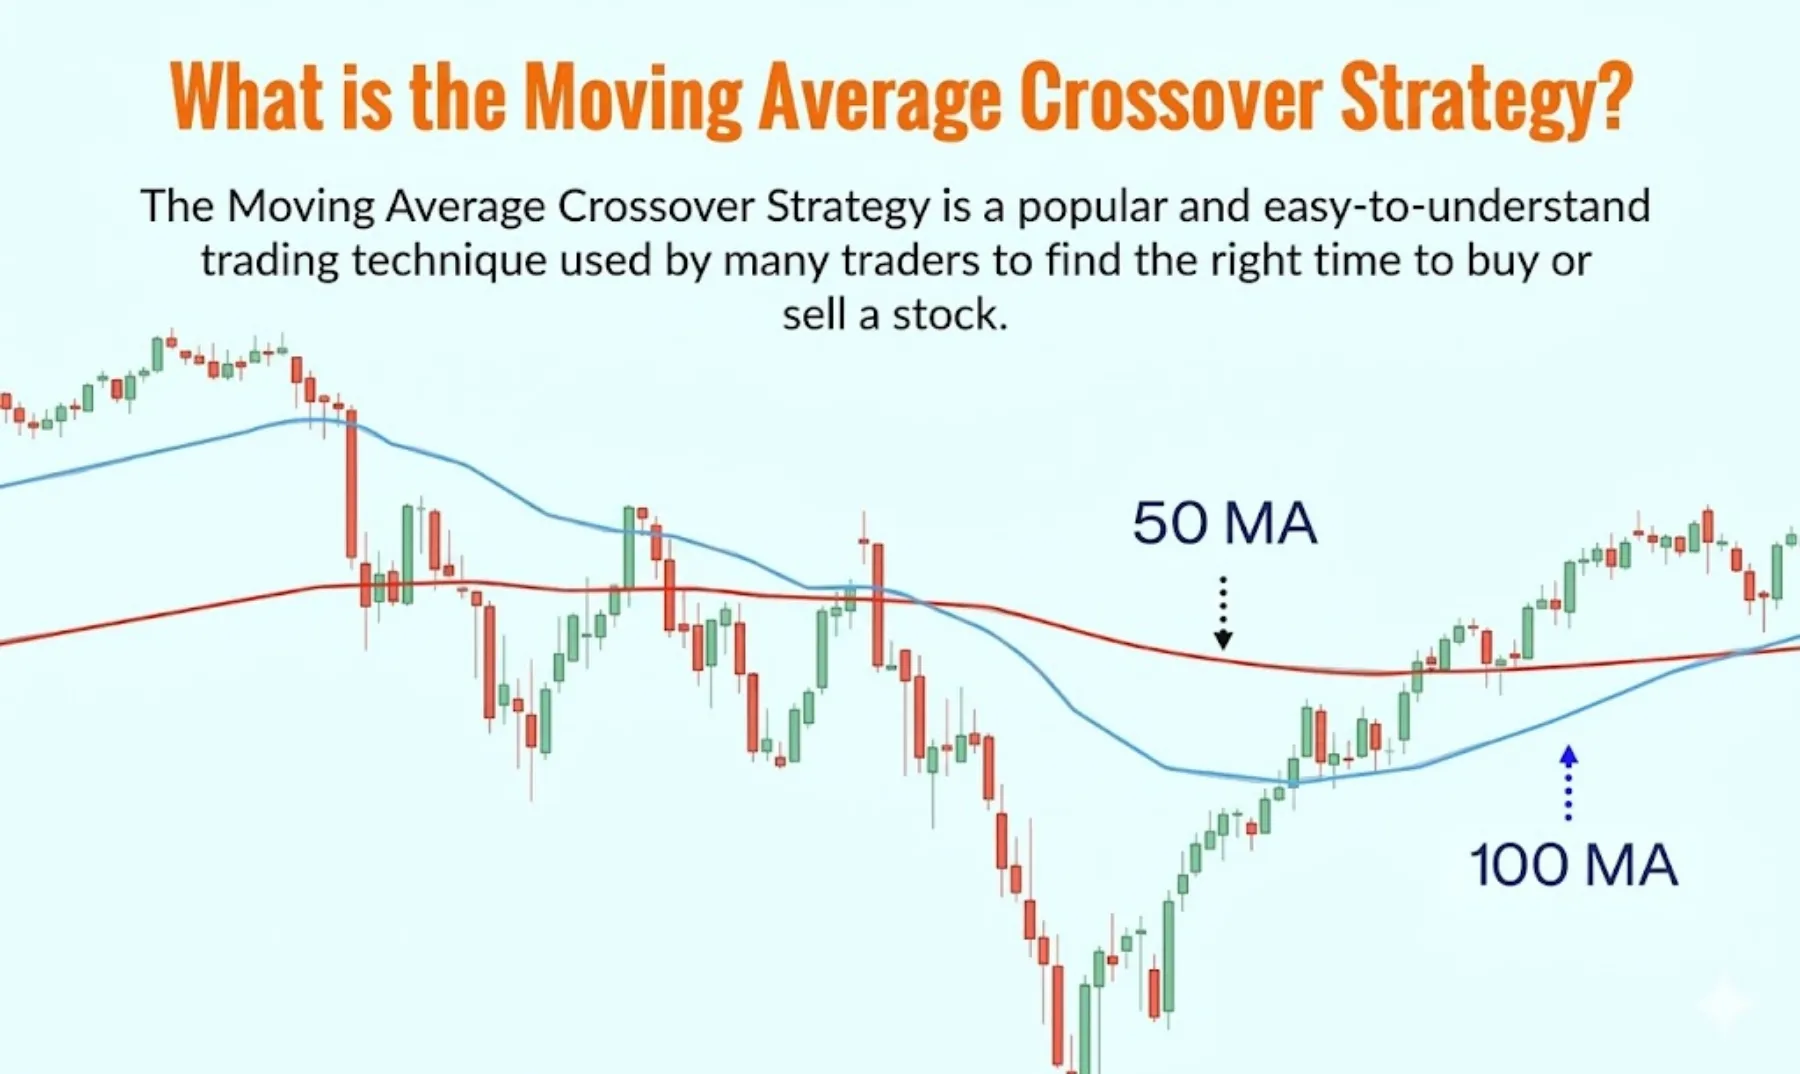
This heightened sensitivity makes the EMA a favorite among many short-term traders and those operating in volatile markets. Because it hugs the price action more closely, an EMA-based crossover can generate signals earlier than an SMA-based crossover. This can lead to getting into a trend sooner and potentially capturing a larger portion of the move. The main drawback, however, is that this same sensitivity can make the EMA more susceptible to false signals. A brief, sharp price move that isn’t the start of a genuine trend can cause the EMA to cross over, tricking a trader into a position just before the price reverses. Therefore, traders using EMAs often combine them with other indicators to help confirm signals and filter out the noise.
What Are the Most Common Moving Average Crossover Pairs?
The most common moving average crossover pairs vary by trading style, with short-term traders using pairs like 5/20 periods and long-term investors watching for the 50/200 period ‘Golden Cross’ or ‘Death Cross’. The selection of these periods, or lengths, is a critical part of customizing the strategy. Shorter period combinations, like a 9-period MA crossing a 21-period MA, are highly responsive and generate frequent signals, making them suitable for day traders or scalpers who thrive on volatility. Mid-term combinations, such as the 20/50 period crossover, offer a balance between responsiveness and reliability, appealing to swing traders who hold positions for several days or weeks. Long-term investors, however, focus on much slower combinations that signal major, sustained shifts in the market trend. Two of the most famous long-term signals, watched by traders and analysts worldwide, are the Golden Cross and the Death Cross.
What is a Golden Cross?
A Golden Cross is a specific, widely followed bullish moving average crossover pattern. It occurs when a shorter-term moving average, typically the 50-period moving average, crosses above a longer-term moving average, typically the 200-period moving average. This event is considered a powerful technical signal indicating a potential major, long-term uptrend or bull market. Because it uses such long timeframes, the Golden Cross is not a signal for short-term traders. Instead, it is monitored by long-term investors, portfolio managers, and market analysts as a confirmation that the market has shifted from a bearish or neutral phase into a sustained bullish one.
The signal is often broken down into three stages. First, a market bottoms out as selling pressure is exhausted. Second, the faster 50-period MA crosses up and over the slower 200-period MA, confirming the breakout and triggering the Golden Cross. Third, the new uptrend continues, often with the 200-period MA acting as a long-term support level. The psychology behind its power is that it shows recent positive momentum has become strong enough to overcome the very long-term trend, signaling a fundamental shift in market sentiment from negative to positive.
What is a Death Cross?
A Death Cross is the bearish counterpart to the Golden Cross and is considered a significant signal of a potential long-term market decline or bear market. This pattern forms when a shorter-term moving average, again typically the 50-period moving average, crosses below the longer-term 200-period moving average. Like the Golden Cross, this is a long-term indicator that is not meant for timing day trades but rather for identifying major shifts in the overall market trend. When a Death Cross appears on a major market index chart, such as the S&P 500, it often receives widespread attention from financial media and analysts as a warning sign.

The mechanics of a Death Cross are the inverse of a Golden Cross. It typically starts after a market has peaked and begins to decline. The 50-period MA, reacting more quickly to the falling prices, will start to slope downwards and eventually cross below the much slower, more stable 200-period MA. This crossover confirms that the short-term downtrend has enough momentum to have broken below the long-term trendline, suggesting that sellers have taken firm control and that a protracted period of weakness may follow. Historically, the Death Cross has preceded some of the most severe bear markets, solidifying its reputation as a formidable bearish signal.
What Are the Advanced Considerations for a Crossover Strategy?
A trader must consider market conditions, timeframe selection, indicator confirmation, and risk management to properly apply a moving average crossover strategy. Furthermore, a deep understanding of its inherent limitations and how it compares to other technical tools is necessary for consistent performance and avoiding common pitfalls.
Is the Moving Average Crossover Strategy Profitable?
The profitability of a moving average crossover strategy is entirely dependent on the prevailing market conditions. It is not a universally profitable system. The strategy’s effectiveness hinges on its ability to identify and follow trends. In markets with strong, sustained directional moves, such as a clear uptrend or downtrend, it can be very profitable by providing objective entry and exit points that capture the majority of a price swing. A bullish crossover in a rising market can signal a solid entry point, while a bearish crossover can indicate a timely exit or a new short position.
However, the strategy performs poorly in ranging or sideways markets. When price action is choppy and lacks clear direction, moving averages will cross back and forth frequently. This generates numerous false signals, often called “whipsaws,” that lead to a series of small, accumulating losses. Since it is a lagging indicator, it only confirms a trend after it has already begun, meaning traders may miss the earliest part of a move. Its success is a direct result of applying it in the right environment.
What Are the Best Timeframes and Settings to Use?
There is no single “best” timeframe or setting for a moving average crossover strategy, as the optimal configuration is specific to a trader’s goals and the asset being traded. The choice depends heavily on trading style, whether you are a short term scalper or a long term position trader. Different settings are designed to capture different types of market movements, and what works for one approach will likely fail for another. The key is to align the moving average periods with your intended holding time.

To find appropriate settings, traders often adapt them as follows:
- Short Term Trading: Day traders and scalpers focusing on small, quick profits may use faster moving averages on lower timeframes. For example, a 5 period EMA crossing a 10 period EMA on a 5 minute or 15 minute chart is a common setup designed to react quickly to immediate price changes.
- Long Term Trading: Swing and position traders aim to capture larger trends over days, weeks, or months. They will use slower moving averages on higher timeframes, like the daily or weekly chart. The classic “Golden Cross,” a 50 period SMA crossing above a 200 period SMA, is a well known long term bullish signal.
What is the Difference Between a Moving Average Crossover and a MACD Crossover?
A moving average crossover and a Moving Average Convergence Divergence (MACD) crossover are both trend following signals, but they are calculated and displayed differently. A standard moving average crossover occurs directly on the price chart when a shorter period MA crosses above or below a longer period MA. For example, you might watch the 10 period EMA cross the 20 period EMA. This provides a direct visual cue related to the price action itself. These signals tend to be slower and confirm a trend that is already underway.

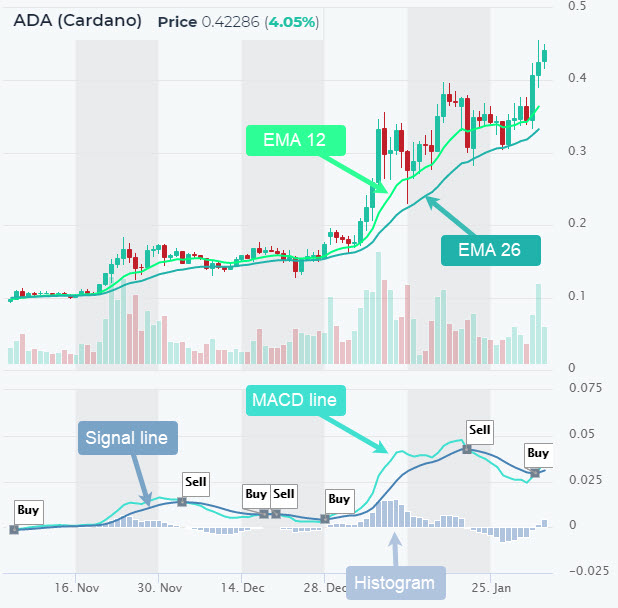
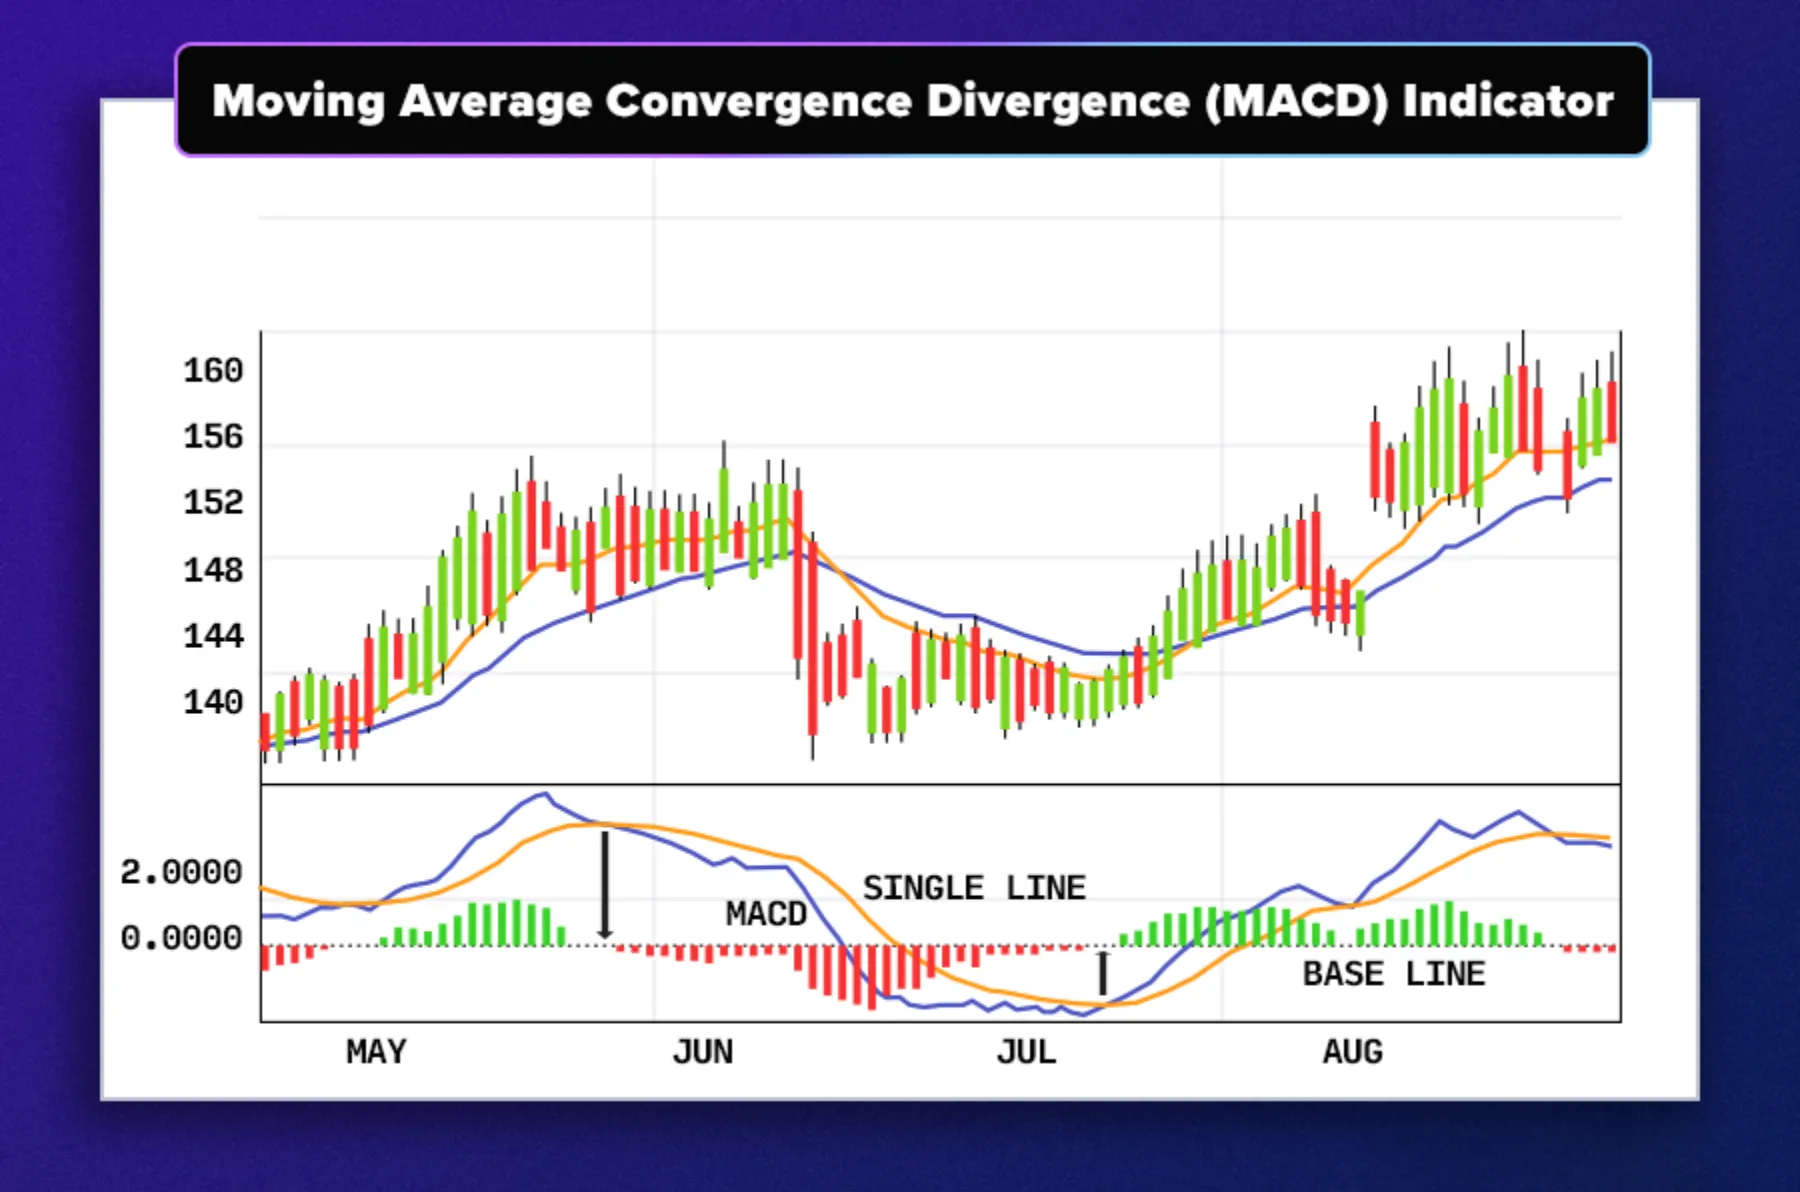
In contrast, a MACD crossover is a signal generated by a momentum oscillator that appears in a separate window below the price chart. The MACD indicator consists of the MACD line and a signal line. A crossover happens when these two lines cross. Because the MACD is designed to measure momentum, its crossovers often happen earlier than a standard MA crossover on the price chart. This can provide a leading signal, but it also increases the risk of false signals. The MACD essentially shows the relationship between two moving averages, while a standard crossover shows their relationship to price.
How Can You Reduce False Signals from a Moving Average Crossover?
The most effective way to reduce false signals from a moving average crossover is to use additional indicators for confirmation. Relying on the crossover alone, especially in non trending markets, is a common cause of failure. By adding a second or third layer of analysis, you can filter out weak signals and only act on those with higher probability. This approach helps you confirm that sufficient momentum or trend strength exists to support the trade signaled by the crossover.

Here are a few ways to filter signals:
- Use a Trend Strength Indicator: The Average Directional Index (ADX) is excellent for this purpose. An ADX reading above 25 suggests the market is trending. You would only take crossover signals that occur when the ADX is above this level and ignore any that form when the ADX is below it, as that indicates a ranging market.
- Use a Momentum Oscillator: An indicator like the Relative Strength Index (RSI) can confirm the crossover. For a bullish crossover, you might look for the RSI to be above 50. For a bearish crossover, you would want to see the RSI below 50.
- Incorporate Volume Analysis: A valid crossover should ideally be accompanied by an increase in trading volume. Higher volume confirms conviction behind the price move and reduces the chance that the signal is just market noise.
What Are the Common Mistakes Traders Make with This Strategy?
One of the most frequent mistakes is using the moving average crossover strategy in the wrong market environment. This strategy thrives in trending markets but generates consistent losses in sideways or ranging conditions. Many traders fail to assess the broader market context before looking for crossover signals. To avoid this, a trader should first use tools like the ADX or analyze higher timeframes to confirm that a clear trend is actually in place. If the market is consolidating, it is best to stay on the sidelines or use a different strategy.
Another common pitfall is relying on the crossover signal in isolation. No single indicator is perfect, and a crossover should be seen as a suggestion, not a command. A successful trader confirms the signal with other forms of analysis. This could include checking for supportive price action, like a breakout from a chart pattern, or confirming the signal with another indicator, like the RSI or MACD. Finally, many traders use inappropriate settings for their trading style, such as applying long term moving averages like the 50/200 SMA to a short term scalping strategy. It is essential to backtest and select timeframes and MA periods that align with your specific trading goals.