

Blog
Technical vs Fundamental Analysis in Forex: Which Should a Beginner Learn First?

When starting in forex trading, choosing between technical and fundamental analysis can feel overwhelming, but the path for a beginner is quite clear. For most new traders, learning technical analysis first is the recommended approach because it provides a structured, visual framework for making trading decisions with clear entry and exit points. This method focuses on interpreting price charts and market statistics, which are readily available and offer immediate feedback. By mastering the basics of technical analysis, you can build a disciplined trading system based on probabilities and patterns without needing a degree in economics.
Technical analysis is the study of historical price movements and chart patterns to forecast future market direction. It operates on the belief that all known information is already reflected in the current price, so the primary focus is on what the price is doing, not why. This approach gives traders concrete signals for when to buy or sell, based on visual cues like trendlines, support levels, and specific indicator readings.
Fundamental analysis, on the other hand, involves evaluating a country’s economic, social, and political factors to determine a currency’s intrinsic or “true” value. A fundamental analyst looks at data like interest rates, inflation, and employment figures to gauge the underlying health of an economy. The goal is to identify whether a currency is currently overvalued or undervalued by the market, providing insight into its long-term potential.
While technical analysis offers a more accessible starting point, a truly proficient trader eventually learns to use both. Major economic news can override even the most perfect technical setup. Therefore, even if you start with charts and patterns, having a basic awareness of key fundamental events will protect you from unexpected market volatility and provide crucial context for your trades.
What is Technical Analysis in Forex Trading?
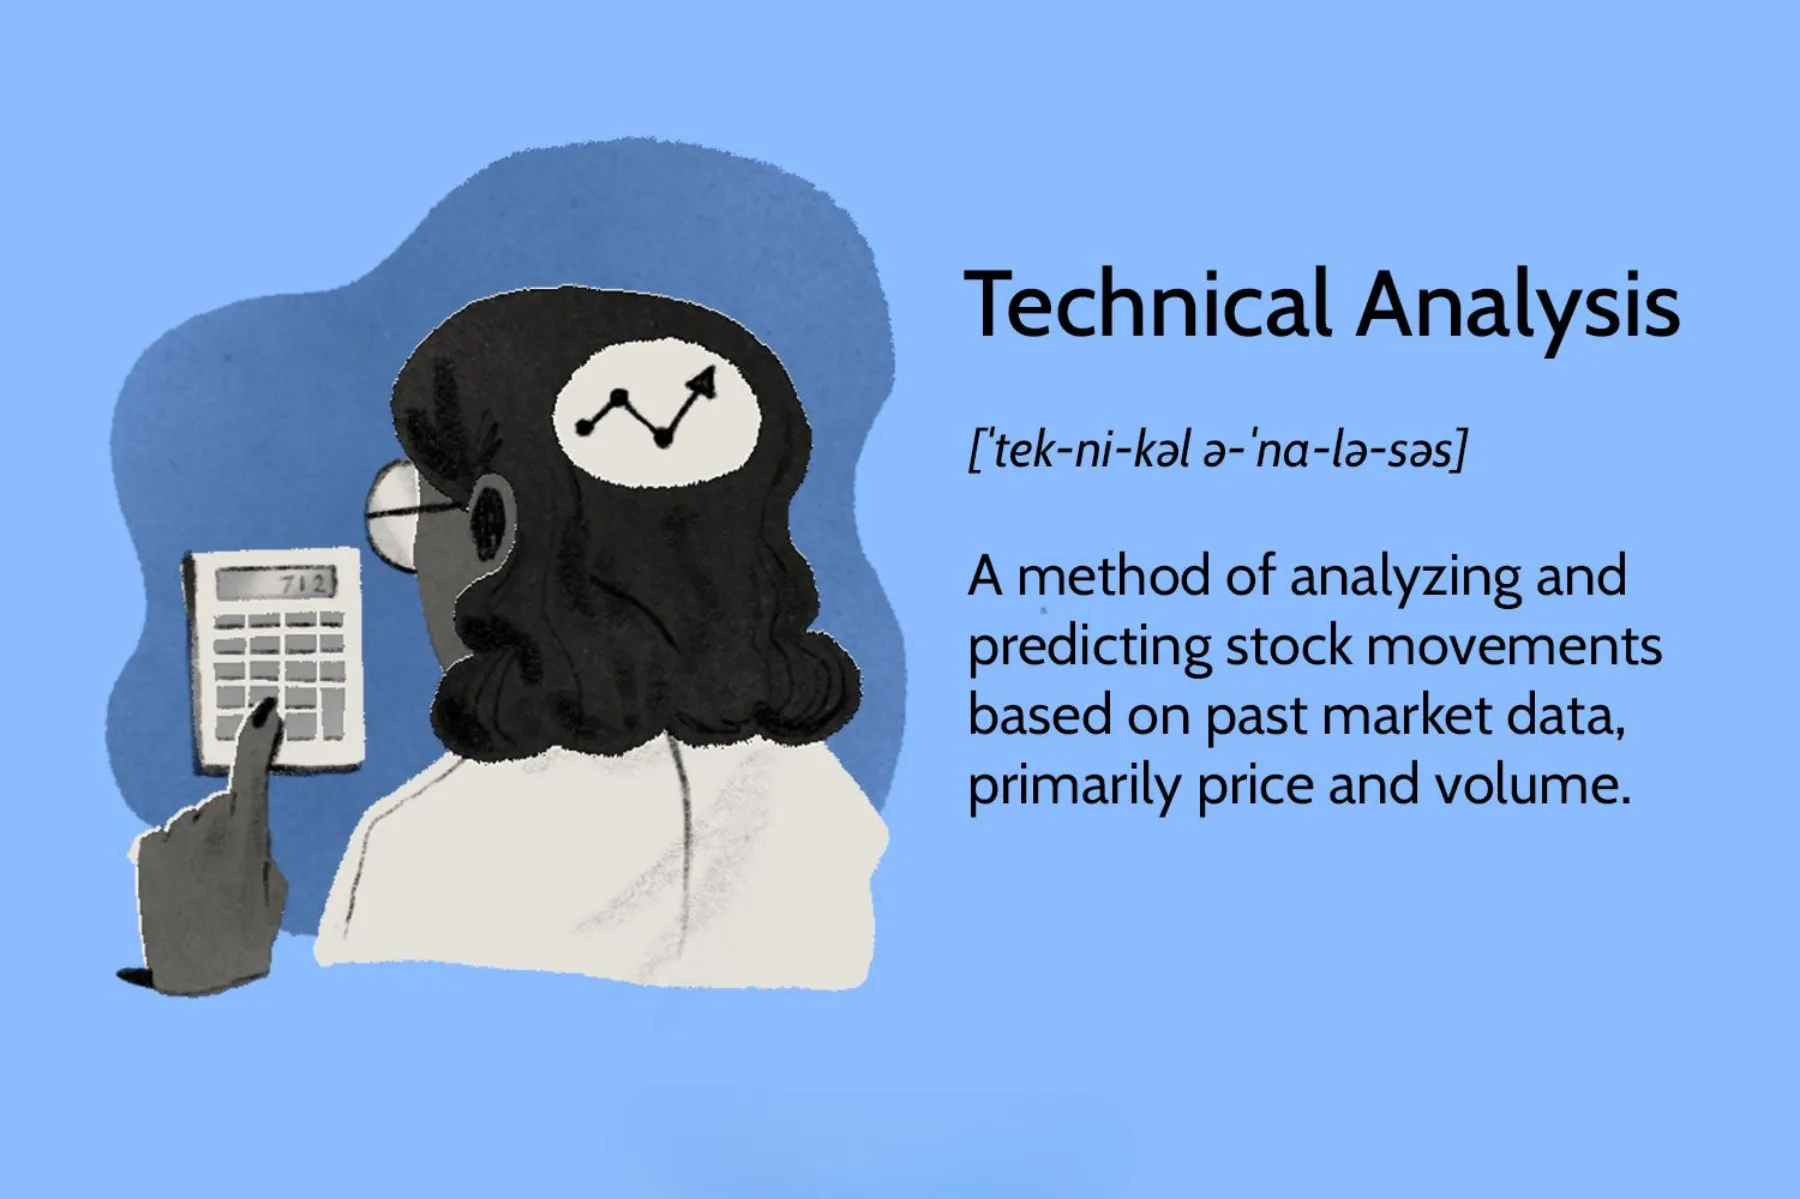
Technical analysis is the forecasting method used to predict future price movements by examining past market data, primarily price and volume. This approach operates on the core idea that all information influencing a currency pair is already factored into its price, so by studying price charts, you can identify patterns and trends that suggest where the price might go next. Instead of digging into economic reports to understand why a price is moving, a technical analyst focuses entirely on what the price is doing right now.
To understand this better, think of a technical analyst as a chart detective. They look for clues left behind by the collective buying and selling actions of all market participants. These clues appear in the form of chart patterns, trends, and signals from mathematical indicators. The underlying assumption is that human psychology, which drives trading decisions, tends to repeat itself. Therefore, historical patterns of fear and greed are likely to re-emerge, creating predictable outcomes that a skilled analyst can identify and trade. This makes technical analysis a self-contained system where the chart itself provides all the necessary information for making a trading decision.
What are the Core Principles of Technical Analysis?
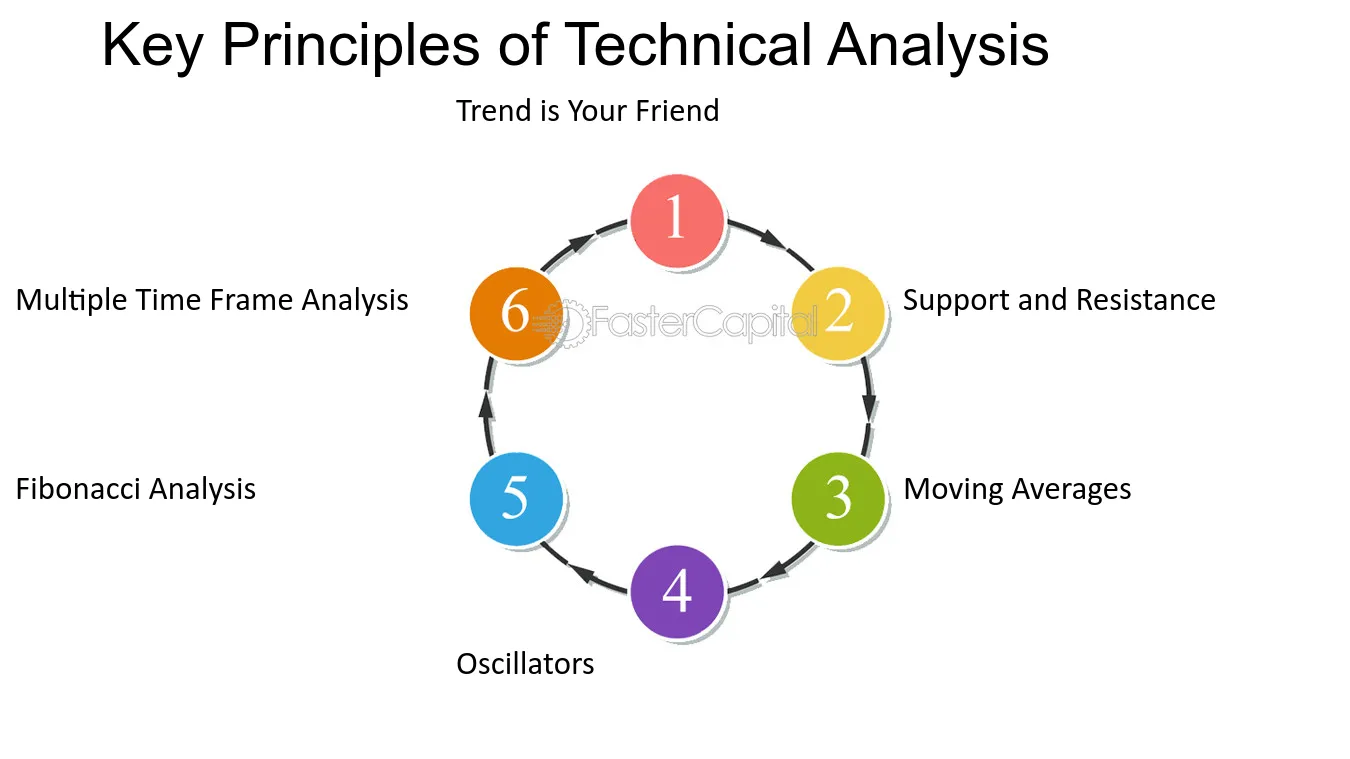
Technical analysis is built on three foundational beliefs that guide every decision a chartist makes. Understanding these tenets is essential to grasping the logic behind this methodology.

First, the market discounts everything. This is the cornerstone of technical analysis. It means that any factor that could possibly affect a currency’s price, from economic data and central bank policy to geopolitical events and market sentiment, is already reflected in its price chart. A technical analyst believes it is unnecessary to study these external factors because their impact is already visible in the price action. For example, if a central bank unexpectedly raises interest rates, the resulting surge in buying pressure will appear on the chart instantly. The chartist doesn’t need to know the news; they just need to recognize the bullish price movement and trade accordingly.
Second, price moves in trends. This principle suggests that market prices do not move randomly but in identifiable directions, known as trends. These can be uptrends (a series of higher highs and higher lows), downtrends (lower highs and lower lows), or sideways trends (ranging between two price levels). The goal of a technical trader is to identify the direction of the primary trend as early as possible and place trades that align with it. The old trading adage, “the trend is your friend,” comes directly from this principle.
Finally, history tends to repeat itself. This idea is rooted in market psychology. The emotional responses of traders to price movements, like fear, greed, and hope, have remained consistent over time. Because these human reactions are predictable, certain chart patterns that have appeared in the past are likely to appear again and produce similar outcomes. Patterns like the “head and shoulders” or “double top” are visual representations of these repeating psychological battles between buyers and sellers. By learning to recognize these formations, analysts can forecast potential price reversals or continuations.
What Does a Technical Analyst Look At?
A technical analyst uses a specific toolkit to interpret market behavior and identify trading opportunities. These tools help translate raw price data into actionable insights.

The most fundamental tool is the price chart. This is the visual representation of a currency pair’s price over a specific period. While there are line charts and bar charts, most forex traders prefer candlestick charts. Each candlestick provides four key pieces of information for a time period: the opening price, closing price, highest price, and lowest price. The color and shape of the candlestick can reveal the momentum and a lot about the battle between buyers (bulls) and sellers (bears), making them incredibly useful for spotting short-term sentiment shifts.
Next, analysts use technical indicators, which are mathematical calculations based on price, volume, or open interest. These are plotted on the chart to help clarify price action and provide trading signals. Common examples include:
- Moving Averages (MAs): These smooth out price data to help identify the underlying trend direction. A price trading above its 50-day moving average is generally considered to be in an uptrend.
- Relative Strength Index (RSI): This is a momentum oscillator that measures the speed and change of price movements. It helps identify overbought (typically above 70) or oversold (typically below 30) conditions.
- Moving Average Convergence Divergence (MACD): This trend-following momentum indicator shows the relationship between two moving averages of a security’s price. Crossovers of the MACD lines can signal potential buy or sell opportunities.
Another critical element is identifying support and resistance levels. Support is a price level where a downtrend is expected to pause due to a concentration of demand or buying interest. Resistance is the opposite, a price level where an uptrend is expected to pause temporarily, due to a concentration of selling interest. These levels represent key psychological barriers where the balance between buyers and sellers can shift.
Finally, technical analysts study candlestick patterns. These are recognizable formations of one or more candlesticks that can signal a potential reversal or continuation of a trend. For example, an “Engulfing” pattern, where one candle completely covers the body of the previous one, can indicate a powerful shift in market sentiment and a potential trend change.
What is Fundamental Analysis in Forex Trading?
Fundamental analysis is a method of evaluating a currency’s intrinsic value by examining a country’s economic, social, and political factors. Unlike technical analysis, which focuses on price charts, fundamental analysis seeks to understand the underlying drivers that make a currency strong or weak. The central idea is to determine if a currency is currently trading above or below its “fair value.” A fundamental analyst believes that in the long run, a currency’s exchange rate will reflect the health of its corresponding economy.
To do this, analysts pore over a wide range of data to build a comprehensive picture of a nation’s economic state. They are essentially economic detectives, trying to answer the question, “Why should this currency’s value go up or down?” For example, if a country’s economy is growing robustly, its unemployment rate is low, and its central bank is raising interest rates to control inflation, a fundamental analyst would conclude that its currency is likely to strengthen. This method is less about predicting short-term price swings and more about forecasting long-term trends based on the big-picture economic outlook.
What are the Core Principles of Fundamental Analysis?
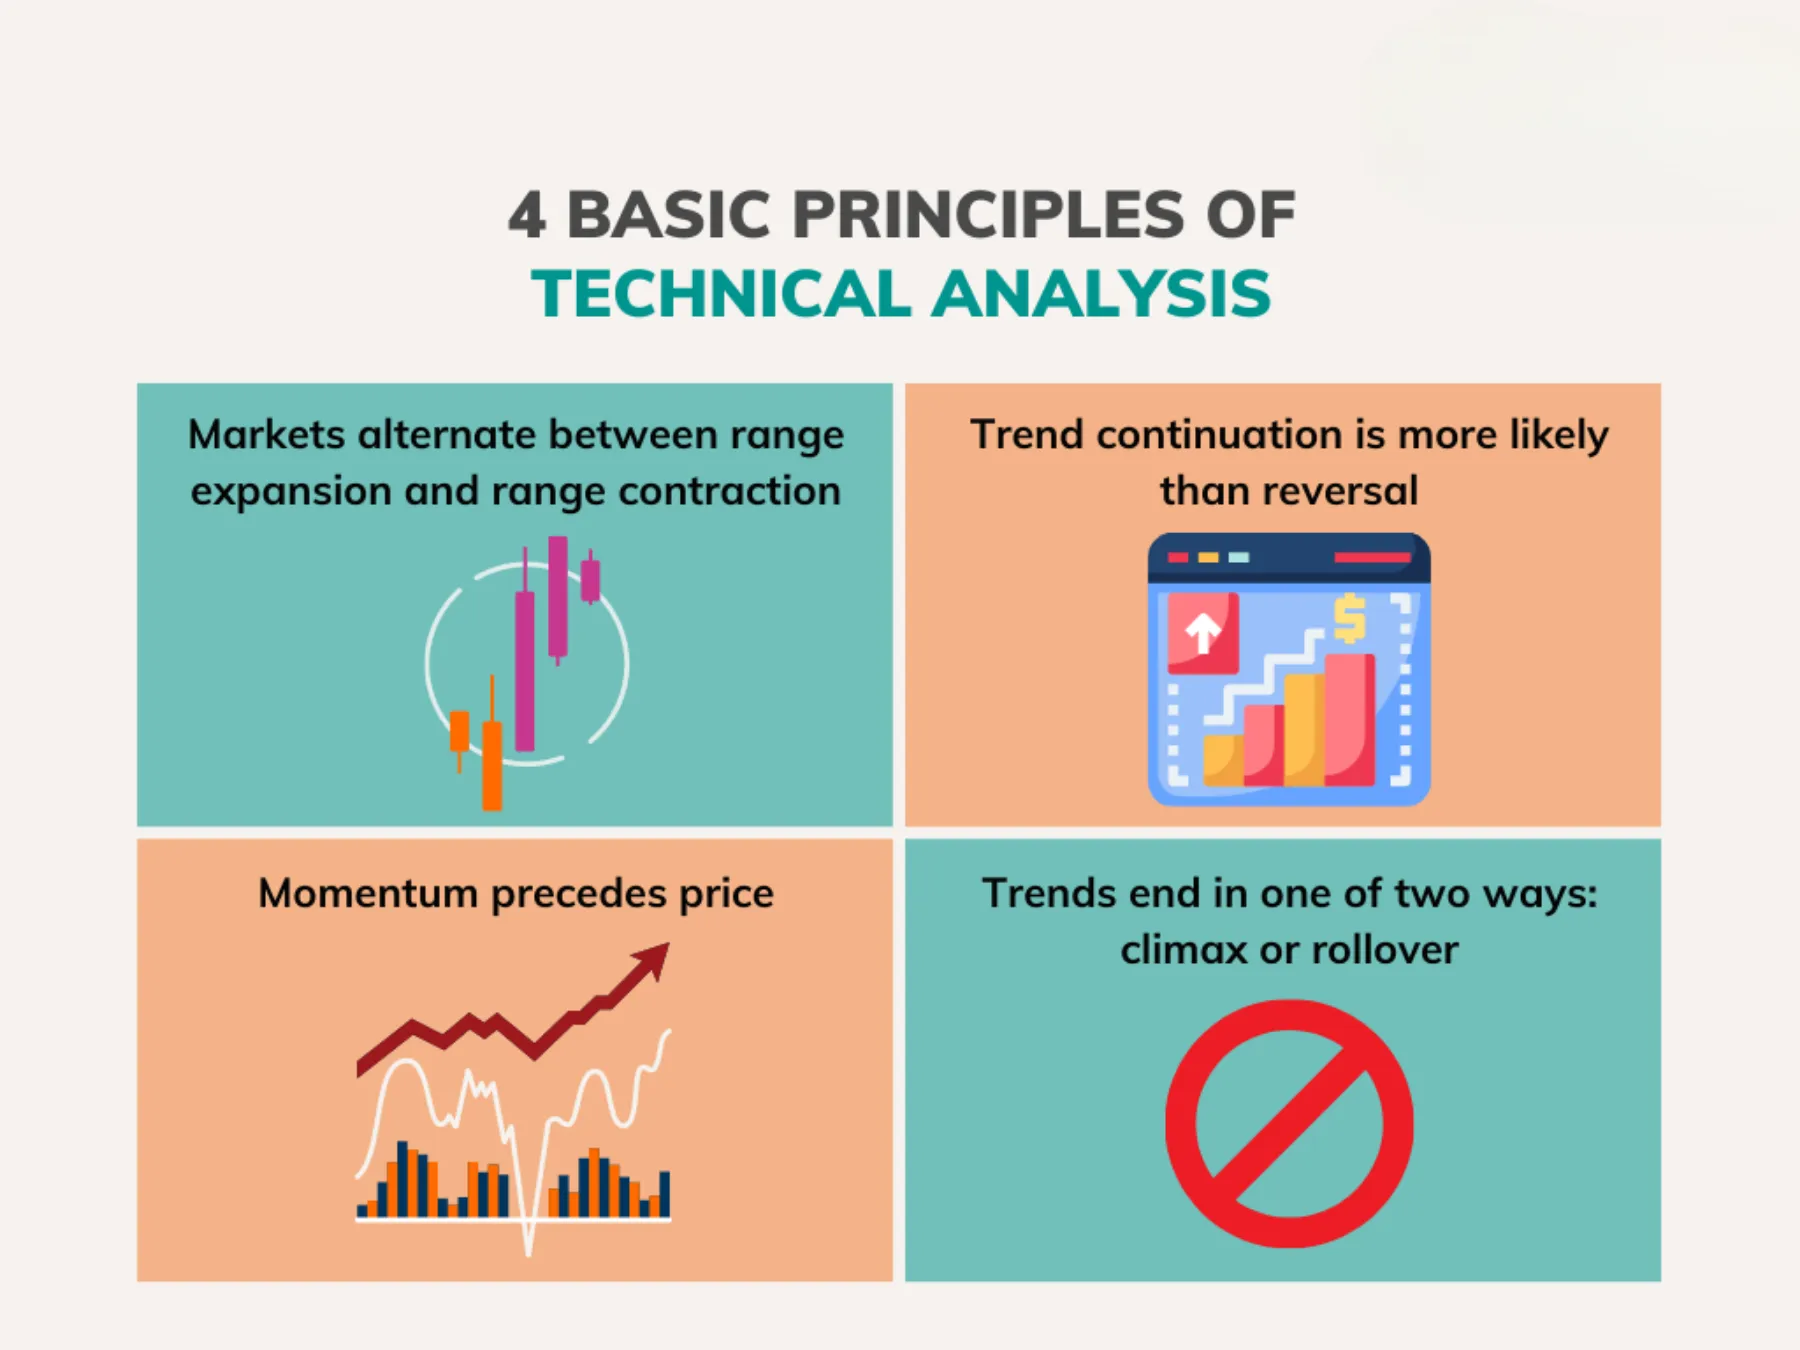
The core principle of fundamental analysis is straightforward: a country’s economic health and stability are the primary drivers of its currency’s value over the long term. This approach assumes that every currency has an intrinsic, or true, value based on the strength of its economy. The market price may deviate from this value in the short term due to speculation or market sentiment, but it will eventually revert to its fundamental value. A fundamental trader’s job is to calculate this value and trade based on the discrepancy.
For instance, if the fundamental data for Japan suggests a strengthening economy, but the Japanese Yen (JPY) is currently weak against the U.S. Dollar (USD), a fundamental analyst might buy the JPY. They would do so with the expectation that the market will eventually recognize the underlying economic strength and push the currency’s price higher to reflect its true worth. This philosophy makes fundamental analysis a proactive approach rather than a reactive one. Instead of reacting to price movements as they happen, analysts try to anticipate them based on shifts in the economic landscape. This is why it is often associated with a longer-term investment style, as economic trends can take months or even years to fully play out in the currency markets.
What Does a Fundamental Analyst Look At?
A fundamental analyst examines a wide array of data points to assess the health of an economy and forecast its currency’s direction. These data sources can be grouped into three main categories.

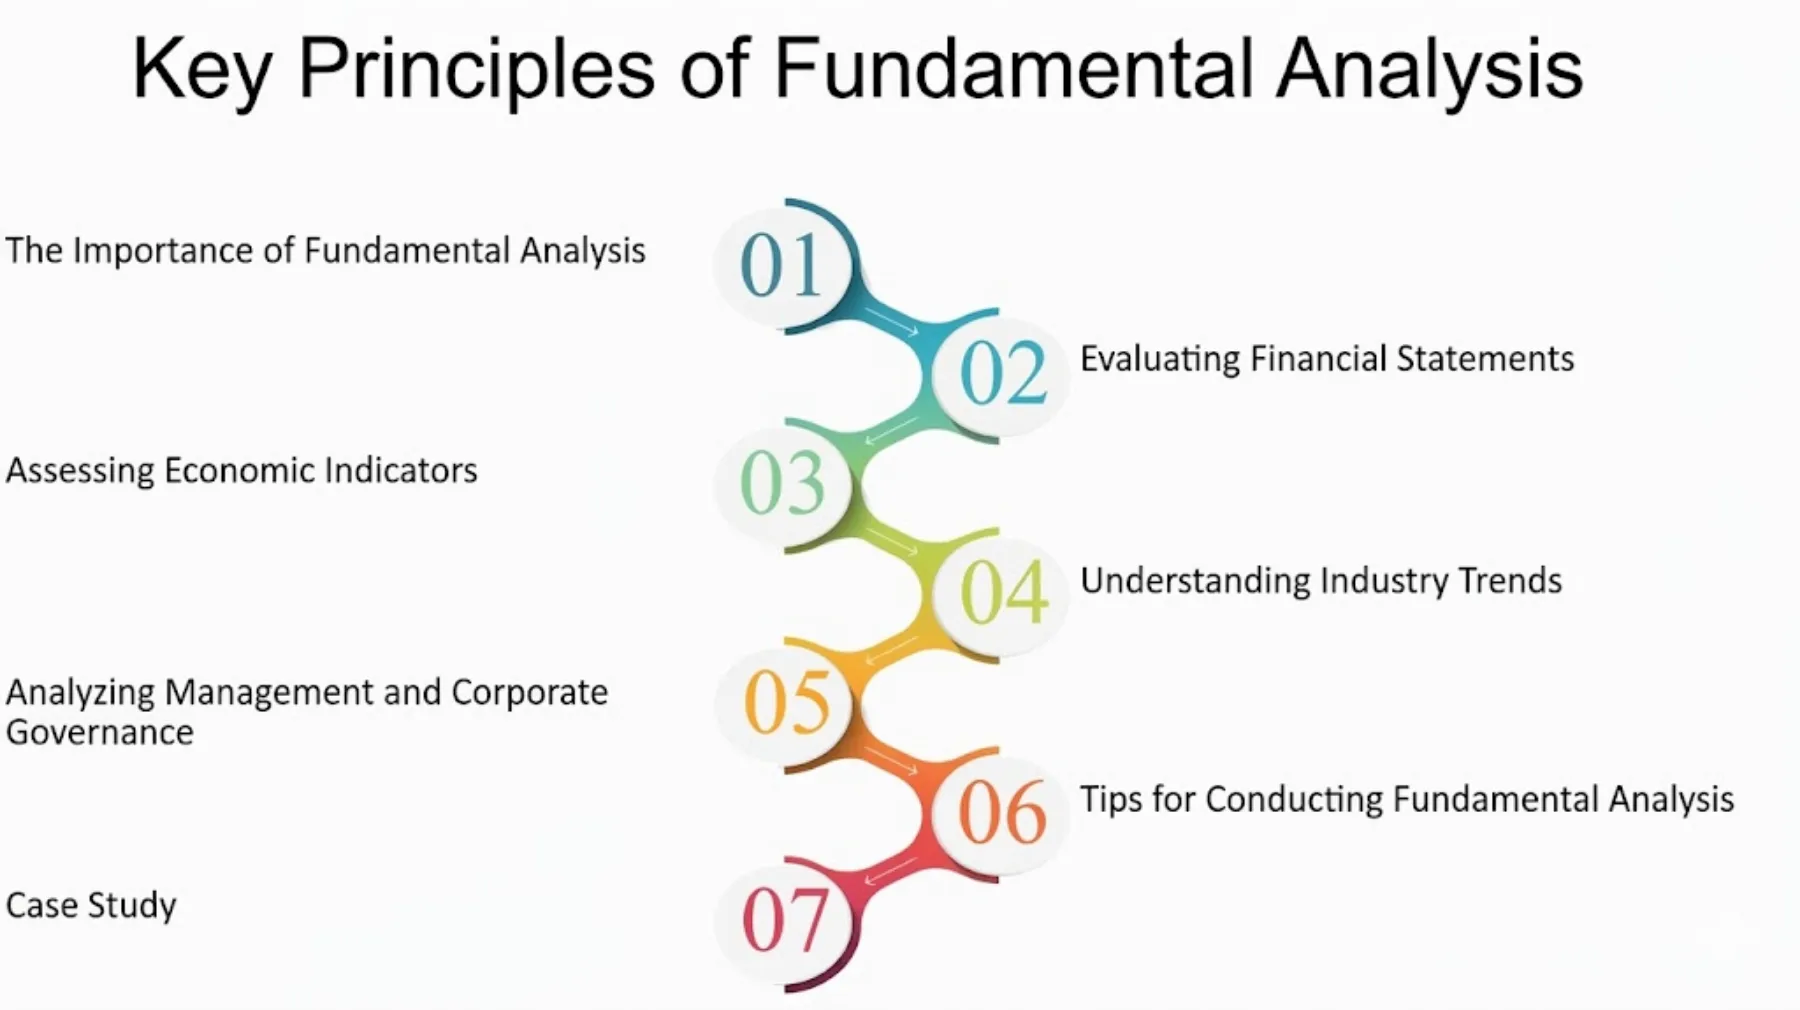
The first and most important category is economic indicators. These are statistical reports released by governments and private organizations that provide a snapshot of economic performance. Key indicators include:
- Gross Domestic Product (GDP): This is the broadest measure of a country’s economic output and is a primary gauge of its health. A high GDP growth rate signals a strong economy, which is bullish for its currency.
- Inflation Rate (CPI/PPI): The Consumer Price Index (CPI) measures the rate of inflation. Moderate inflation is healthy, but high inflation can erode purchasing power. Central banks often raise interest rates to combat high inflation, which typically strengthens a currency.
- Employment Rates: Reports like the U.S. Non-Farm Payrolls (NFP) are watched very closely. Low unemployment and strong job growth indicate a robust economy, which is positive for the currency.
The second category is central bank monetary policy. The decisions made by a country’s central bank, such as the U.S. Federal Reserve (Fed) or the European Central Bank (ECB), have a massive impact on currency values. Analysts pay close attention to interest rate decisions, as higher interest rates tend to attract foreign investment, increasing demand for and the value of the home currency. They also monitor the bank’s statements and forward guidance for clues about future policy moves.
The third category is geopolitical events. Political stability, elections, trade negotiations, and international conflicts can all create uncertainty and volatility in the forex market. For example, an unexpected election result or the escalation of a trade war can cause investors to flee a currency for a perceived “safe-haven” currency like the Swiss Franc (CHF) or Japanese Yen (JPY). A fundamental analyst must stay informed about world events to understand the risks and opportunities they present.
What are the Main Differences Between Technical and Fundamental Analysis?
The main difference is that technical analysis studies the effect of price movements (“what”) while fundamental analysis studies the cause of those movements (“why”). Technical analysts believe all necessary information is already reflected in the price chart, using historical data to forecast future trends. In contrast, fundamental analysts look at economic data and geopolitical events to determine a currency’s true value, believing market price will eventually align with it.
To explore this further, let’s break down the distinctions. A technical trader might see an uptrend on the EUR/USD chart and decide to buy, simply because the pattern suggests the price will continue to rise. They don’t need to know about the latest inflation report from the Eurozone. A fundamental trader, however, would analyze that same inflation report. If the data shows rising inflation, they might buy the EUR/USD with the expectation that the European Central Bank will raise interest rates, strengthening the Euro over the coming months. One focuses on the chart’s story, the other on the economic story behind it.
How Do Their Primary Goals Differ?
The primary goals of technical and fundamental analysis are distinct and reflect their different philosophies.

The goal of technical analysis is to identify trading opportunities and manage risk by analyzing statistical trends gathered from trading activity. A technical trader’s main objective is to pinpoint optimal entry and exit points for trades. They are focused on timing the market. By using tools like indicators and chart patterns, they aim to predict the most probable short-term direction of the price. For example, when the RSI indicator shows an “oversold” condition on a currency pair, a technical trader sees a high-probability opportunity to buy, expecting a short-term bounce. Their success is measured by their ability to repeatedly capture profits from market fluctuations, regardless of the underlying economic reasons for those movements.
Conversely, the goal of fundamental analysis is to determine a currency’s intrinsic value to identify long-term investment opportunities. A fundamental analyst is not primarily concerned with short-term price swings. Instead, their objective is to ascertain if a currency is currently overvalued or undervalued relative to its economic health. If their analysis suggests a country’s economy is poised for strong growth, they might buy its currency and hold it for months or even years, waiting for the market to correct its valuation. Their success depends on correctly forecasting long-term economic trends and having the patience to wait for their thesis to play out. They are trying to be right about the “big picture” direction, not the next hour’s price action.
How Do Their Applicable Timeframes Differ?
The differing goals of each analysis method naturally lead to their application across different trading timeframes.
Technical analysis is most commonly applied to short-to-medium term trading. The signals generated from charts and indicators are often fleeting and are designed to capture moves that last anywhere from a few minutes to a few weeks. This makes it the preferred method for styles like:
- Scalping: Holding trades for just a few seconds or minutes to profit from very small price changes.
- Day Trading: Opening and closing trades within the same day, avoiding overnight risk.
- Swing Trading: Holding trades for several days or weeks to capture a “swing” or a single move within a larger trend.
On the other hand, fundamental analysis is typically used for long-term position trading. The economic factors it examines, such as GDP growth or shifts in monetary policy, develop slowly over long periods. A change in a country’s interest rate policy, for instance, might take months to fully impact its currency’s value. Therefore, a fundamental trader often holds positions for weeks, months, or even years, waiting for their long-term economic forecast to materialize. Their strategy is based on the belief that strong fundamentals will ultimately prevail over short-term market noise. While a fundamental analyst might use technical analysis to fine-tune their entry point, their decision to be in the trade is driven entirely by their long-term economic outlook.
Which Analysis Method Should a Forex Beginner Learn First?
A forex beginner should focus on learning technical analysis first because it provides a clear, rule-based approach to trading with readily available data. This method centers on interpreting price charts, which offers immediate visual feedback and helps new traders develop discipline by providing concrete signals for when to enter and exit a position. While fundamental analysis is powerful, its complexity and reliance on interpreting broad economic data can be overwhelming for someone just starting.
Let’s explore this recommendation. When you’re new to forex, your primary challenges are managing risk and building a consistent strategy. Technical analysis provides a framework to address both. You can learn to identify a simple trend, use an indicator like a moving average to confirm it, and set a stop-loss order based on a recent support level. This entire process is self-contained within the trading platform, making it highly accessible. Trying to start with fundamental analysis, however, would require you to immediately understand the nuances of inflation reports, central bank rhetoric, and geopolitical tensions, which is a much steeper learning curve.
Is Technical Analysis Better for Beginners to Learn First?
Yes, technical analysis is generally better for beginners to learn first for several practical reasons. It provides a more structured and less ambiguous entry point into the world of trading.
First, it provides clear entry and exit signals. A technical setup, like a price bouncing off a well-defined support level or a moving average crossover, gives a novice trader a specific reason to enter a trade. Similarly, it offers clear invalidation points. If the price breaks below that support level, the trade idea is wrong, and it’s time to exit. This helps remove emotion and guesswork from decision-making, which are common pitfalls for beginners. Fundamental analysis, in contrast, can be more subjective. An economic report might be “good,” but how good is good enough to justify a trade? This ambiguity can lead to hesitation and poor decisions.
Second, it helps build discipline through a defined set of rules. A beginner can create a simple trading plan based entirely on technical criteria. For instance: “I will only buy EUR/USD if the price is above the 200-period moving average and the RSI is below 70.” This rule-based approach is crucial for developing the consistency and risk management habits needed for long-term success.
Finally, the data for technical analysis is universally accessible and easy to understand. Every trading platform comes equipped with advanced charting tools and indicators for free. A new trader can open a chart and immediately start practicing pattern recognition and indicator analysis on historical data. Accessing and correctly interpreting the vast amount of data required for thorough fundamental analysis is a much more demanding task, often requiring subscriptions to news services and a deep understanding of economics.
Why Should a Beginner Still Understand the Basics of Fundamental Analysis?
Even if a beginner focuses primarily on technical analysis, completely ignoring fundamental analysis is a major risk. A beginner must understand the basics of fundamental analysis because major economic news events are the primary drivers of sudden, high-impact volatility that can override any technical pattern. Think of technical analysis as navigating a ship by reading the waves, but fundamental events are the tsunamis that can appear without warning if you aren’t watching the horizon.
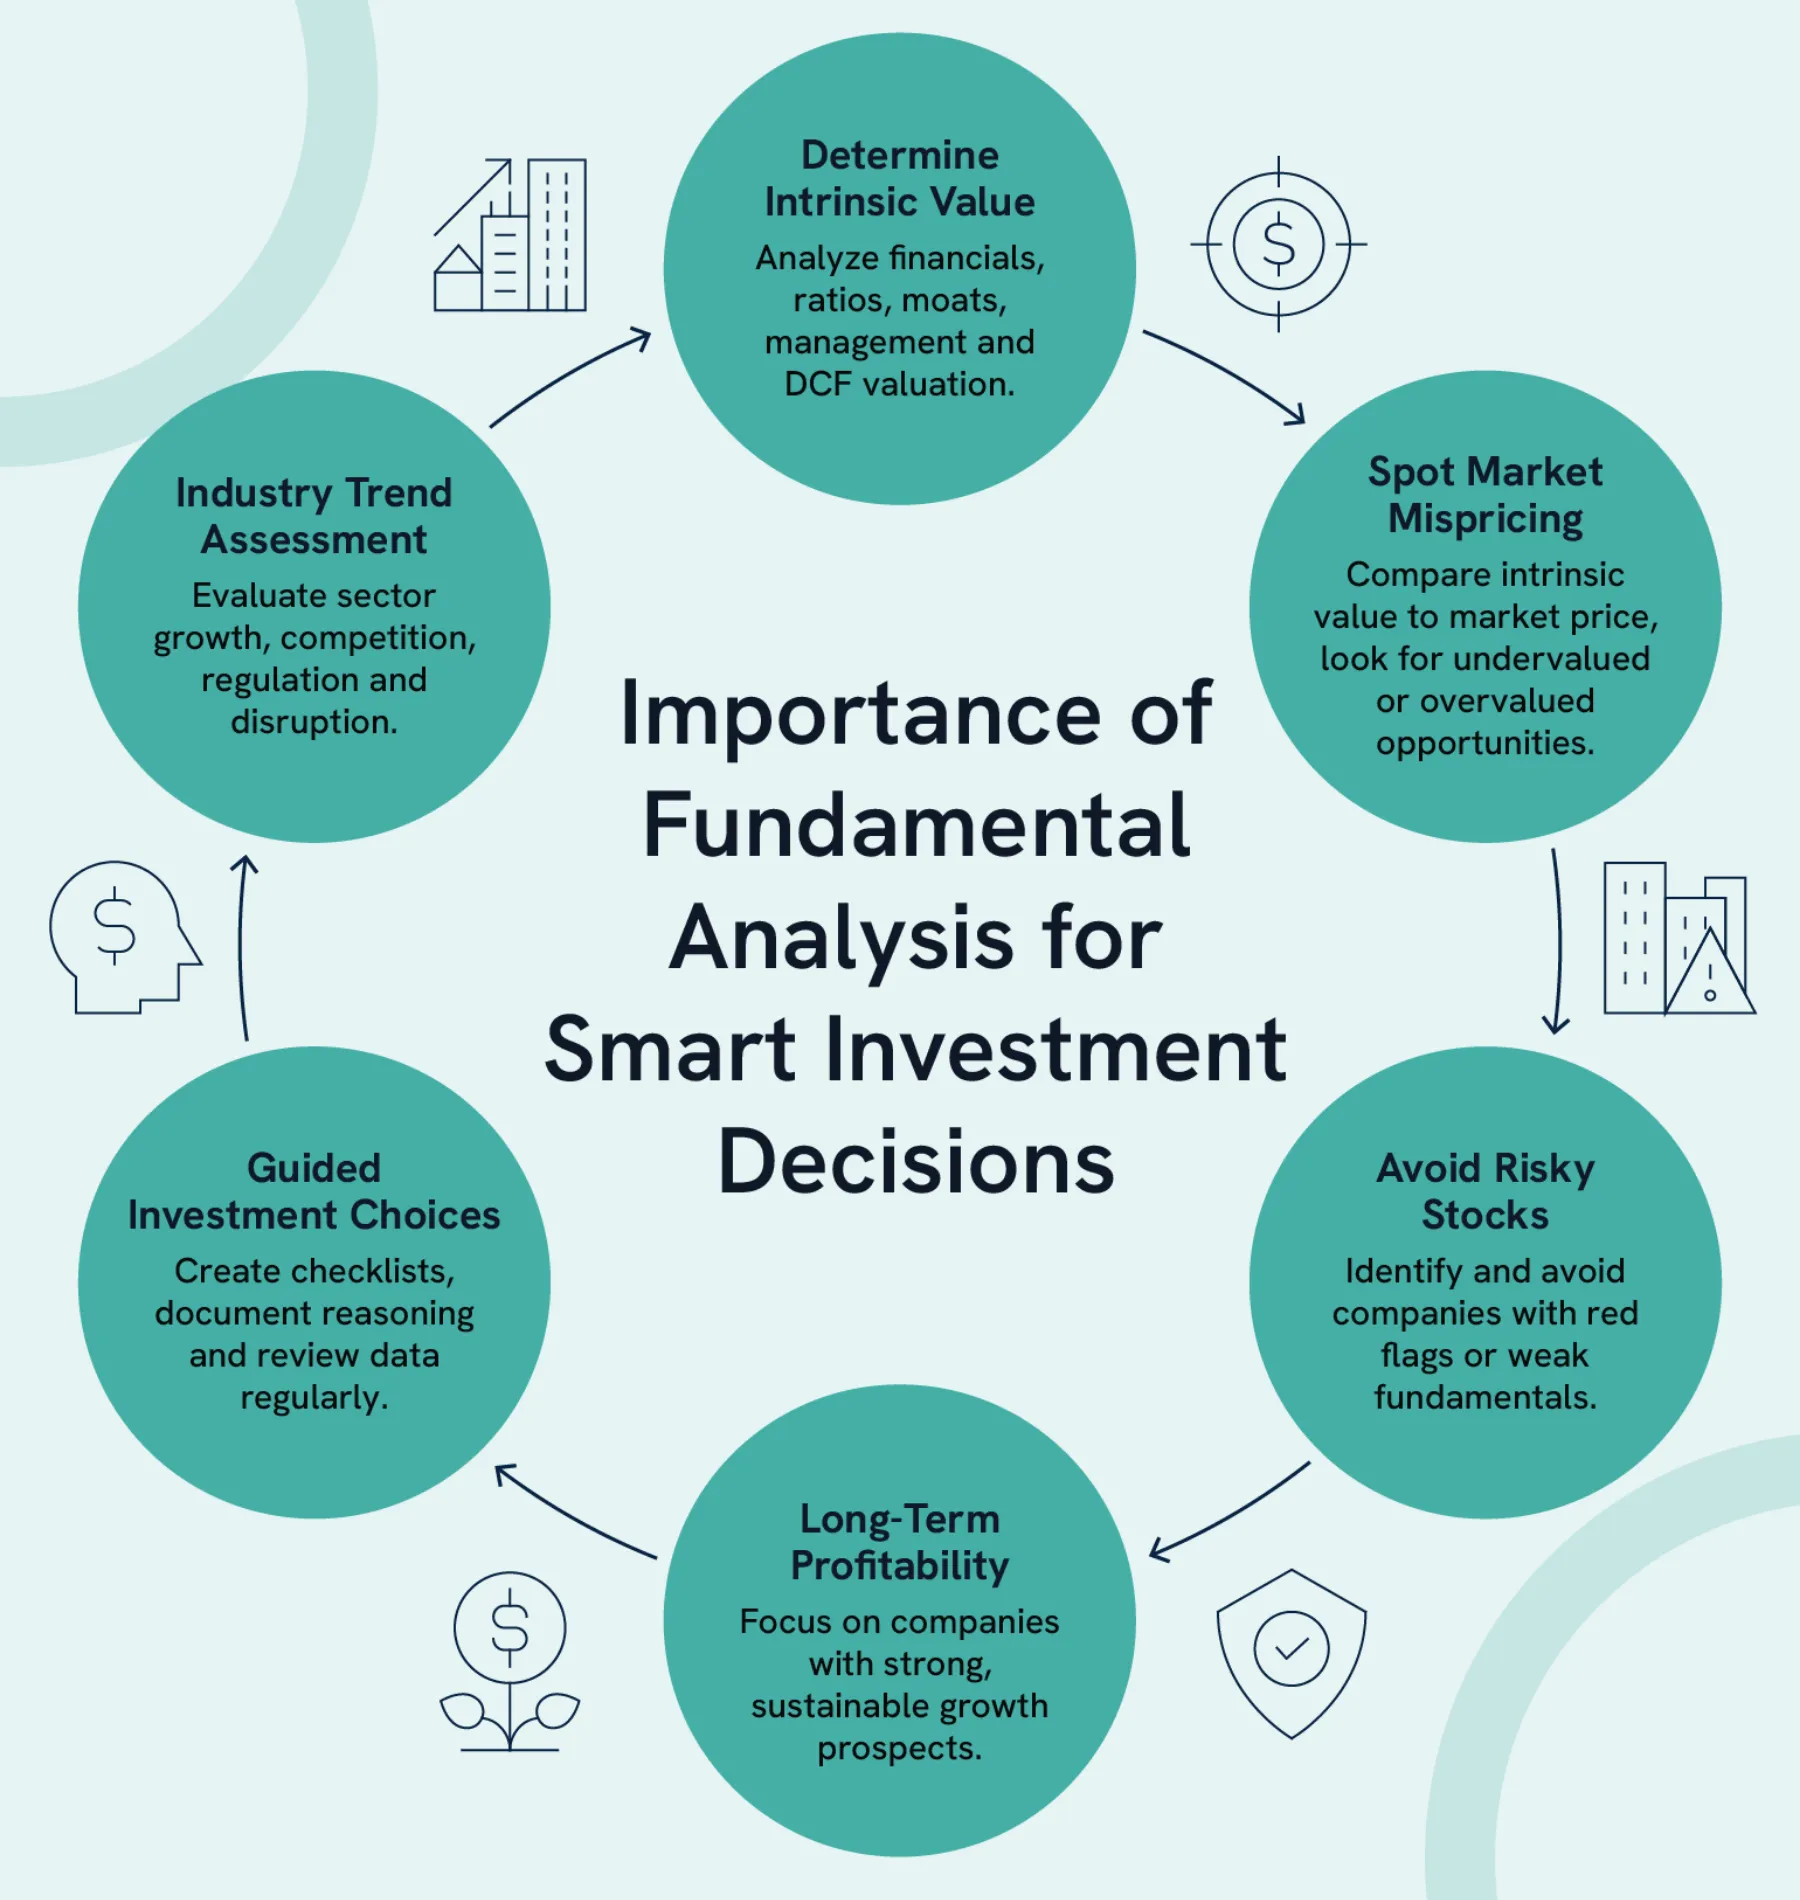
For a technical trader, the most practical application of fundamental analysis is risk management. You don’t need to be an expert economist, but you must be aware of when major news is scheduled for release. This is done by using an economic calendar, which lists upcoming reports like interest rate decisions, inflation data (CPI), and employment figures (NFP). During these releases, market liquidity can dry up and volatility can spike, causing prices to move erratically and “gap” past your stop-loss orders. A smart technical trader will often choose to sit out of the market during these high-impact events or ensure their positions are well-protected.
Furthermore, understanding the fundamental backdrop provides context for what you see on the charts. If your technical signals are telling you to buy a currency, but you know that country’s central bank is expected to cut interest rates soon (a fundamentally bearish event), you might choose to be more cautious or skip the trade altogether. This basic awareness helps you avoid trading against a powerful underlying tide and can explain why a seemingly perfect technical setup might suddenly fail. In short, while you may trade with technical tools, fundamental awareness tells you when the playing field is about to change.
What Other Questions Do Traders Have About Analysis Methods?
Traders often have questions about combining analysis methods, using specific indicators, and understanding alternative approaches like sentiment analysis. Additionally, moving beyond the initial “which one is better” debate, traders explore how these disciplines work in practice and what tools are most effective for implementing them in the forex market. This deeper inquiry helps build a more robust and personalized trading strategy that fits individual goals and risk tolerance. Many successful traders find that the most effective approach is not to choose one method over the other but to learn how to integrate them.
Can Technical and Fundamental Analysis Be Used Together?
Absolutely, and many professional traders advocate for this integrated approach, often referred to as confluence. Think of fundamental analysis as your map for a long road trip. It helps you decide your destination, for example, identifying that a country’s economy is strong and its currency is likely to appreciate over the next few months. This gives you the “why” and the general direction. Technical analysis, on the other hand, is your GPS. It provides the turn by turn directions, telling you the best time to enter a trade, where to place a stop loss, and when to take profit. This is the “when” of your trade. By combining the two, a trader can use fundamentals to build a long term bullish bias on a currency pair and then use technical indicators to pinpoint a low risk entry point after a temporary price dip, creating a high probability setup.
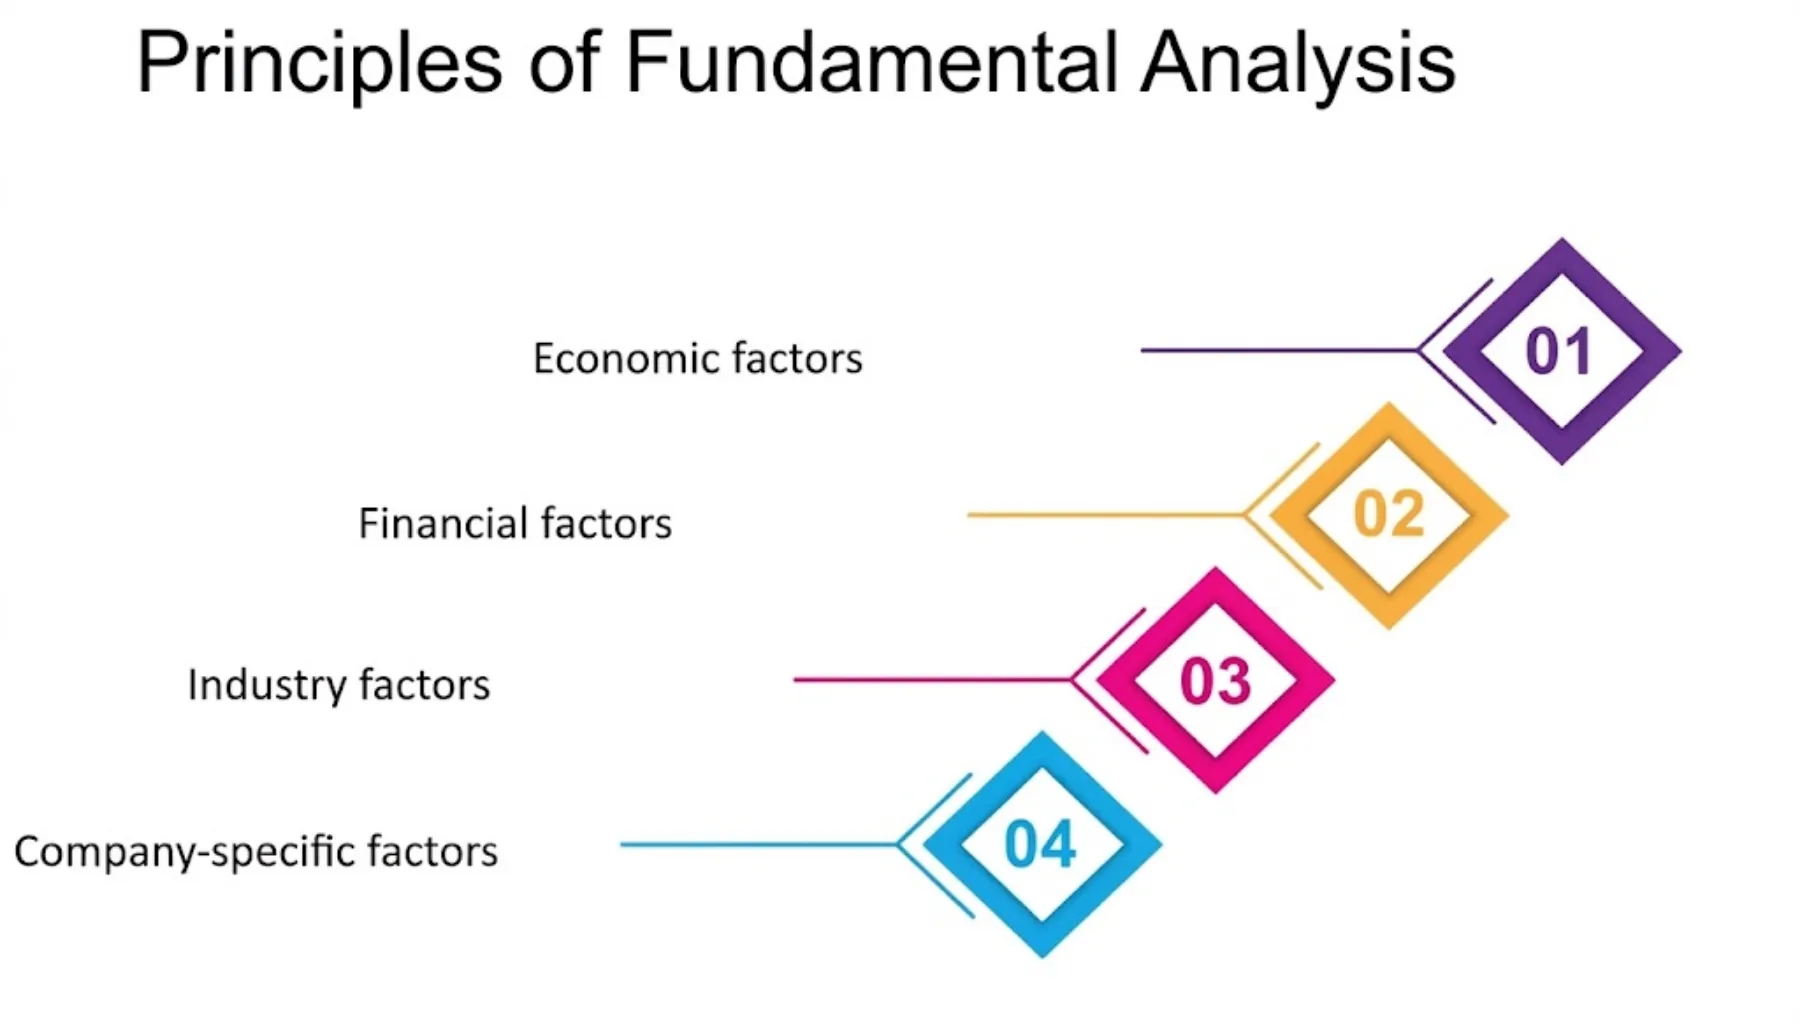
This synergistic approach offers a powerful way to filter trades and increase confidence. A trader might find a strong technical signal, but if it contradicts the fundamental outlook, they might decide to pass on the trade or reduce their position size.
- Fundamental analysis identifies the long term market driver.
- Technical analysis refines the timing for market entry and exit.
- Confluence occurs when both analyses point to the same conclusion.
What are the Most Common Technical Indicators for Forex?
While there are hundreds of technical indicators available, beginners should focus on a few foundational tools that provide clear and actionable information without overwhelming the price chart. Learning how these core indicators work is a great first step into technical analysis. A solid starting point includes understanding indicators that measure trend, momentum, and volatility. Many trading platforms like MetaTrader 4 and TradingView offer these tools as standard features, making them highly accessible.
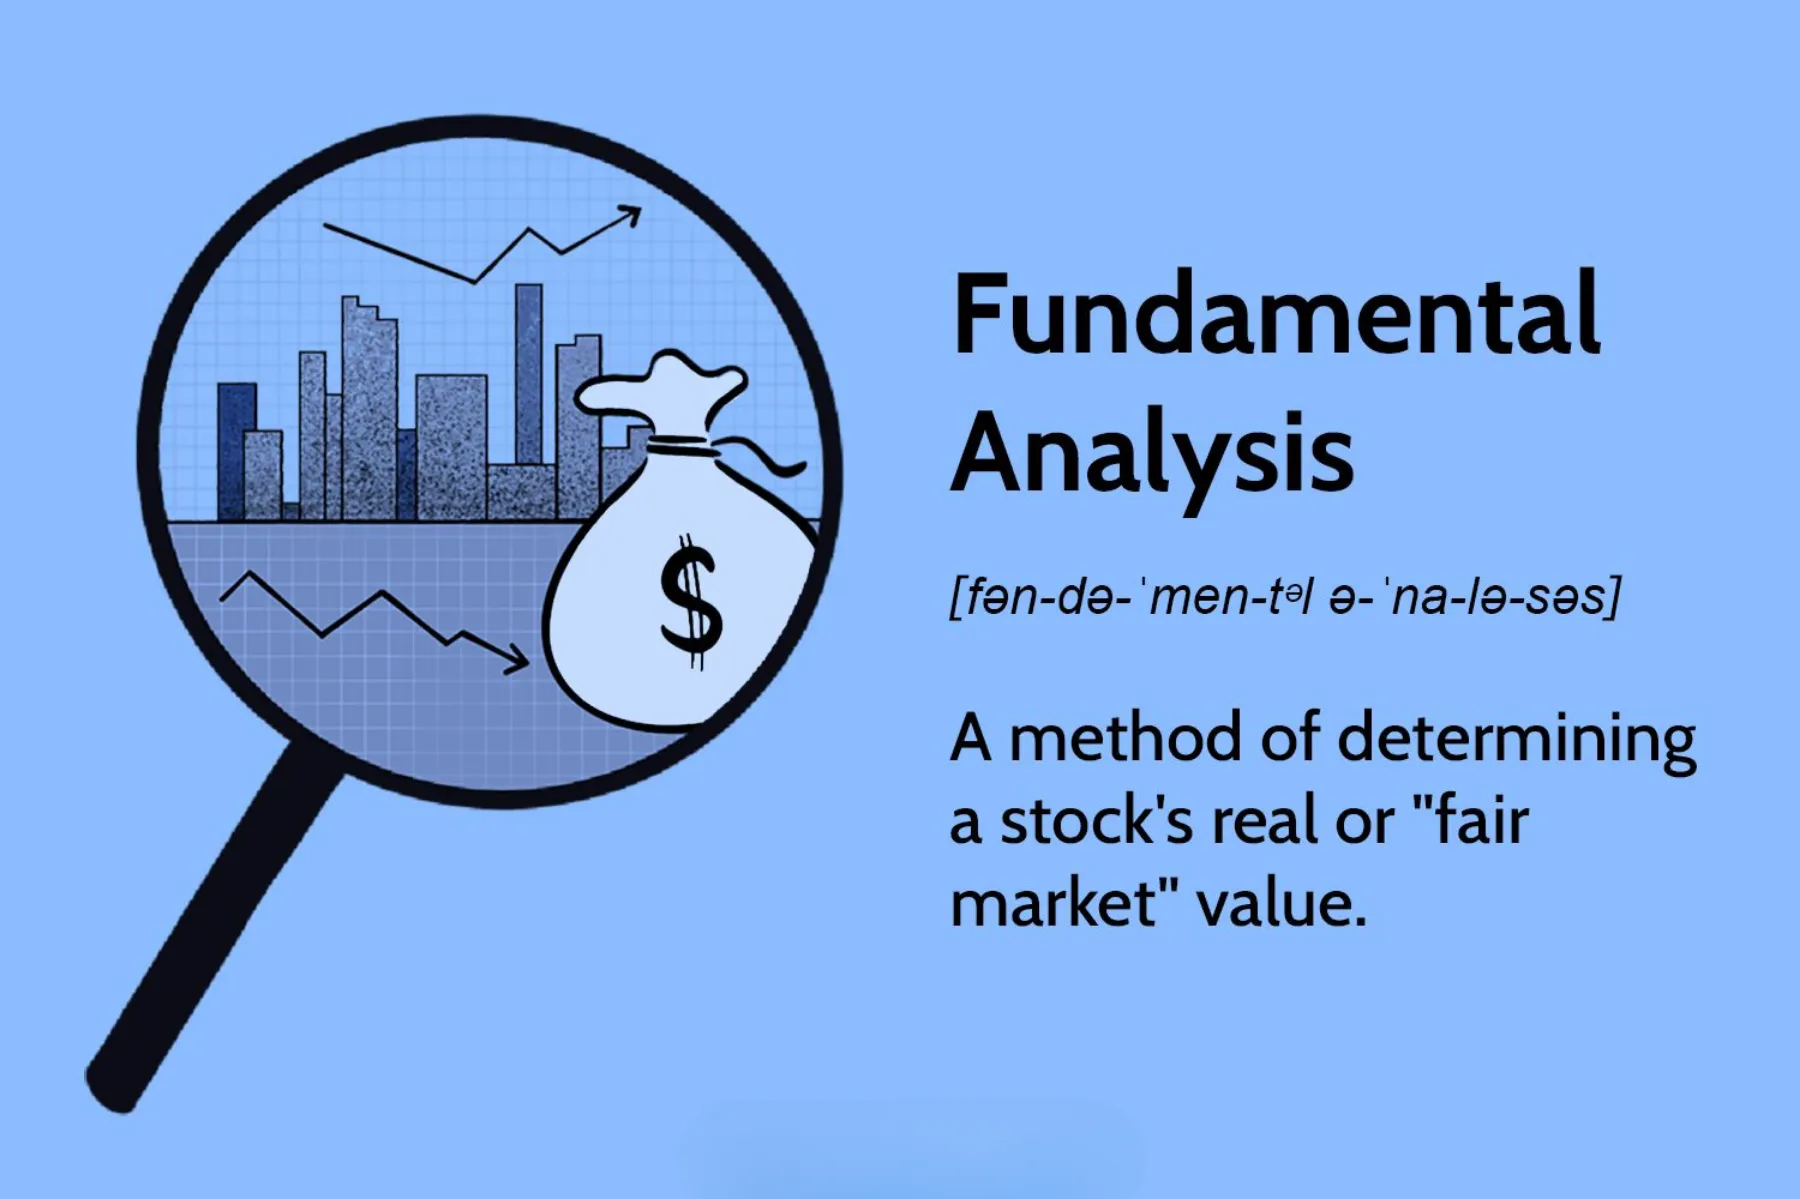
Starting with these common indicators can help you build a solid foundation.
- Moving Averages (MA): This indicator smooths out price data to create a single flowing line, making it easier to identify the direction of the trend. Traders often use two MAs, a short term and a long term one, to look for trend confirmations when they cross over.
- Relative Strength Index (RSI): The RSI is a momentum oscillator that measures the speed and change of price movements. It moves between 0 and 100 and is primarily used to identify overbought (typically above 70) or oversold (typically below 30) conditions in a market.
- Moving Average Convergence Divergence (MACD): This versatile indicator shows the relationship between two moving averages of a security’s price. The MACD can help traders identify momentum, trend direction, and potential trend reversals.
What are the Most Important Fundamental Indicators for Forex?
For fundamental analysis in forex, the most impactful data points are economic releases that directly influence a country’s monetary policy and economic health. These scheduled announcements can cause significant market volatility, presenting both opportunities and risks. Traders watch these releases closely because they provide clues about the future actions of central banks, which are the primary drivers of currency valuation. Keeping an economic calendar is a common practice for any trader who incorporates fundamentals into their strategy.
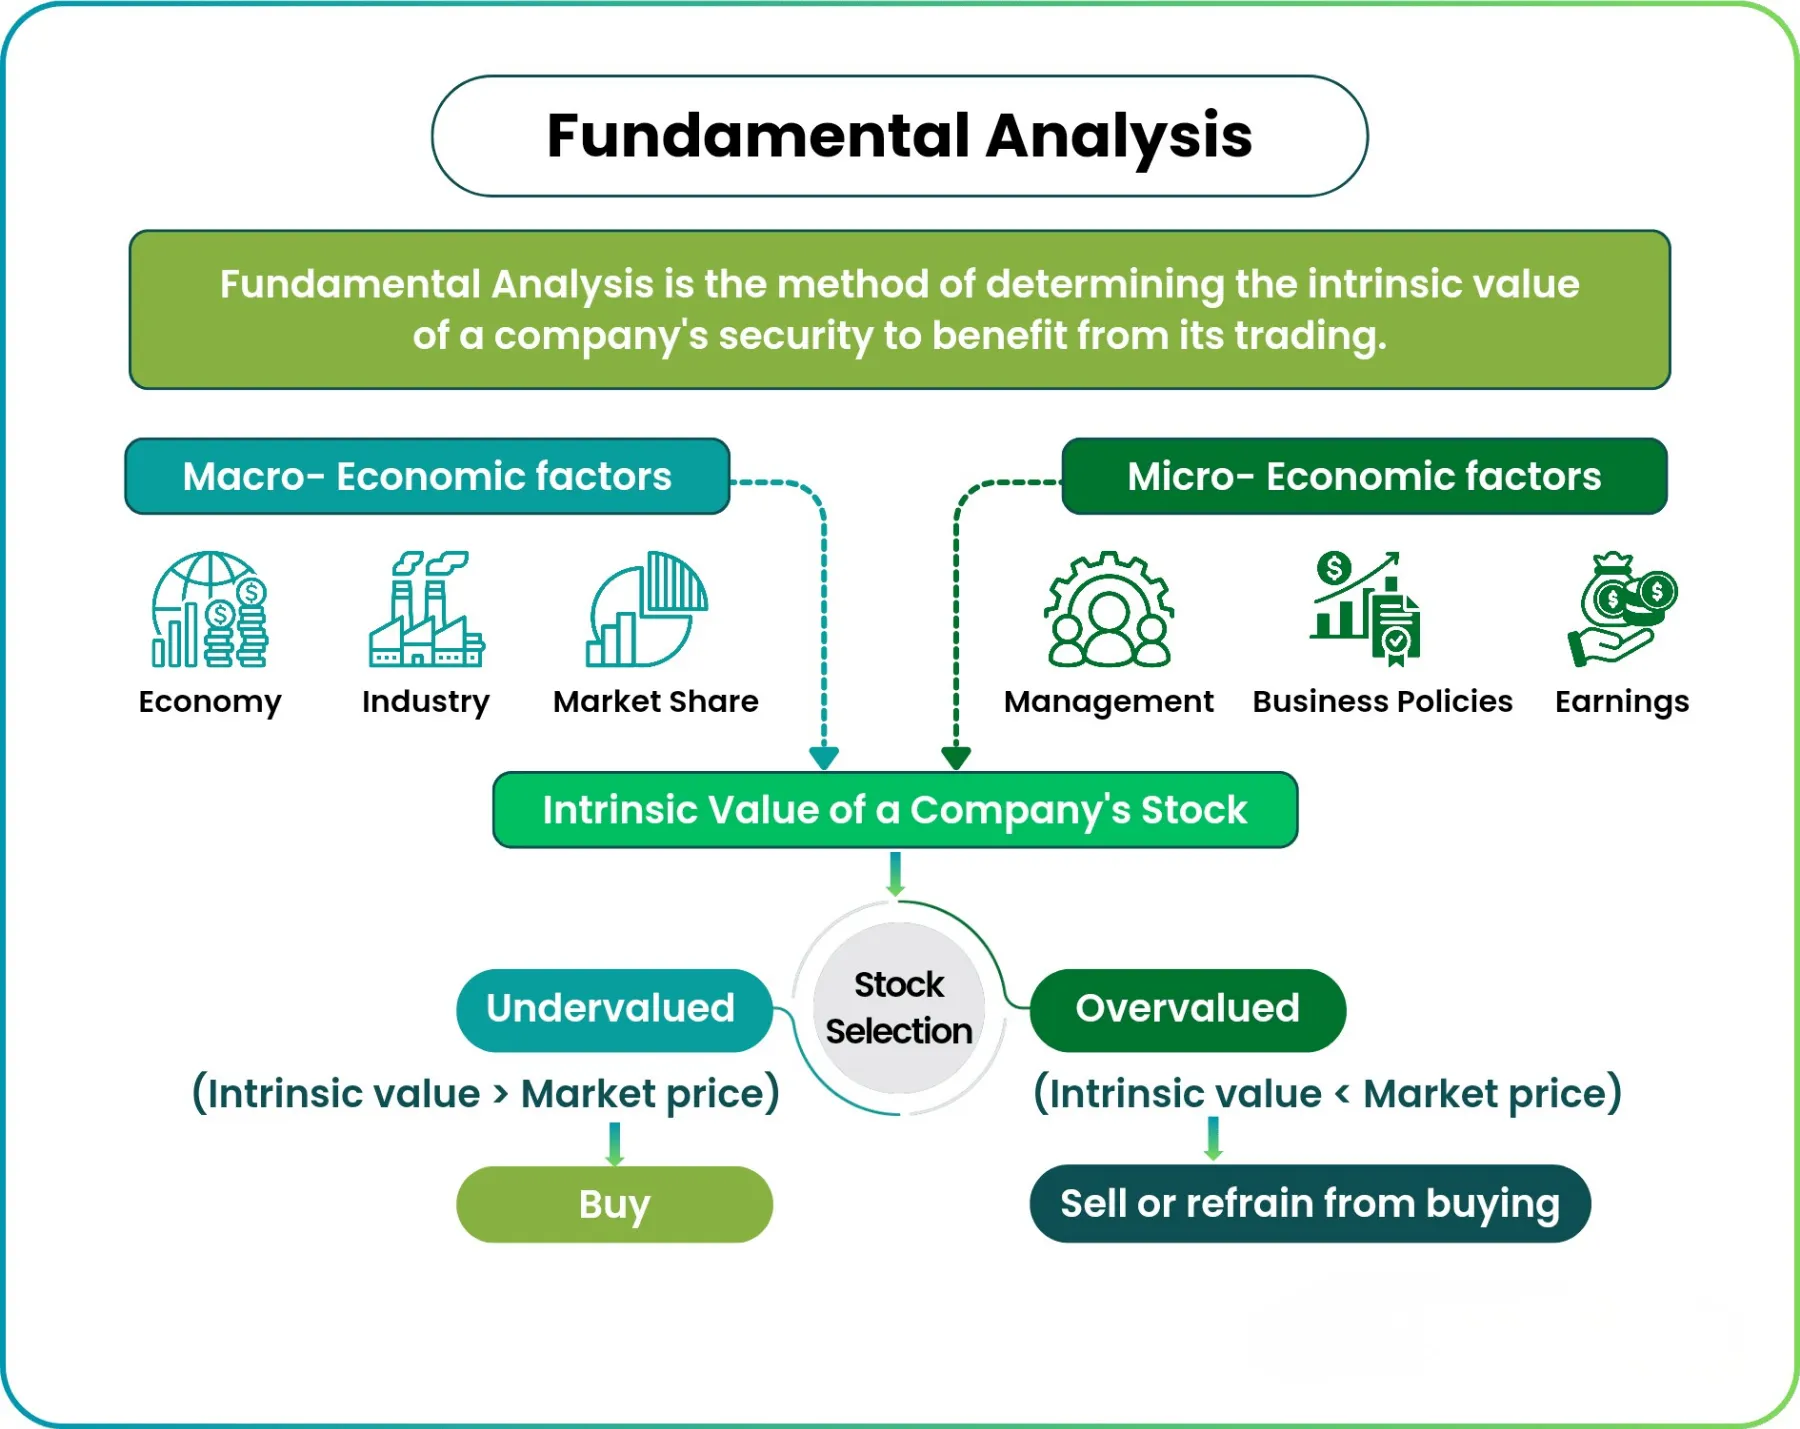
Monitoring these key releases provides insight into a currency’s underlying strength or weakness.
- Central Bank Interest Rate Statements: This is arguably the most important fundamental driver. When a central bank raises interest rates, it tends to attract foreign investment, increasing demand for and the value of the country’s currency.
- Non-Farm Payrolls (NFP): Released on the first Friday of every month in the United States, this report measures job creation and unemployment. Strong numbers suggest a healthy economy, which can lead to a stronger U.S. dollar.
- Consumer Price Index (CPI): This is the most widely used measure of inflation. High inflation often pressures a central bank to raise interest rates to cool down the economy, which can strengthen the currency.
How Does Sentiment Analysis Fit with Technical and Fundamental Analysis?
Sentiment analysis is often considered the third major type of market analysis, and it complements technical and fundamental approaches by gauging the overall mood or feeling of market participants. While fundamental analysis looks at economic health and technical analysis studies price action, sentiment analysis asks: “What is the crowd thinking and doing?” It tries to quantify whether the majority of traders are bullish (optimistic) or bearish (pessimistic) on a particular currency pair. This can serve as a powerful confirmation tool or even a contrarian indicator. For example, if an extreme number of traders are bullish, it might signal that the market is overextended and a reversal is near.

This form of analysis provides a unique perspective on market dynamics.
- Confirmation Tool: If your technical and fundamental analyses suggest a currency pair will rise, and sentiment indicators show that large speculators are also buying, it adds confidence to your trade idea.
- Contrarian Signal: Extreme sentiment can be a red flag. When almost everyone is on one side of a trade, it often means there are few people left to push the price further in that direction, indicating a potential reversal.
- Common Tools: A popular tool for this is the Commitment of Traders (COT) report, which is released weekly and shows the positions of large institutional traders, commercial entities, and smaller retail traders.