

Blog
Technical vs. Fundamental Analysis in Forex: Which Approach Is Better?

When deciding between technical and fundamental analysis in forex trading, the most effective strategy is not choosing one over the other, but rather using a blended approach that suits your trading personality and time horizon. Neither technical nor fundamental analysis is universally superior; their power is unlocked when they are used together to create a complete market view. Fundamental analysis can help you identify a long-term directional bias for a currency pair, while technical analysis provides the specific entry and exit points to act on that bias. This synergy allows traders to make more informed and higher-probability decisions.
The main difference between the two methods lies in the data they use and the questions they answer. Technical analysis focuses on price charts and market statistics to determine when to trade, while fundamental analysis studies economic reports and geopolitical news to understand why a currency’s value is changing. A technical trader looks at patterns, trends, and indicators on a chart, believing all necessary information is already reflected in the price. A fundamental trader, on the other hand, examines interest rates, inflation, and employment data to assess the underlying health of an economy and its currency.
For those just starting in forex, technical analysis is often more accessible and easier to apply immediately. Beginners tend to favor technical analysis because its visual nature provides clear, actionable signals for entering and exiting trades without requiring a deep knowledge of macroeconomics. Tools like support and resistance levels or moving average crossovers offer straightforward rules that can be quickly learned and implemented. Fundamental analysis, while powerful, involves a steeper learning curve, as it requires understanding complex economic relationships and staying updated on global news.
Ultimately, the debate of technical versus fundamental analysis presents a false choice. The most successful traders learn to speak both languages. They use fundamental analysis to form a broad market thesis and then deploy technical analysis to execute trades with precision. By understanding the core principles, tools, and unique strengths of each methodology, you can build a trading strategy that is both robust and adaptable to ever-changing market conditions.
What is Technical Analysis in Forex Trading?
Technical analysis is a trading discipline that evaluates currencies by analyzing statistical trends gathered from trading activity, such as price movement and volume. This approach operates on the core belief that all known information, including economic data and market sentiment, is already reflected in the price of a currency pair. Therefore, a technical analyst focuses almost exclusively on price charts to forecast where the market is headed next. Instead of trying to understand the economic reasons behind price fluctuations, they study historical price patterns and market structures, assuming that history tends to repeat itself.
To understand this better, let’s explore the core ideas and powerful tools that form the foundation of technical analysis. It is less about a currency’s intrinsic value and more about identifying trends, patterns, and probable turning points based on the collective behavior of market participants as seen on a chart. This makes it a popular choice for traders who prefer a structured, data-driven approach to their decision-making.
What are the Core Principles of Technical Analysis?
The entire field of technical analysis is built on three foundational tenets that guide every decision a technical trader makes.
First, the market discounts everything. This is the cornerstone of technical analysis. It means that any factor that could possibly affect a currency’s price, from interest rate announcements and inflation reports to political instability and trader sentiment, is already priced into the market. A technical analyst believes there is no need to study these external factors separately because their collective impact is visible in the price action on the chart. If the EUR/USD is rising, the reasons are less important than the fact that buying pressure is exceeding selling pressure.
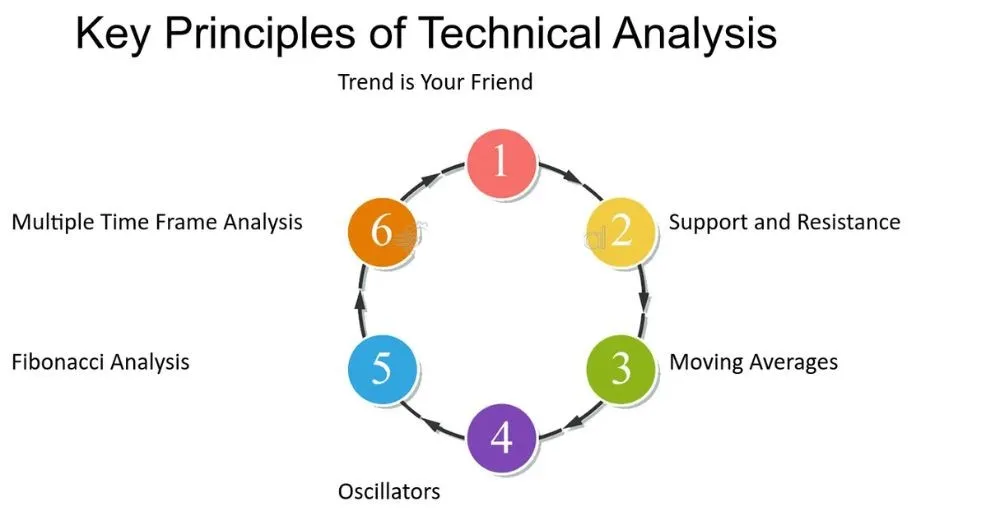
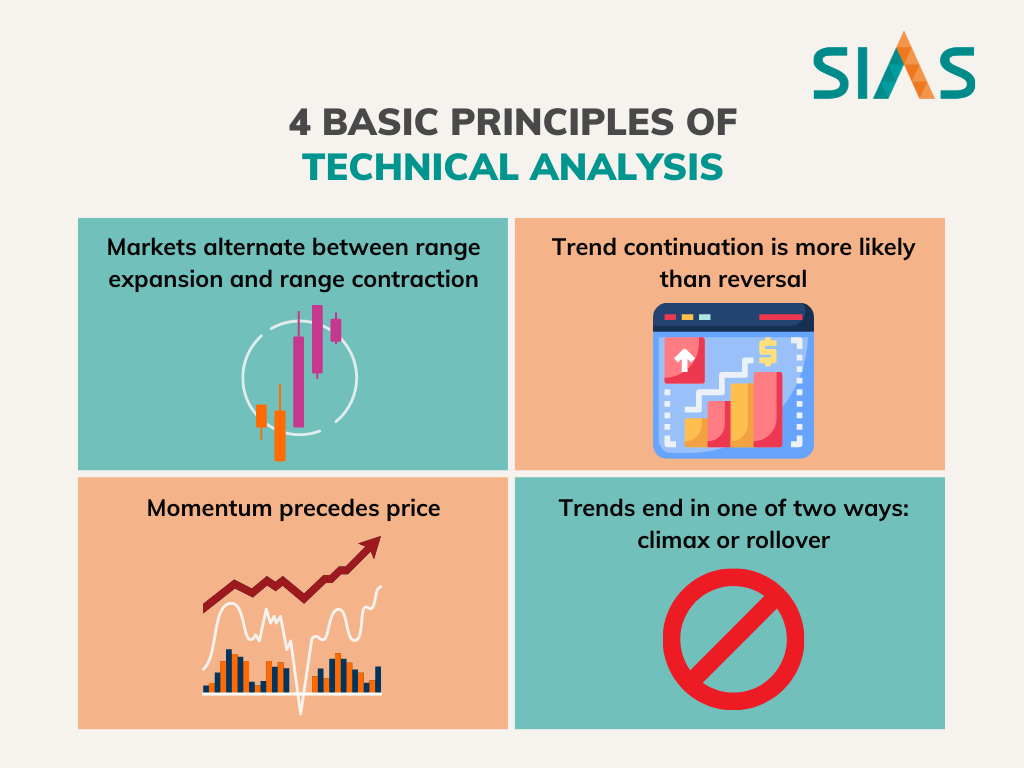
Second, prices move in trends. A key goal of technical analysis is to identify a trend in its early stages to trade in the direction of that trend. Prices do not move randomly or erratically. Instead, they typically move in a specific direction, either up (an uptrend), down (a downtrend), or sideways (a range). Once established, a trend is more likely to continue than to reverse. Technical tools are designed specifically to help traders identify the direction and strength of these trends.
Third, history tends to repeat itself. This principle is rooted in market psychology. Chart patterns, which are visual representations of buying and selling pressure, have been identified and categorized for over a century. Patterns like “head and shoulders” or “double tops” tend to produce similar outcomes time and time again because they are driven by consistent human emotions like fear and greed. A technical analyst studies past patterns to gain insight into how the market might behave in the future when a similar pattern appears.
What are the Common Tools for Technical Analysis?
Technical analysts use a variety of tools to interpret price action and generate trading signals. These tools help visualize data and make sense of complex market movements.

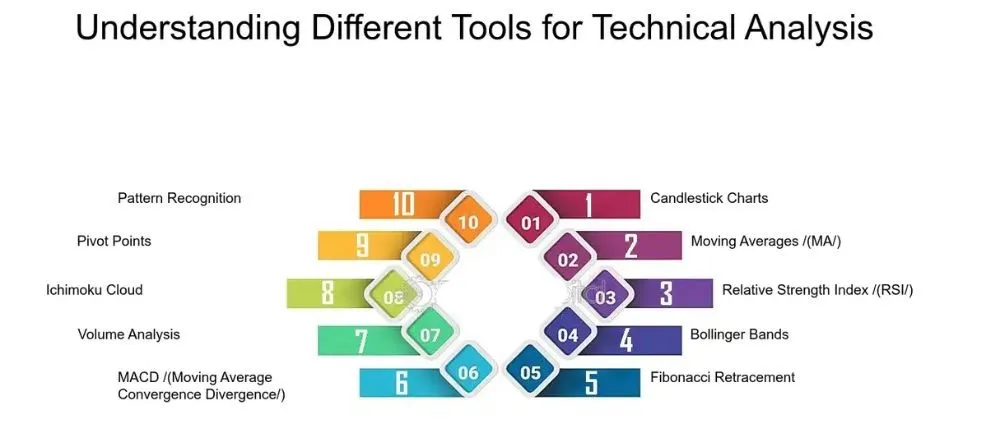
- Candlestick Charts: These are the most popular type of chart in forex trading. Each “candlestick” represents a specific time period (like one hour or one day) and displays the open, high, low, and close prices for that period. The shape and color of the candlestick provide valuable information about the battle between buyers and sellers, and specific patterns can signal potential reversals or continuations of a trend.
- Support and Resistance Levels: These are one of the most basic yet effective technical tools. A support level is a price point where a downtrend can be expected to pause due to a concentration of demand or buying interest. Think of it as a price floor. A resistance level is a price point where an uptrend can be expected to pause due to a concentration of supply or selling interest, acting as a price ceiling. Identifying these levels helps traders decide where to place entries, stop-losses, and profit targets.
- Trend Lines: A trend line is a simple line drawn on a chart that connects a series of highs or lows to visualize a trend. In an uptrend, a line is drawn connecting higher lows, while in a downtrend, a line connects lower highs. Trend lines help confirm the direction of a trend and can provide a signal when a trend might be breaking.
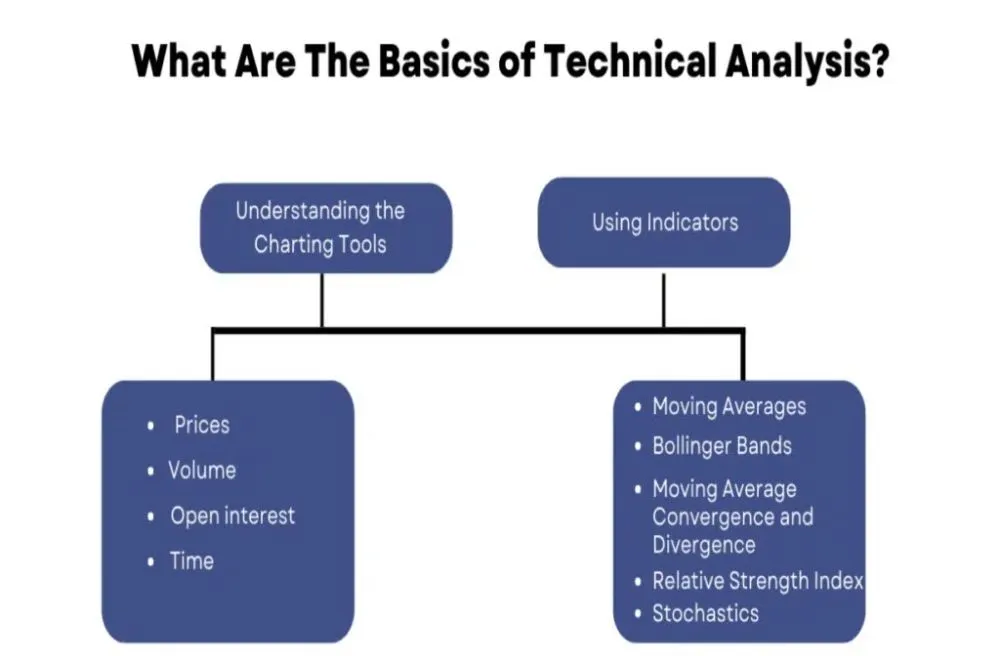
- Moving Averages (MA): A moving average smooths out price data to create a single, flowing line, making it easier to identify the overall trend direction. For example, a 200-period moving average shows the average price over the last 200 periods. When the current price is above the moving average, it generally indicates an uptrend, and when it’s below, it suggests a downtrend. Traders also watch for crossovers, where a shorter-term MA crosses above or below a longer-term MA, as a potential trading signal.
- Technical Indicators: These are calculations based on a currency’s price or volume, and their results are plotted as lines or graphs on a chart. Two of the most common are the Relative Strength Index (RSI), which measures the speed and change of price movements to identify “overbought” or “oversold” conditions, and the Moving Average Convergence Divergence (MACD), which is used to identify changes in momentum, direction, and strength of a trend.
What is Fundamental Analysis in Forex Trading?
Fundamental analysis is a method of evaluating a currency by attempting to measure its intrinsic value through the examination of related economic, social, and political forces. Unlike technical analysis, which focuses on charts, fundamental analysis delves into the underlying factors that influence a country’s economic health and, by extension, the demand for its currency. The primary goal is to determine if a currency is currently “overvalued” or “undervalued” relative to its economic reality. The core belief is that in the long run, a currency’s market price will move towards its true, or fair, value.
To understand this better, let’s look at the core principles that guide a fundamental analyst and the key economic data they rely on. A fundamental trader essentially acts like an economic detective, piecing together clues from various reports and news events to build a case for whether a currency is likely to strengthen or weaken over time. This approach requires a big-picture perspective and a solid grasp of how global economies interact.
What are the Core Principles of Fundamental Analysis?
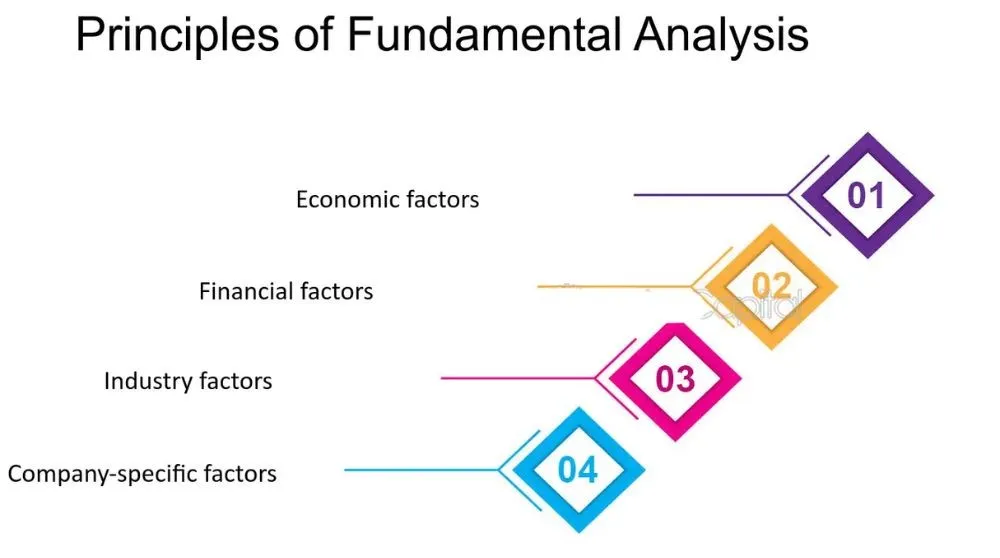
Fundamental analysis is built on the logical premise that a currency’s value is directly tied to the strength and stability of its corresponding nation’s economy. The main objective is to analyze macroeconomic indicators, government policies, and geopolitical events to arrive at a quantitative and qualitative assessment of a currency’s fair value.
The central assumption is that markets can misprice currencies in the short term. Market sentiment, speculation, and irrational behavior can cause a currency’s price to deviate significantly from its fundamentally justified value. However, a fundamental analyst believes that these deviations are temporary. Over the long term, the market will eventually “correct” itself, and the currency’s price will revert to its intrinsic value.
This leads to the primary trading strategy for a fundamental analyst. If their analysis suggests that the Australian dollar (AUD) is undervalued because Australia’s economy is showing strong growth and rising interest rates, they will look to buy AUD. They are betting that other market participants will eventually recognize this economic strength and bid up the price of the currency. Conversely, if they determine that the Japanese yen (JPY) is overvalued due to a stagnant economy and negative interest rates, they will look to sell JPY, anticipating a future decline in its value as the market adjusts to the poor economic fundamentals.
What are the Key Economic Indicators for Fundamental Analysis?
Fundamental analysts monitor a wide range of economic data to gauge the health of an economy. Certain high-impact reports have the power to cause immediate and significant volatility in the forex market.

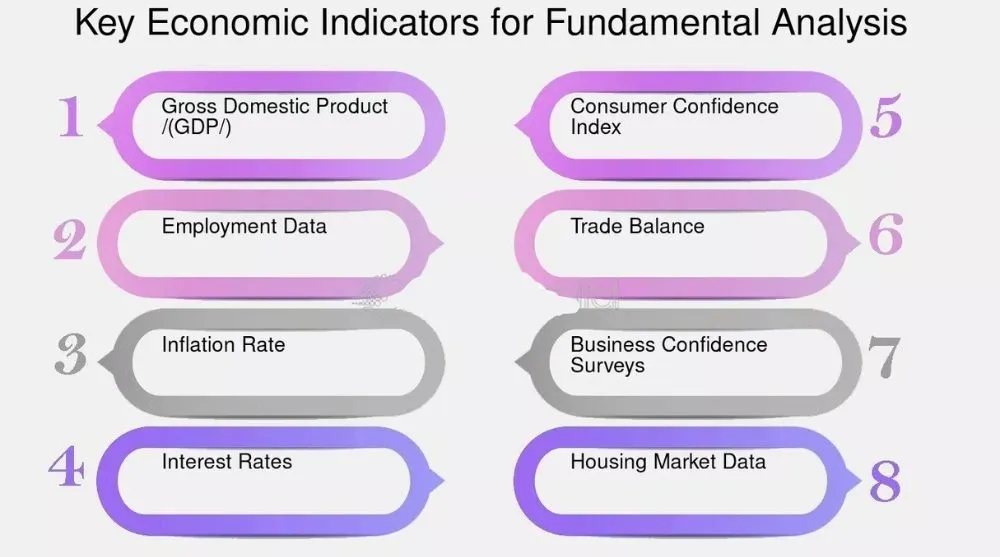
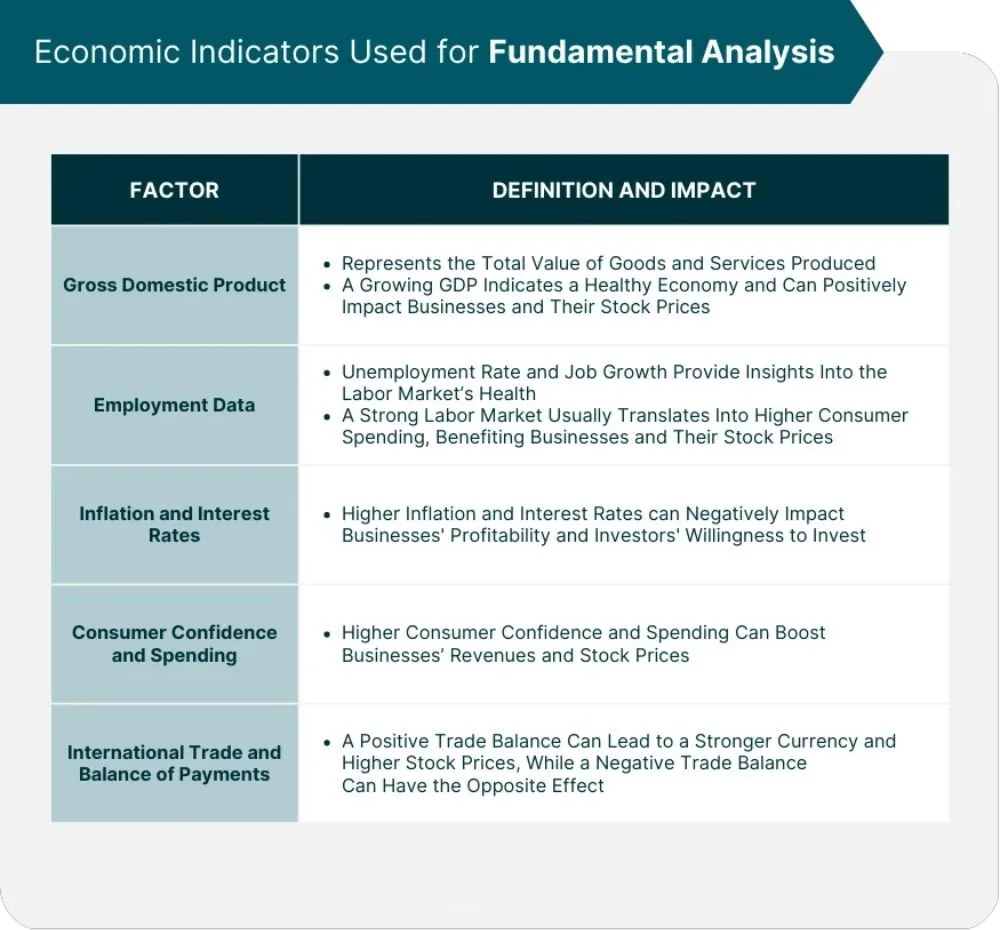
- Central Bank Interest Rates: This is arguably the single most important driver of currency values. Central banks, like the U.S. Federal Reserve or the European Central Bank, set their nation’s benchmark interest rate. Higher interest rates offer lenders in an economy a higher return relative to other countries. Therefore, higher rates attract foreign capital, which increases demand for and the value of the home currency. Statements and press conferences from central bank governors are watched very closely for clues about future rate changes.
- Gross Domestic Product (GDP): GDP is the broadest measure of a country’s economic activity. It represents the total monetary value of all goods and services produced over a specific time period. A high GDP growth rate indicates a strong, expanding economy, which is bullish for its currency. A slowing or negative GDP growth rate signals economic trouble and is typically bearish for the currency.
- Inflation Rates (CPI): Inflation is the rate at which the general level of prices for goods and services is rising, and subsequently, purchasing power is falling. The most widely watched inflation measure is the Consumer Price Index (CPI). While very high inflation can be damaging, a moderate and stable level is often seen as healthy. Central banks often raise interest rates to combat rising inflation, which, as noted above, can strengthen a currency.
- Employment Figures: The health of the labor market is a critical indicator of economic health. Reports like the monthly Non-Farm Payrolls (NFP) in the United States are extremely influential. Strong employment numbers mean more people are working, spending money, and contributing to economic growth, which is positive for the currency. High unemployment, on the other hand, signals economic weakness.
- Retail Sales: This report measures the total receipts of retail stores, providing a timely insight into consumer spending patterns. Since consumer spending is a major component of GDP in most developed economies, strong retail sales figures suggest a healthy and confident consumer base, which supports economic growth and the national currency.
How Does Technical Analysis Compare to Fundamental Analysis?
Technical analysis focuses on chart patterns and market statistics to predict when to trade, whereas fundamental analysis evaluates economic data to determine what to trade. This core distinction means they operate on different data sets, time horizons, and objectives. Technical analysis is an internal study of the market itself, while fundamental analysis is an external study of the forces that drive the market. One is not inherently better than the other; they are simply two different lenses through which to view market behavior.
Here’s a direct, side-by-side comparison to highlight the key differences between these two distinct methodologies.
| Feature | Technical Analysis | Fundamental Analysis |
|---|---|---|
| Data Source | Price charts, volume, indicators | Economic reports, news, geopolitical events |
| Main Focus | “How” price is moving and “When” to act | “Why” price is moving |
| Time Horizon | Short to medium-term | Medium to long-term |
| Objective | Identify trends, patterns, and timing | Determine intrinsic or fair value |
| Tools | Indicators (RSI, MACD), trend lines, chart patterns | Economic indicators (GDP, CPI, interest rates) |
What is the Main Difference in Focus and Data?
The most significant difference between the two approaches is where they look for information. Technical analysis is internally focused, using only data generated by the market itself, namely price and volume. A technician believes that the price chart contains all the information needed to make a trading decision. The “what” and “why” behind a price move are considered irrelevant. The only things that matter are the patterns and trends visible on the screen. The data is quantitative, specific, and readily available on any trading platform.
In contrast, fundamental analysis is externally focused, looking at macroeconomic data, geopolitical events, and central bank policies to understand the forces of supply and demand. A fundamental analyst pores over economic reports from government agencies, listens to speeches from central bankers, and reads financial news to form an opinion on a country’s economic health. Their data sources are vast and varied, including both quantitative figures like GDP and qualitative factors like political stability. They are trying to understand the story behind the price.
What is the Main Difference in Time Horizon?
The typical time horizon for each analysis style also differs greatly. Technical analysis is most commonly applied to short-to-medium-term trading. Day traders, who hold positions for minutes or hours, and swing traders, who hold positions for days or weeks, rely heavily on technical analysis. This is because chart patterns and indicator signals can develop and play out over very short timeframes, providing frequent opportunities for entry and exit. A technical setup might form on a 15-minute chart and be completely resolved within a few hours.
On the other hand, fundamental analysis is best suited for identifying long-term trends and is typically used by position traders and long-term investors. The economic factors it studies, such as interest rate cycles or shifts in trade policy, unfold over months, quarters, or even years. It takes time for the effects of a central bank’s policy change to filter through an economy and be reflected in the currency’s value. A fundamental trader might hold a position for many months, waiting for their long-term economic thesis to materialize.
What is the Main Difference in Objective?
Finally, the two methods have fundamentally different goals. The primary objective of technical analysis is to identify when to trade by pinpointing optimal entry and exit points. It is a discipline focused on timing. A technical trader uses support and resistance levels to decide where to place a buy order, a stop-loss order, and a take-profit order. They might see a bullish chart pattern forming and decide that now is a good time to enter a long trade, regardless of the underlying economic news.
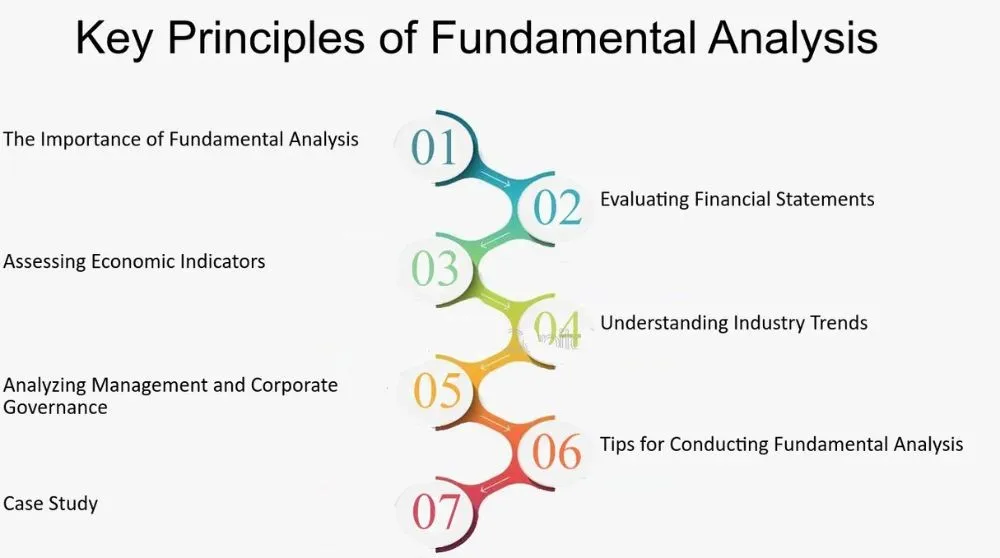
The objective of fundamental analysis is to identify what to trade by determining if a currency is overvalued or undervalued. It is a discipline focused on value. A fundamental analyst might conclude that, based on strong economic growth and hawkish central bank rhetoric, the Canadian dollar is fundamentally strong and likely to appreciate over the next year. This analysis tells them which currency to buy, but it doesn’t provide a precise entry point. They are identifying a long-term directional bias, not an immediate trade setup.
What are the Strengths and Weaknesses of Each Method?
Technical analysis excels at providing clear, actionable signals for trade entry and exit but can be subjective, while fundamental analysis is great for understanding market drivers but can be slow to reflect in price. Both methodologies have distinct advantages and disadvantages that make them more or less suitable for different trading styles and market conditions. Acknowledging these pros and cons is key to knowing how and when to apply each approach effectively.
Let’s break down the specific strengths and weaknesses of each discipline. This balanced view will help you understand the practical limitations and benefits you might encounter when using them in your own trading.
What are the Pros and Cons of Technical Analysis?
Technical analysis is widely popular, especially among retail forex traders, for several compelling reasons, but it also comes with notable drawbacks.
Pros of Technical Analysis:
- Provides Clear Entry and Exit Points: One of the biggest strengths of TA is its ability to generate specific price levels for entering a trade, placing a stop-loss, and taking profit. Tools like Fibonacci retracements, support and resistance, and chart patterns offer clear, objective signals.
- Widely Accessible and Easy to Learn: Most trading platforms come equipped with a full suite of charting tools and indicators for free. There is a vast amount of educational material available online, making the basics of TA relatively easy to grasp for new traders.
- Applicable to Any Market and Timeframe: The principles of technical analysis can be applied to any financial market, whether it’s forex, stocks, or commodities. It is also versatile enough to be used on any timeframe, from a one-minute chart for a scalper to a weekly chart for a position trader.
- Focuses on “What” is Happening, Not “Why”: By focusing solely on price, technical analysis simplifies the trading process. A trader doesn’t need to be an expert in economics or geopolitics to identify a trend or a pattern, which can reduce analysis paralysis.
Cons of Technical Analysis:
- Can be Subjective: Despite its reliance on data, chart interpretation can be highly subjective. Two traders can look at the exact same chart and draw different conclusions, identifying different patterns or placing trend lines in different places.
- Reliance on Lagging Indicators: Many popular technical indicators, such as moving averages, are “lagging” because they are based on past price data. This means they are always a step behind the market, which can lead to late entries or exits.
- Prone to False Signals: In non-trending, or “ranging,” markets, many technical tools can generate repeated false signals. For example, trend-following systems will perform poorly when there is no clear trend to follow, leading to a series of small losses.
- Self-Fulfilling Prophecy: Because so many traders use the same tools and look for the same patterns (like a 200-day moving average), their collective actions can cause the expected price move to happen, rather than the tool having any true predictive power on its own.
What are the Pros and Cons of Fundamental Analysis?
Fundamental analysis provides the context for market movements and is favored by long-term investors and institutions, but it has its own set of challenges.
Pros of Fundamental Analysis:
- Explains the “Why” Behind Market Moves: FA helps traders understand the underlying reasons for a currency’s long-term trend. This can provide a strong sense of conviction when holding a position through short-term volatility.
- Identifies Long-Term Opportunities: By focusing on economic health and monetary policy cycles, FA is excellent for identifying major, multi-year trends and investment opportunities. It helps answer the big-picture question of which economies are strengthening and which are weakening.
- Can Predict Major Trend Changes: A significant change in a country’s economic outlook or a surprise shift in central bank policy can signal a major, long-lasting reversal in a currency’s trend. Fundamental analysts are often the first to spot these large-scale shifts.
- Based on Concrete Data: While interpretation is still required, the analysis is rooted in tangible economic data rather than chart patterns. This can make it feel more grounded and less arbitrary for some traders.
Cons of Fundamental Analysis:
- Complex and Time-Consuming: To perform proper fundamental analysis, a trader needs a solid understanding of macroeconomics and must constantly stay on top of a flood of news and data releases from around the world.
- Market Can Remain Irrational: A famous saying in trading is, “The market can remain irrational longer than you can remain solvent.” A currency can continue to trade against its fundamental value for a very long time, leading to losses for a fundamental trader waiting for the market to “correct.”
- Does Not Provide Precise Timing: The biggest weakness of FA is its inability to provide specific entry and exit points. Knowing that the U.S. dollar is fundamentally strong doesn’t tell you the best price at which to buy it today.
- Ambiguity of Data: Economic data can be ambiguous or even contradictory. A strong GDP report might be accompanied by a weak employment report, making it difficult to draw a clear conclusion about the currency’s direction.
Is Technical or Fundamental Analysis Better for Forex Traders?
Neither technical nor fundamental analysis is inherently better for forex traders; the most effective strategy often involves a thoughtful combination of both approaches. The optimal choice is not about picking one and discarding the other, but about understanding which method aligns best with your trading style, time horizon, and personal strengths. Many of the most successful forex traders learn to use fundamental analysis to establish a directional bias and technical analysis to time their entries and exits with precision.
The best choice ultimately depends on your individual trading plan and the amount of time you can dedicate to the markets. Let’s look at how different types of traders might approach this.
For short-term traders, such as scalpers and day traders who hold positions for minutes or hours, technical analysis is the dominant methodology. Their decision-making window is far too short to wait for the effects of economic data to play out. They rely on immediate price action, chart patterns, and fast-moving indicators to make quick decisions. For them, a fundamental report like GDP is just a source of volatility to be managed, not a basis for a trade. In this context, technical analysis is clearly the more practical and useful tool.
For long-term traders, often called position traders who hold trades for weeks, months, or even years, fundamental analysis forms the foundation of their strategy. They are making bets on long-term economic cycles and shifts in central bank monetary policy. They use fundamental data to determine that a country’s economy is poised for strong growth and will buy its currency with the intention of holding it for a long period. They might use a simple technical tool, like a monthly moving average, to confirm that the long-term trend is in their favor, but their primary decision is based on fundamentals.
The sweet spot for most retail traders, especially swing traders who hold positions for several days to several weeks, is a hybrid approach. This is where the synergy between the two disciplines truly shines. A swing trader might use fundamental analysis to identify a strong mismatch between two economies. For example, they might notice that the Bank of England is signaling interest rate hikes while the Bank of Japan is committed to keeping rates at zero. This gives them a strong fundamental reason to be bullish on the GBP/JPY pair. Having established this directional bias, they will then switch to a daily or 4-hour technical chart. They will use tools like trend lines, support levels, or candlestick patterns to find a low-risk, high-probability entry point to buy GBP/JPY. This powerful combination allows them to trade with the long-term fundamental trend while using technical precision to optimize their timing and risk management.
What are Other Key Concepts in Forex Market Analysis?
Beyond technical and fundamental analysis, other key concepts include combining strategies, adapting analysis to trading styles, gauging market sentiment, and understanding the role of algorithms and psychological biases. Furthermore, a sophisticated trader recognizes that no single method works in isolation and that a broader understanding of the market provides a distinct advantage. These advanced concepts move beyond the simple “which is better” debate and into the practical application of different analytical tools in various market conditions. By integrating these ideas, traders can develop a more nuanced and resilient approach to navigating the foreign exchange market, accounting for factors that pure technical or fundamental analysis might overlook.
Can You Combine Technical and Fundamental Analysis?
A hybrid approach, where a trader combines technical and fundamental analysis, is not only possible but also highly popular among successful long-term traders. This method uses fundamental analysis to establish a long-term directional bias and technical analysis to identify precise entry and exit points. For example, a trader might conduct fundamental analysis on the US dollar and the Japanese yen. They may conclude that due to the Federal Reserve raising interest rates while the Bank of Japan maintains a loose monetary policy, the USD is likely to strengthen against the JPY over the next several months. This forms their fundamental, long-term bullish view on the USD/JPY pair.
Instead of buying immediately, the trader then turns to technical analysis to optimize their timing.
- They wait for a price pullback to a key support level, like the 50-day moving average.
- They might look for a bullish confirmation signal, such as a hammer candlestick pattern or a bullish MACD crossover on the daily chart.
- Once the technical signal aligns with their fundamental view, they enter the long trade, placing a stop-loss based on technical structures.
Which Analysis is Best for Day Trading versus Position Trading?
The suitability of technical versus fundamental analysis often depends on a trader’s time horizon. For short-term strategies like day trading and scalping, technical analysis is the dominant methodology. Day traders, who hold positions for minutes or hours, are primarily concerned with immediate price volatility and liquidity. They use charts, patterns, and indicators like the Relative Strength Index (RSI) or Bollinger Bands to make quick decisions. Fundamental data, such as an unemployment report, is only relevant to them as a catalyst for volatility, not for its long-term economic implication. The underlying economic health of a country rarely changes enough to affect an intraday trade.
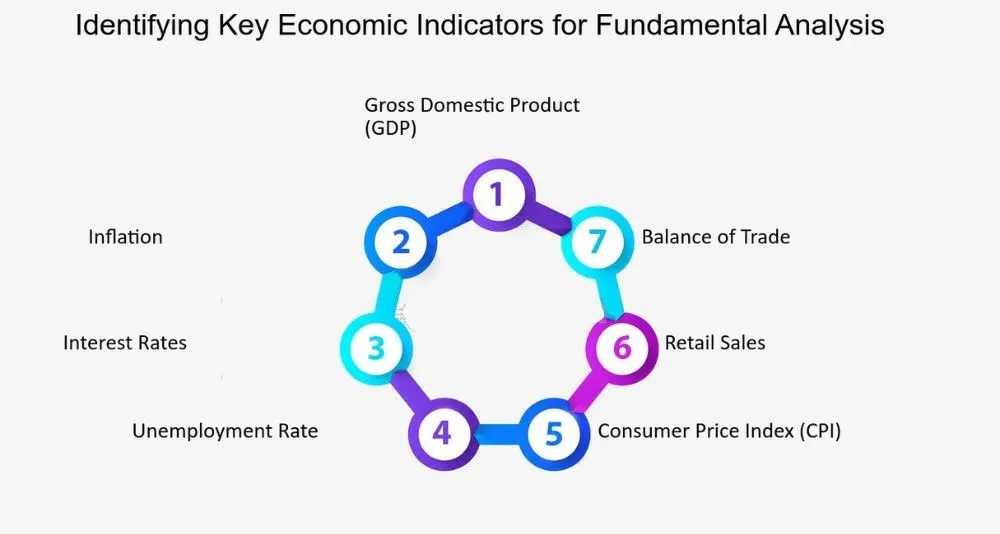
In contrast, long-term position traders lean heavily on fundamental analysis.
- These traders hold positions for weeks, months, or even years, so their success depends on correctly forecasting major economic trends.
- They analyze factors like GDP growth, inflation rates, central bank policies, and political stability to determine a currency’s intrinsic value.
- Technical analysis is still used, but in a secondary capacity to identify strategic entry levels for a position they intend to hold based on their fundamental outlook.
What is Sentiment Analysis in Forex?
Sentiment analysis is a third major pillar of market analysis that focuses on gauging the overall mood and positioning of market participants. It aims to determine whether the market is predominantly bullish (expecting prices to rise) or bearish (expecting prices to fall) on a particular currency pair. Unlike technical analysis that studies price charts or fundamental analysis that studies economic data, sentiment analysis examines the “crowd psychology” of the market. If an overwhelming majority of traders are long on a currency pair, it can sometimes be a contrarian signal, suggesting the market is overbought and a reversal may be near.
One of the most powerful tools for sentiment analysis is the Commitment of Traders (COT) report.
- Published weekly by the Commodity Futures Trading Commission (CFTC), this report details the positions held by different types of traders.
- It breaks down the market into commercial hedgers, large speculators (like hedge funds), and non-reportable retail traders.
- By tracking the positioning of “smart money” (large speculators), traders can gain insight into where institutional capital is flowing, providing a valuable layer of context to their own analysis.
How Do Algorithmic Trading Systems Use These Analyses?
Algorithmic trading systems, including high-frequency trading (HFT) platforms, integrate both technical and fundamental analysis to execute trades at speeds impossible for a human. These automated systems use pre-programmed instructions to enter and exit trades based on a variety of inputs. A simple algorithm might be programmed to buy a currency pair when its 20-period moving average crosses above its 50-period moving average, a purely technical rule. However, more advanced systems use a combination of methods to gain an edge and manage risk more effectively.

These sophisticated algorithms demonstrate a powerful fusion of analytical techniques.
- Technical Inputs: Algorithms constantly monitor price action, volume, order book depth, and hundreds of technical indicators across multiple timeframes.
- Fundamental Inputs: Modern systems can also incorporate fundamental data through low-latency news feeds. An algorithm can be designed to parse news releases from sources like Reuters or Bloomberg for keywords related to interest rate decisions or inflation data, executing a trade within milliseconds of a report’s release.
- This combination allows the system to react instantly to both chart-based signals and market-moving economic news, showcasing how both analytical schools are indispensable in modern finance.
Are There Any Psychological Biases That Affect Analysts?
Yes, both technical and fundamental analysts are susceptible to a range of psychological or cognitive biases that can cloud their judgment and lead to poor decision-making. This field of study, known as behavioral finance, highlights the human element in financial markets. Even with the most robust analytical framework, emotions and mental shortcuts can distort perception and lead to irrational choices. Recognizing these biases is the first step toward mitigating their impact on trading performance and maintaining objectivity in market analysis.
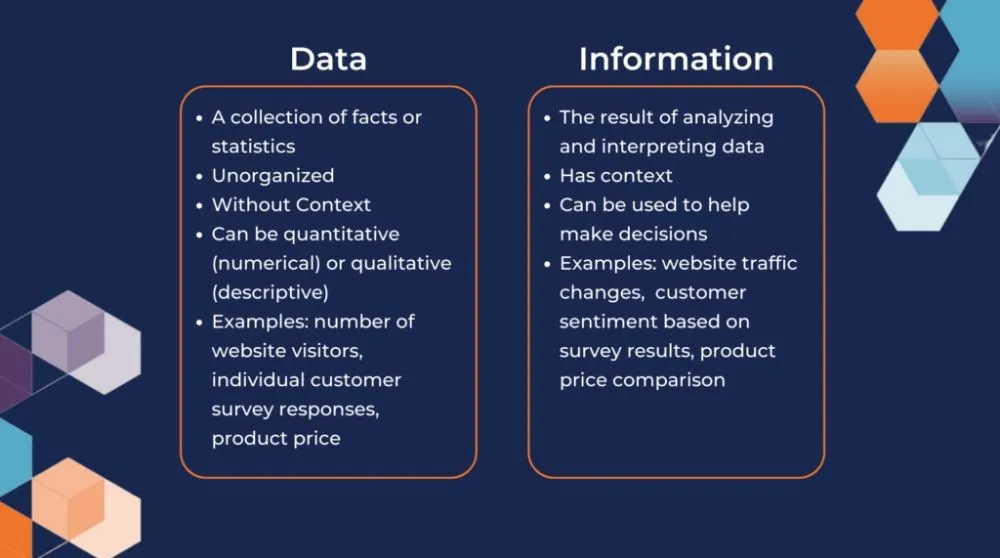
Several common biases can affect analysts and traders alike.
- Confirmation Bias: This is the tendency to seek out and interpret information that confirms one’s pre-existing beliefs. A fundamental analyst who is bullish on the euro might overemphasize positive economic news from the Eurozone while dismissing negative data.
- Herd Mentality: This bias causes individuals to follow the actions of a larger group, regardless of their own analysis. An analyst might hesitate to issue a sell recommendation on a popular currency pair for fear of going against the prevailing market consensus.
- Recency Bias: This involves giving greater importance to recent events than to historical ones. A trader might abandon a well-researched, long-term fundamental view after a few losing trades caused by short-term market noise.