

Blog
How to Combine Trading Indicators for More Accurate Forex Signals

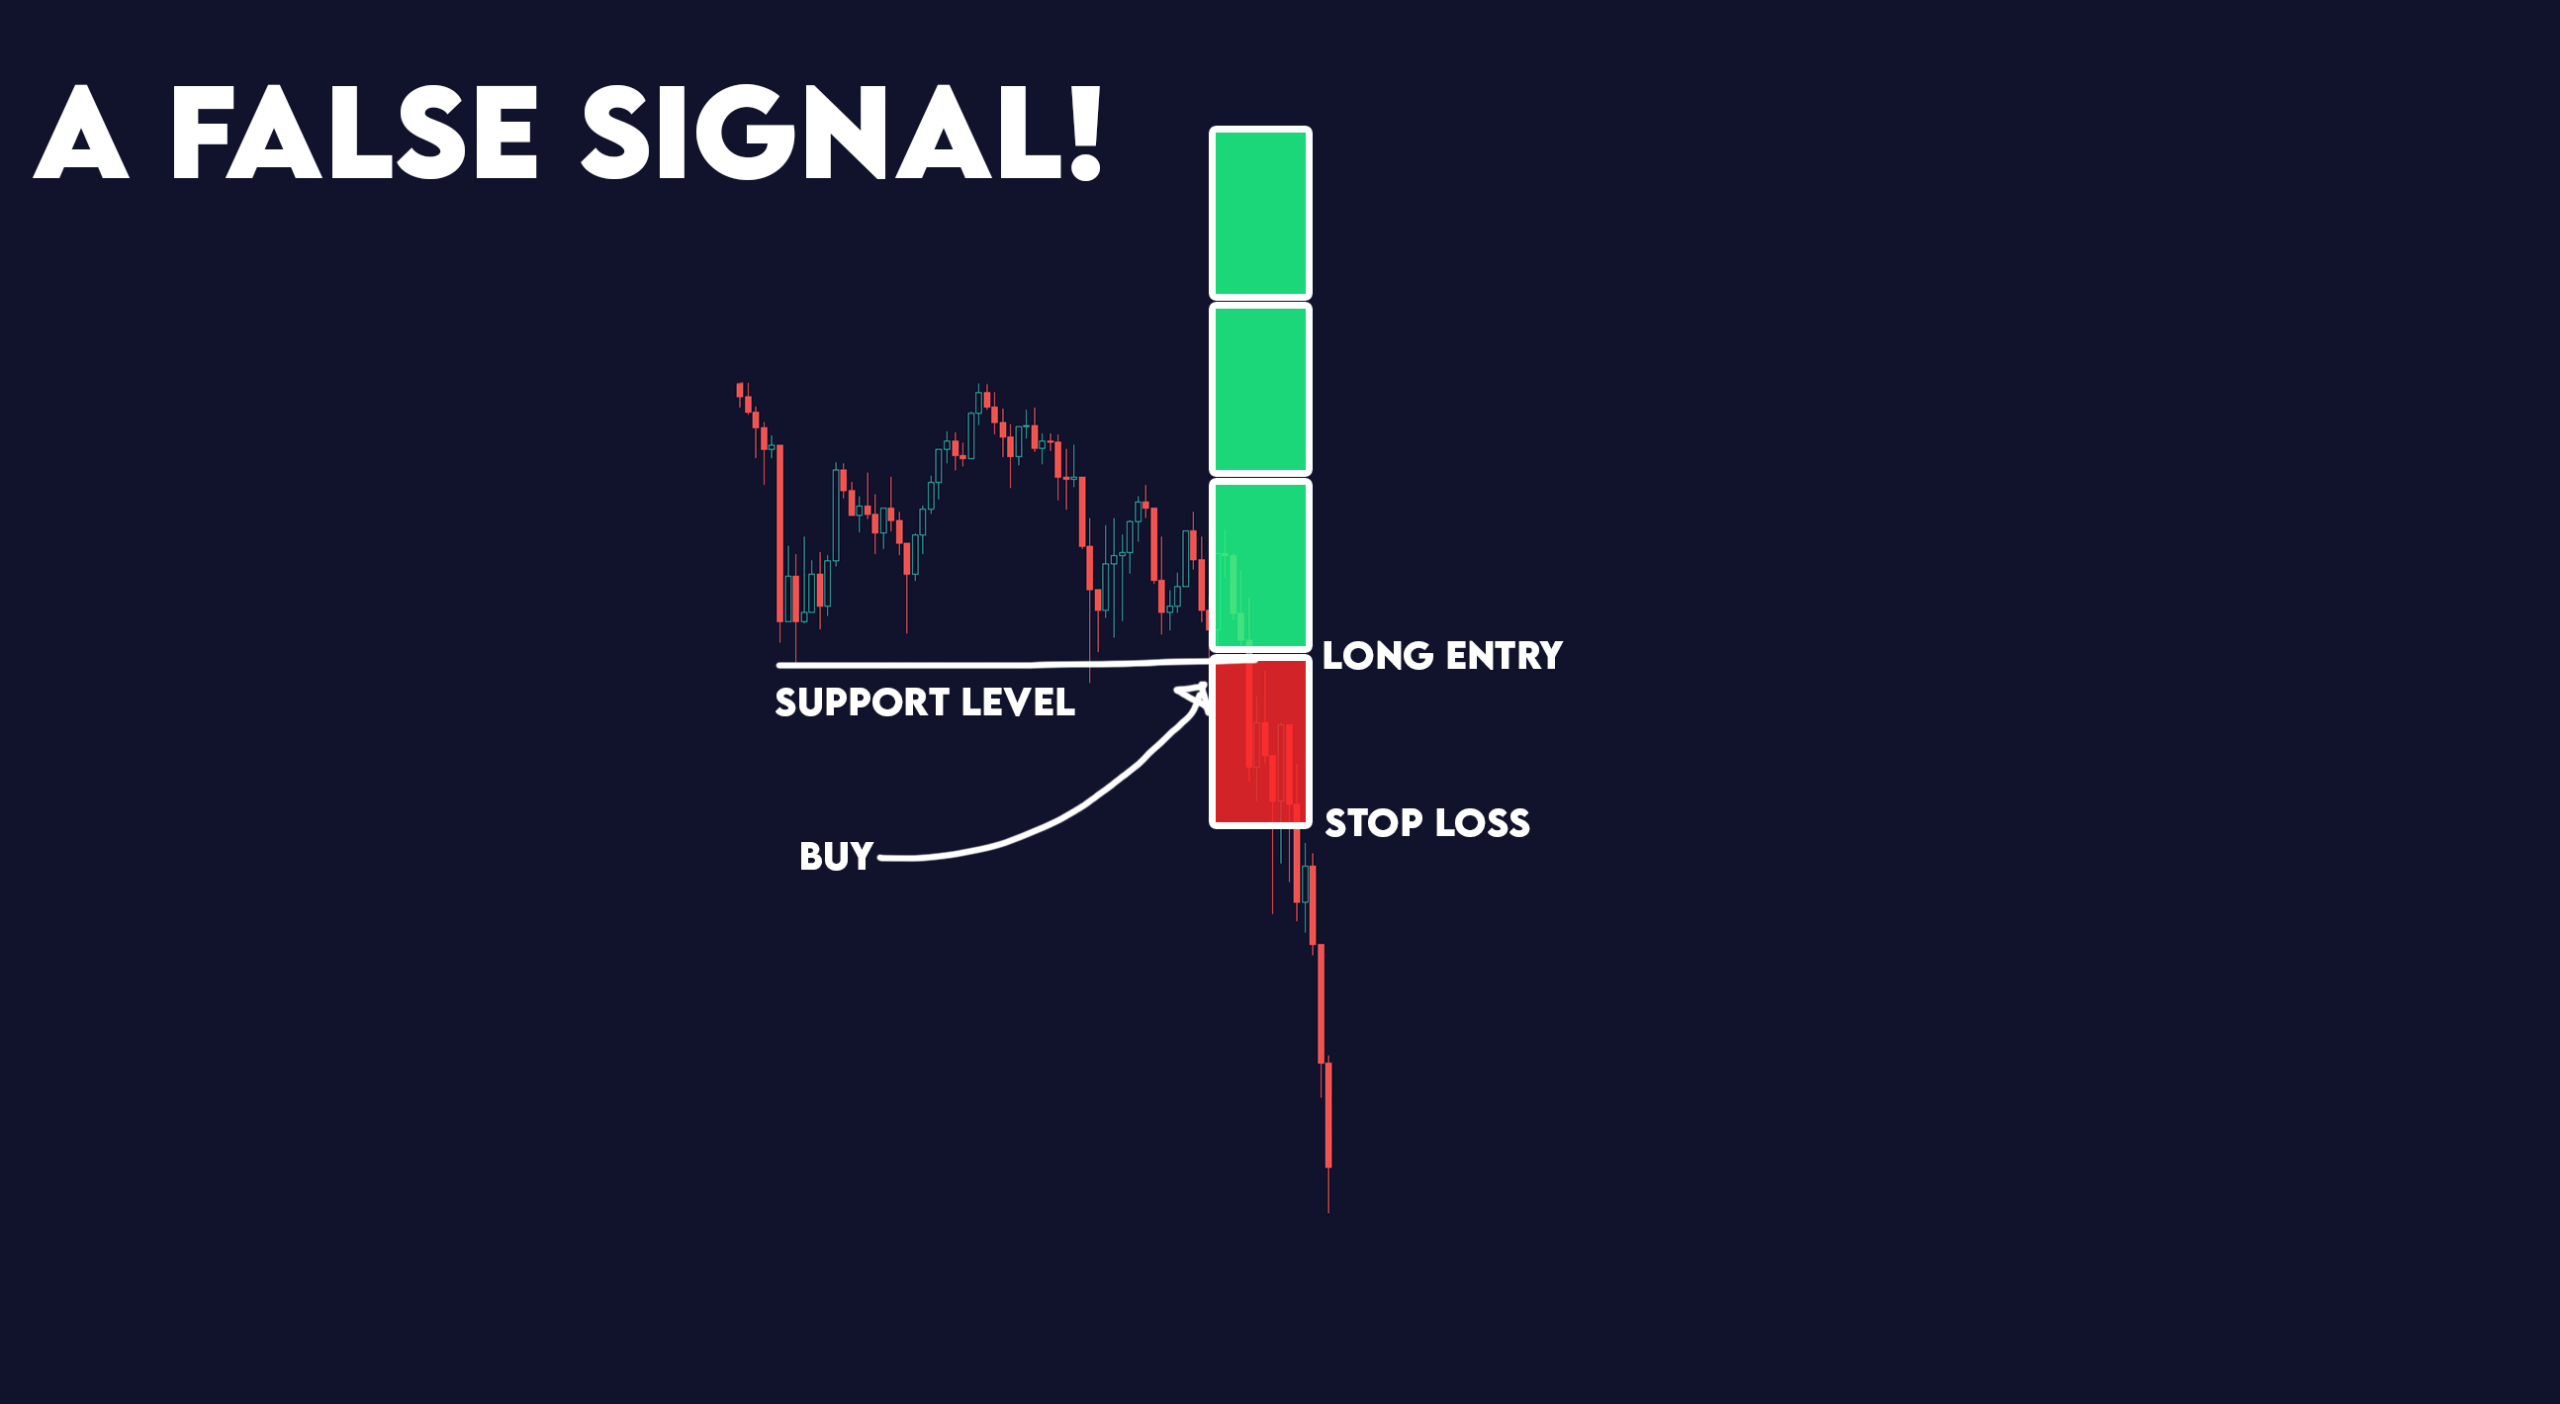
Combining trading indicators for more accurate forex signals involves a systematic, multi-layered approach to confirm price action rather than relying on a single tool. The most effective method is to layer three non-correlated indicators from different categories: one to identify the primary trend, a second to measure momentum for timing entries, and a third to gauge volatility for setting exits. For instance, a trader might use a 200-period moving average to confirm an uptrend, wait for the Relative Strength Index (RSI) to show an oversold condition on a pullback for an entry, and then use the Average True Range (ATR) to place a logical stop-loss. This process creates a robust system of checks and balances.
This strategy is necessary because it filters out false signals and provides a more holistic view of market behavior. Relying on a single indicator is like trying to understand a story by reading only one page; you get a piece of the information but miss the full context. A trend indicator might suggest a buy, but a momentum indicator could reveal the trend is weak and likely to reverse. By combining them, you get confirmation from different perspectives, which increases the probability of a successful trade.
To build an effective combination, it is best to select indicators from three distinct categories that measure different market dynamics. The main types of trading indicators to combine are trend-following indicators like Moving Averages, momentum indicators like the RSI or Stochastic Oscillator, and volatility indicators like Bollinger Bands or the ATR. Each category serves a unique purpose. Trend indicators show direction, momentum indicators measure the speed and strength of price moves, and volatility indicators measure the degree of price fluctuation, helping with risk management.
By understanding the purpose of each indicator type and the core principles of combining them, you can move from random signal-chasing to building a structured trading plan. This approach transforms indicators from simple buy or sell triggers into a comprehensive decision-support system. The goal is not to find a perfect combination that never fails but to create a framework that consistently puts the odds in your favor by demanding multiple sources of confirmation before risking capital.
Why is Combining Trading Indicators a Necessary Strategy?
Combining trading indicators is a necessary strategy because it reduces false signals and provides confirmation, giving you a more complete view of market conditions than a single indicator can offer. No single trading indicator is a standalone solution for predicting market movements. Each one is designed to measure a specific aspect of the market, like its trend, momentum, or volatility. Relying on just one creates a significant blind spot.
Let’s explore this further. Imagine you are using only a Moving Average Crossover strategy. When the fast-moving average crosses above the slow one, you buy. While this works well in strong trending markets, it can generate numerous false signals in a ranging or sideways market, causing you to enter and exit trades for small losses repeatedly. This is a common problem known as a “whipsaw.” By adding a second, non-correlated indicator, you introduce a filter that helps validate the signals from your primary tool, creating a much more robust system.
Does Combining Indicators Eliminate False Signals?
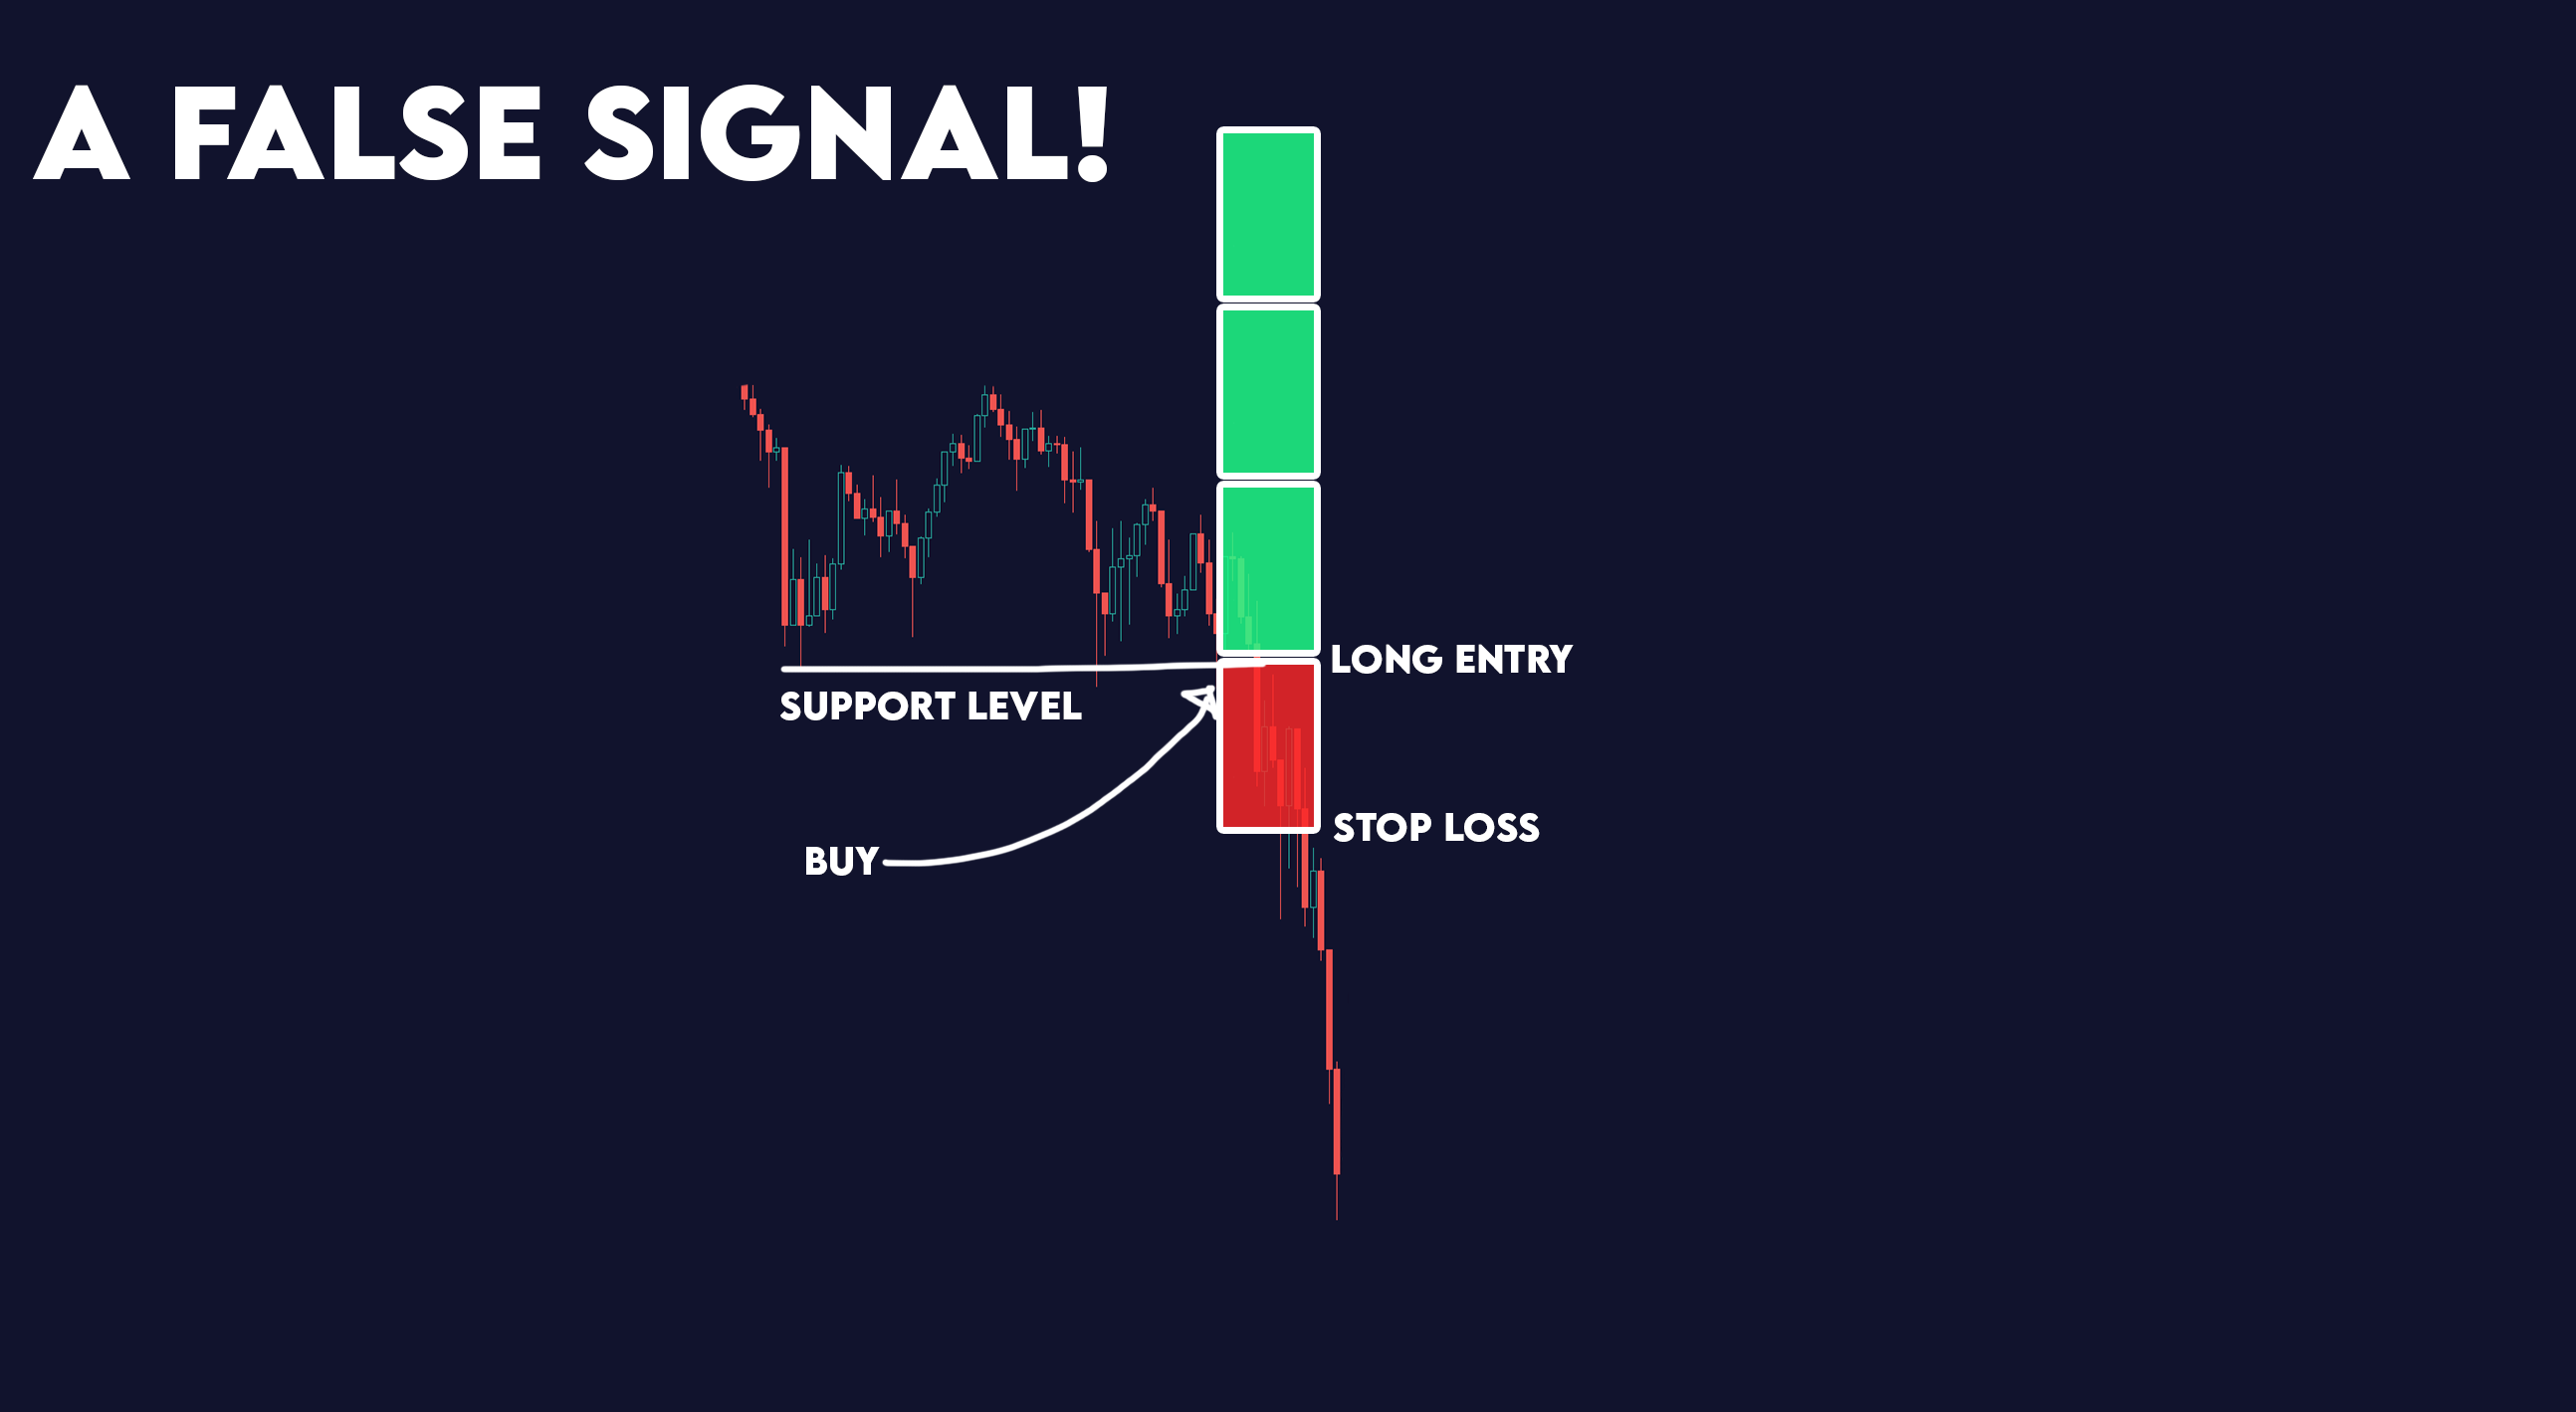
No, combining indicators does not eliminate false signals, but it does work to reduce their frequency and impact. The foreign exchange market is complex and influenced by countless factors, making it impossible for any technical system to be 100% accurate. The goal of a well-designed trading strategy is not to achieve perfection but to create a statistical edge over a large series of trades. Adding a second or third indicator acts as a powerful filter. For example, if your Moving Average Crossover gives a buy signal, you can check a momentum indicator like the Relative Strength Index (RSI). If the RSI is also showing strengthening bullish momentum (e.g., rising from an oversold level), the signal is confirmed. If the RSI is in overbought territory and showing bearish divergence, you would ignore the buy signal, successfully filtering out a potentially bad trade. This confirmation process is at the heart of why traders combine indicators. It forces you to wait for a confluence of events, where multiple, independent tools point to the same conclusion, increasing the probability of your trade being successful.
What is the Main Goal of an Indicator Combination?
The main goal of combining indicators is to achieve confirmation, filter out low-probability trades, and identify the overall market context. These three objectives work together to help you make more informed trading decisions instead of acting on isolated signals. Let’s break down each one.

- Confirmation: This is the primary objective. Confirmation means seeking agreement between two or more indicators that measure different things. For instance, you identify a bullish trend with a 200-period Exponential Moving Average (EMA). You would then look for a momentum indicator like the MACD to also show bullish signals, such as a crossover above its signal line. When both indicators agree, the trade setup is confirmed.
- Filtering: This goal is about avoiding bad trades. A filter helps you ignore signals that occur under unfavorable market conditions. An excellent example is using the Average Directional Index (ADX) indicator. If the ADX reading is below 25, it suggests the market is in a range, not a trend. In this case, you would filter out, or ignore, any signals from your trend-following system, as it is not designed to perform well in such conditions.
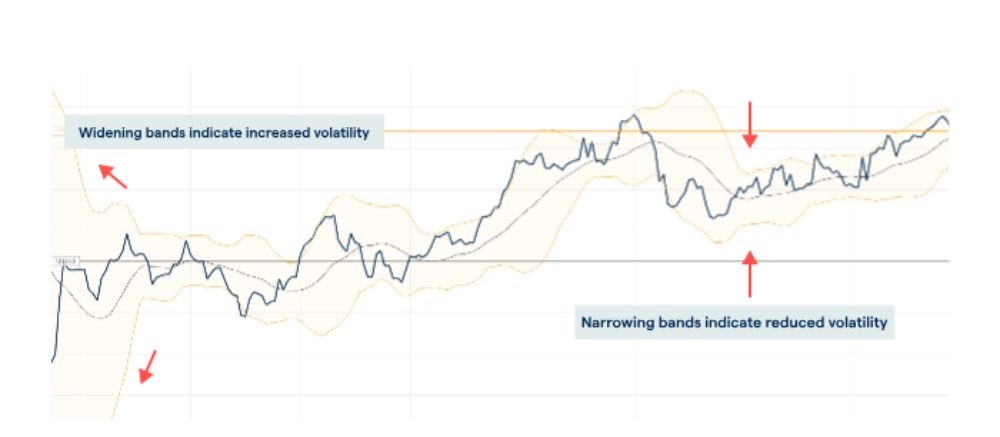
- Identifying Market Context: Different strategies work better in different market environments. Is the market trending strongly, or is it stuck in a sideways range? Combining indicators helps you answer this. Using Bollinger Bands alongside a trend indicator can provide context. If prices are “walking the band” (consistently hitting the upper or lower band) and the bands are widening, it signals a strong trend. If prices are bouncing between the upper and lower bands and the bands are contracting, it signals a ranging market. This context allows you to apply the right strategy at the right time.
What are the Main Types of Trading Indicators to Combine?
There are three main types of trading indicators to combine: trend-following, momentum, and volatility indicators, each categorized by the market information they provide. Using one from each category creates a balanced system where each tool serves a distinct purpose without providing redundant information. This approach is fundamental to building a sound indicator-based strategy.
Here’s the breakdown. Each category answers a different question about the market, and when you put the answers together, you get a much clearer picture of what is happening on the chart. A good combination might ask: “Which way is the market going?” (trend), “How strong is this move?” (momentum), and “How much risk am I taking?” (volatility). Let’s look at each type in more detail.
What are Trend-Following Indicators?
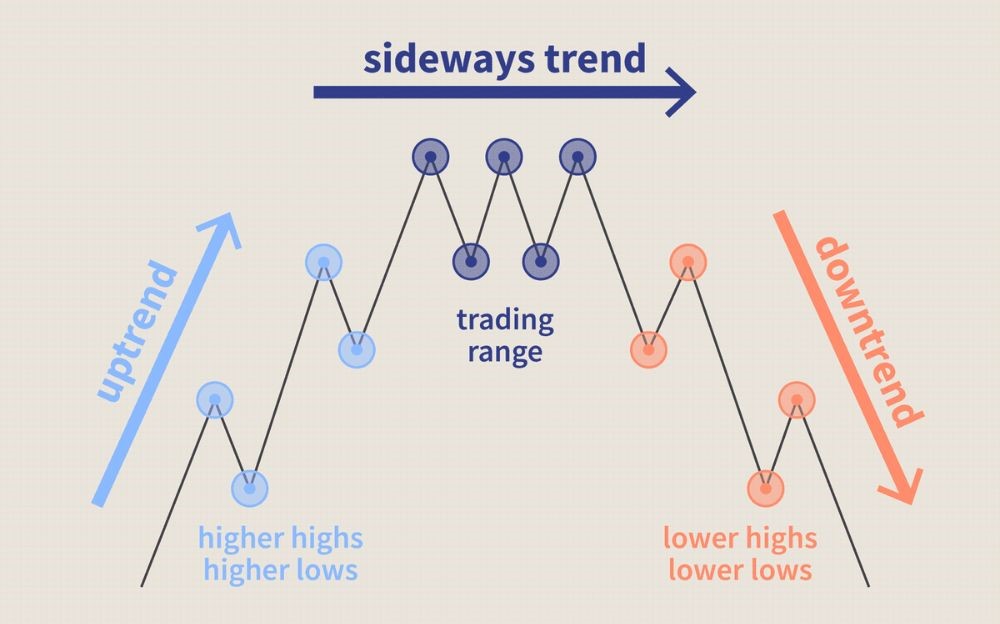
Trend-following indicators are technical tools designed to identify the direction and strength of a market trend. Their primary function is to smooth out price action to give you a clearer view of the underlying direction, helping you determine if a market is in an uptrend, a downtrend, or moving sideways. They are often referred to as lagging indicators because they are based on past price data and confirm a trend after it has already started. Examples include:
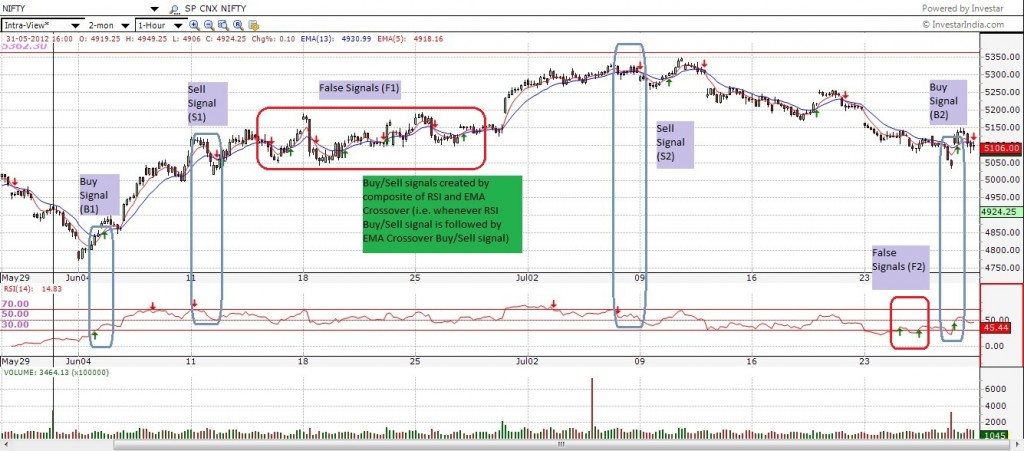
- Moving Averages (MA): This is the most popular type of trend indicator. A Simple Moving Average (SMA) calculates the average price over a specific number of periods, while an Exponential Moving Average (EMA) gives more weight to recent prices, making it more responsive. Traders often use a long-term MA, like the 200-period EMA, to define the overall trend. If the price is above the 200 EMA, the long-term trend is considered bullish. If it’s below, it’s bearish.
- Parabolic SAR (Stop and Reverse): This indicator appears as a series of dots either above or below the price candles. When the dots are below the price, it signals a bullish trend. When the dots flip to be above the price, it signals a potential trend change to bearish. It is also used to set trailing stop-losses.
What are Momentum Indicators?
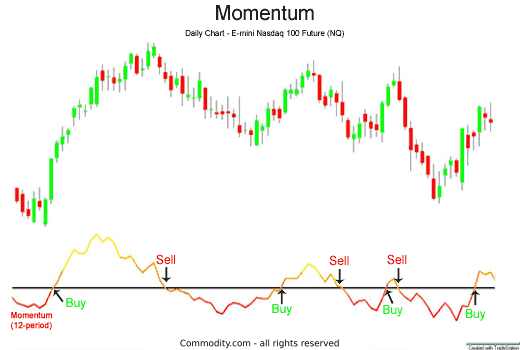
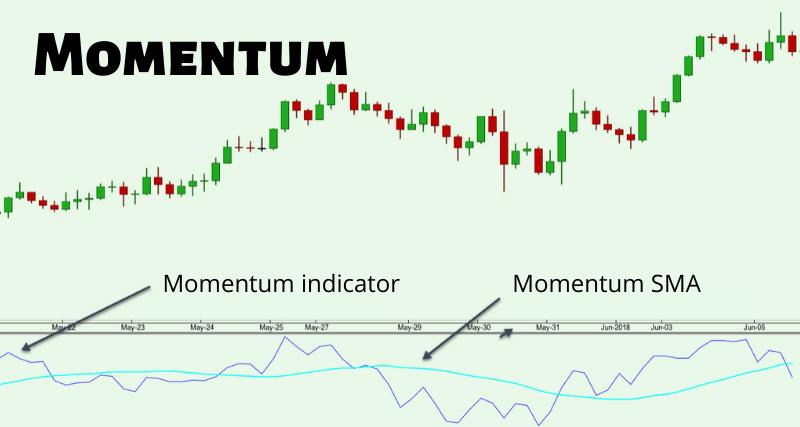
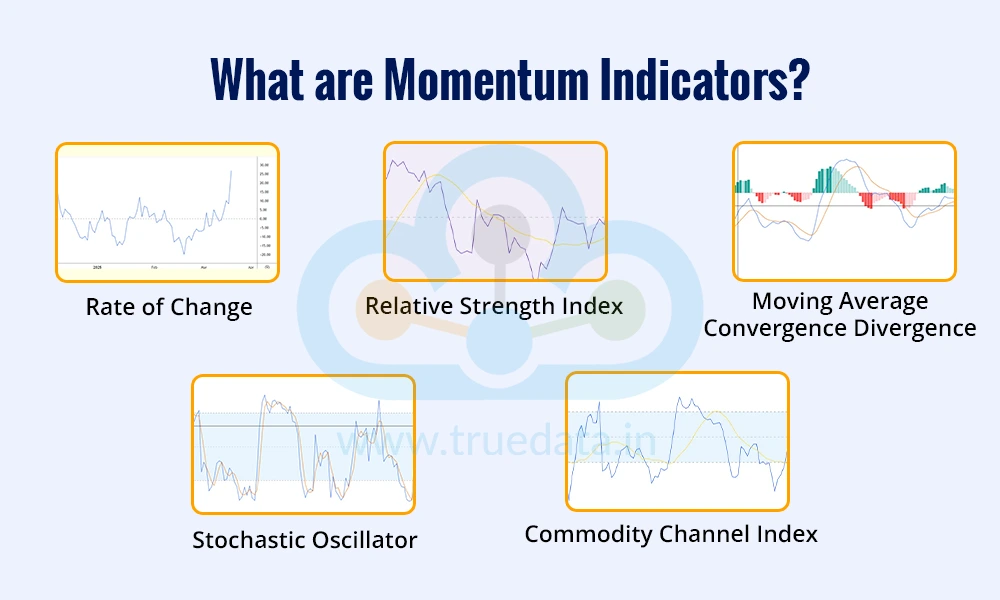
Momentum indicators, also known as oscillators, are designed to measure the speed and strength of price movements. They help identify overbought and oversold conditions and can warn of potential trend reversals when momentum begins to fade. Unlike trend indicators that lag, momentum indicators can sometimes lead price action. They typically oscillate between set upper and lower bands. Common examples include:
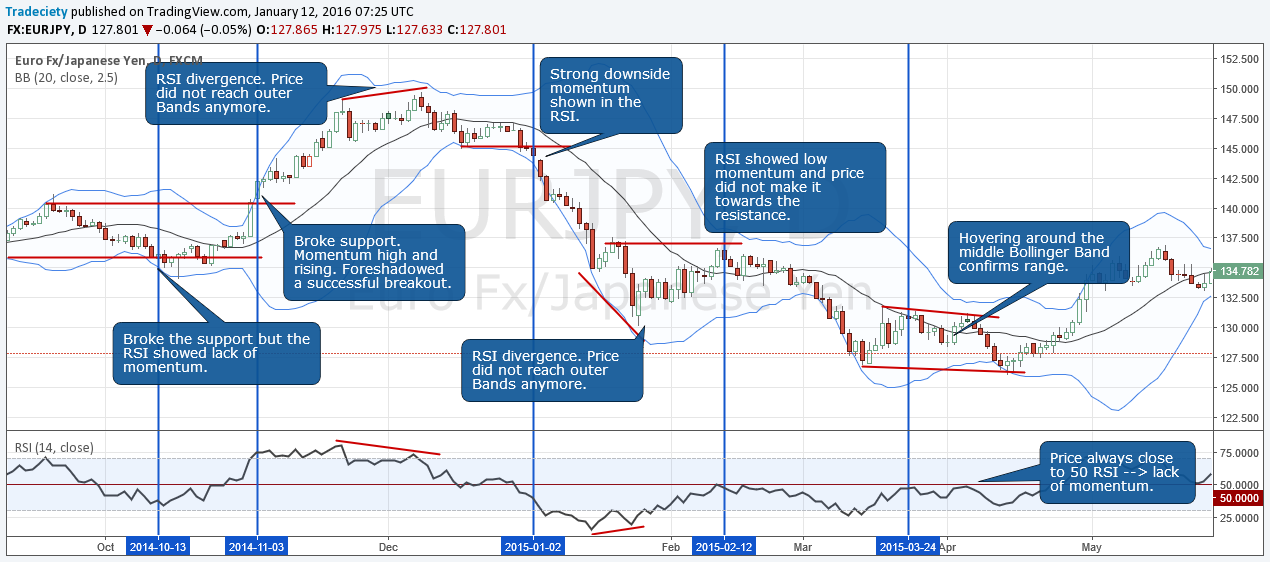
- Relative Strength Index (RSI): The RSI is an oscillator that moves between 0 and 100. It measures the speed and change of price movements. Traditionally, a reading above 70 is considered overbought (a potential sell signal), and a reading below 30 is considered oversold (a potential buy signal). Traders also look for divergence, where the price makes a new high but the RSI makes a lower high, signaling weakening momentum.
- Stochastic Oscillator: Like the RSI, the Stochastic Oscillator measures momentum but does so by comparing a closing price to its price range over a certain period. It oscillates between 0 and 100, with readings above 80 indicating overbought conditions and below 20 indicating oversold conditions.
- Moving Average Convergence Divergence (MACD): The MACD consists of two lines (the MACD line and the signal line) and a histogram. It shows the relationship between two EMAs. A buy signal occurs when the MACD line crosses above the signal line, and a sell signal occurs when it crosses below. The histogram visualizes the distance between the two lines, showing the strength of the momentum.
What are Volatility Indicators?
Volatility indicators measure the magnitude of price fluctuations or the rate at which price changes. They do not provide information about trend direction, but they are very useful for risk management and identifying market conditions. High volatility means prices are changing rapidly, while low volatility means prices are relatively stable. Key examples are:
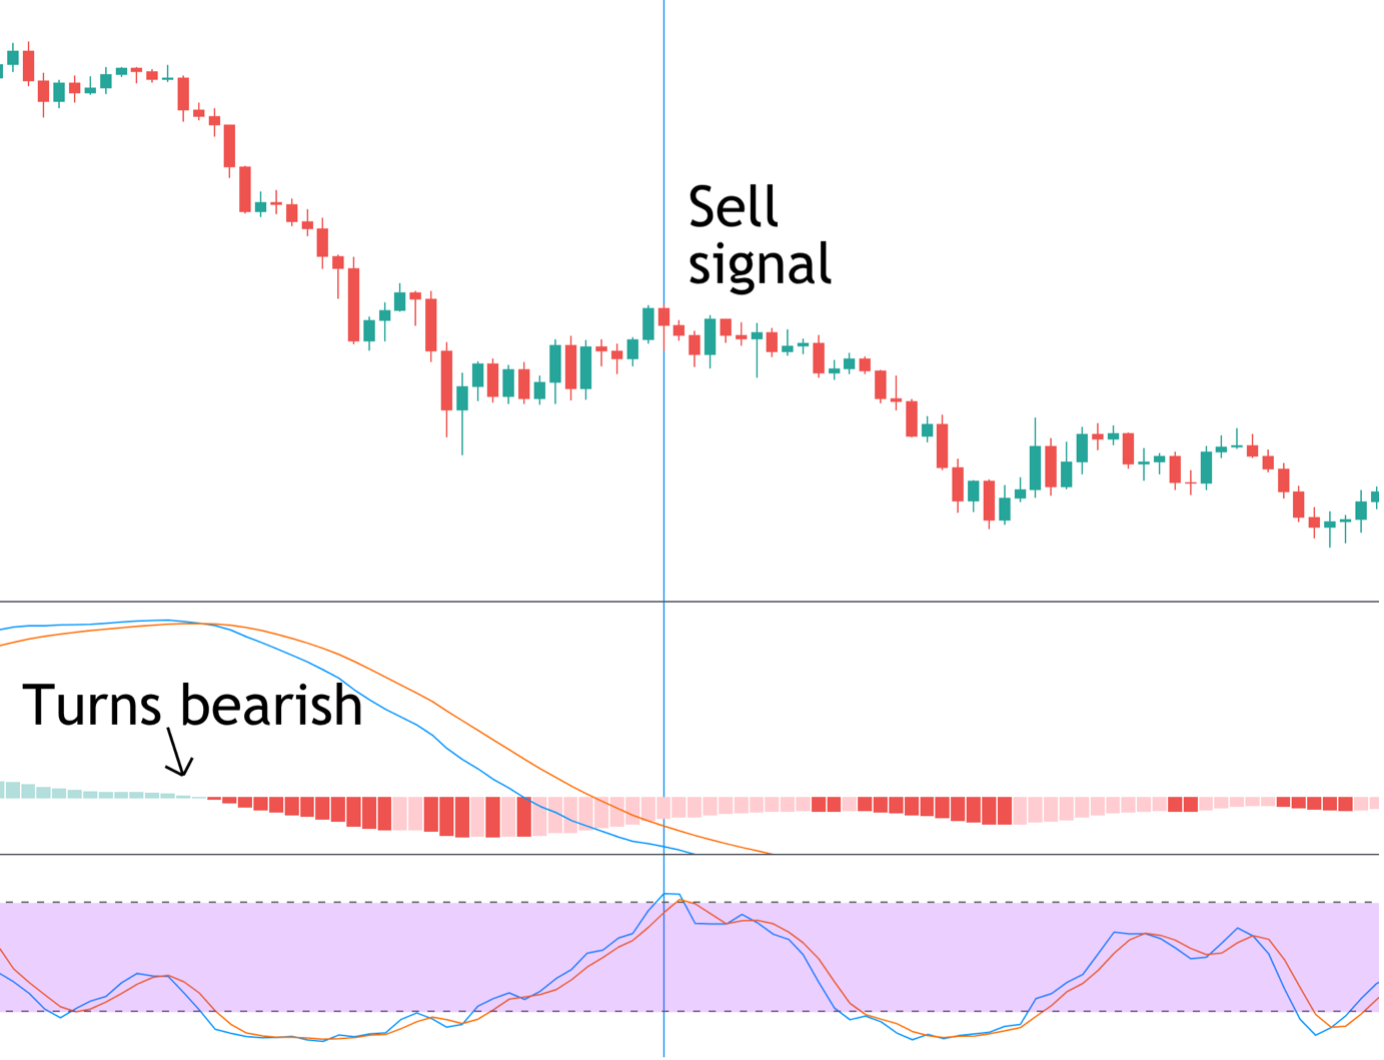
- Bollinger Bands: This indicator consists of three lines: a simple moving average (the middle band) and two outer bands that are typically two standard deviations away from the middle band. The bands widen when volatility increases and contract when volatility decreases. Traders use them to identify potential support and resistance levels and to gauge whether a market is trending or ranging.
- Average True Range (ATR): The ATR measures market volatility by calculating the average range between high and low prices over a specified number of periods. Its primary use is in risk management. A trader can use the ATR value to set a stop-loss order. For example, they might place their stop-loss at a distance of two times the ATR value from their entry price, ensuring the stop is adapted to the current market volatility.
What are the Core Principles for Combining Indicators Effectively?
The core principle for combining indicators is to use non-correlated tools that measure different aspects of the market, such as trend, momentum, and volatility, to avoid redundant signals. This ensures that each indicator in your strategy adds a unique piece of information, creating a system of checks and balances. Using indicators that show the same thing leads to a false sense of security and poor decision-making.
In detail, a successful combination is not about adding as many indicators as possible to a chart. In fact, that often leads to “analysis paralysis,” where conflicting signals make it impossible to act. The goal is to build a clean, logical system where each component has a specific job. Think of it like building a team: you don’t want a team of three quarterbacks. You want a quarterback (trend), a wide receiver (momentum), and a strong offensive line (volatility/risk management). Let’s examine the “why” behind this principle.
Why Should You Combine Different Indicator Types?
You should combine different indicator types because they provide complementary, not conflicting, information, creating a more complete and robust analysis of the market. This is the principle of non-correlation. Each type of indicator is designed to measure a unique market dynamic. By layering them, you confirm a trading idea from multiple angles.
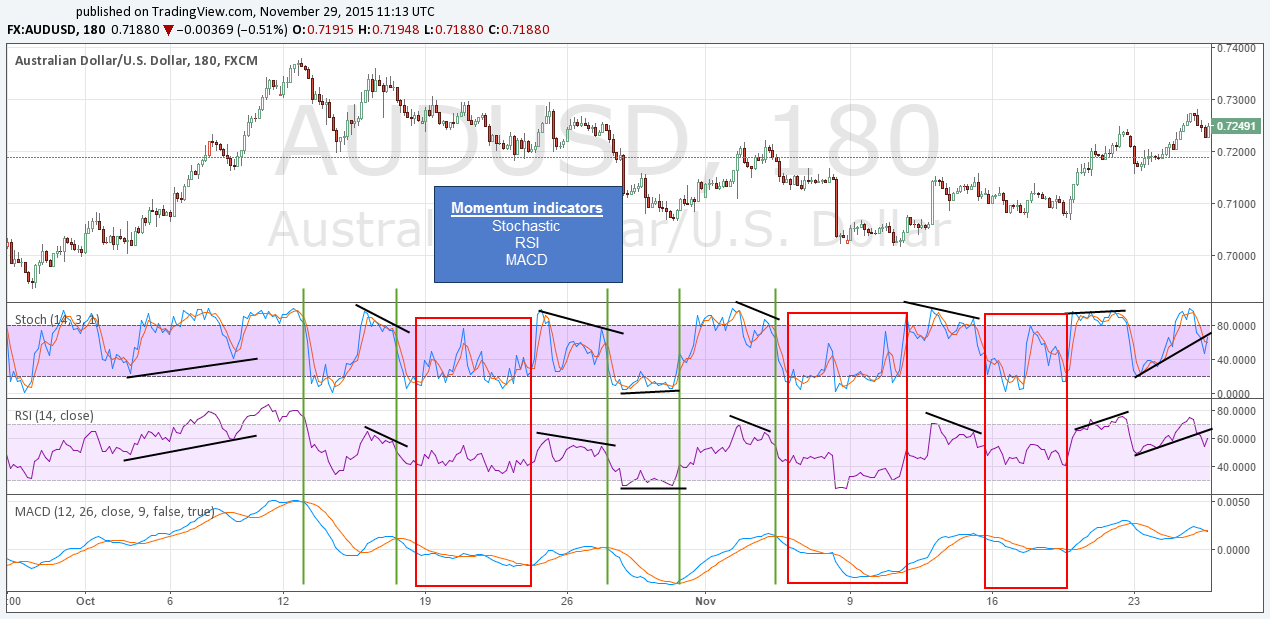
For example, let’s say you want to enter a long (buy) trade in the EUR/USD pair.
1. Trend Indicator: You start with a 100-period Simple Moving Average (SMA). You see that the price is currently trading above the 100 SMA, which tells you the medium-term trend is bullish. This is your first piece of evidence.
2. Momentum Indicator: Now, you need to find a good entry point. You add the Stochastic Oscillator. You wait for the price to pull back toward the 100 SMA and for the Stochastic to dip into the oversold area (below 20). When the Stochastic lines cross and start moving up out of the oversold zone, it signals that bullish momentum is returning. This is your second piece of evidence.
The SMA told you which direction to trade, and the Stochastic told you when to trade. One confirmed the other. Without the Stochastic, you might have bought as soon as the price touched the SMA, only for it to break below. Without the SMA, you might have bought an oversold signal from the Stochastic in the middle of a strong downtrend. By combining them, you align your entry with both the broader trend and short-term momentum.
Why Should You Avoid Combining Similar Indicators?
You should avoid combining similar indicators because it leads to a problem called multicollinearity, which is just a technical term for information redundancy. When you use two or more indicators from the same category, they are often derived from the same price data and will give you the same signals at roughly the same time. This creates a dangerous illusion of strong confirmation when, in reality, you are just hearing the same message twice.
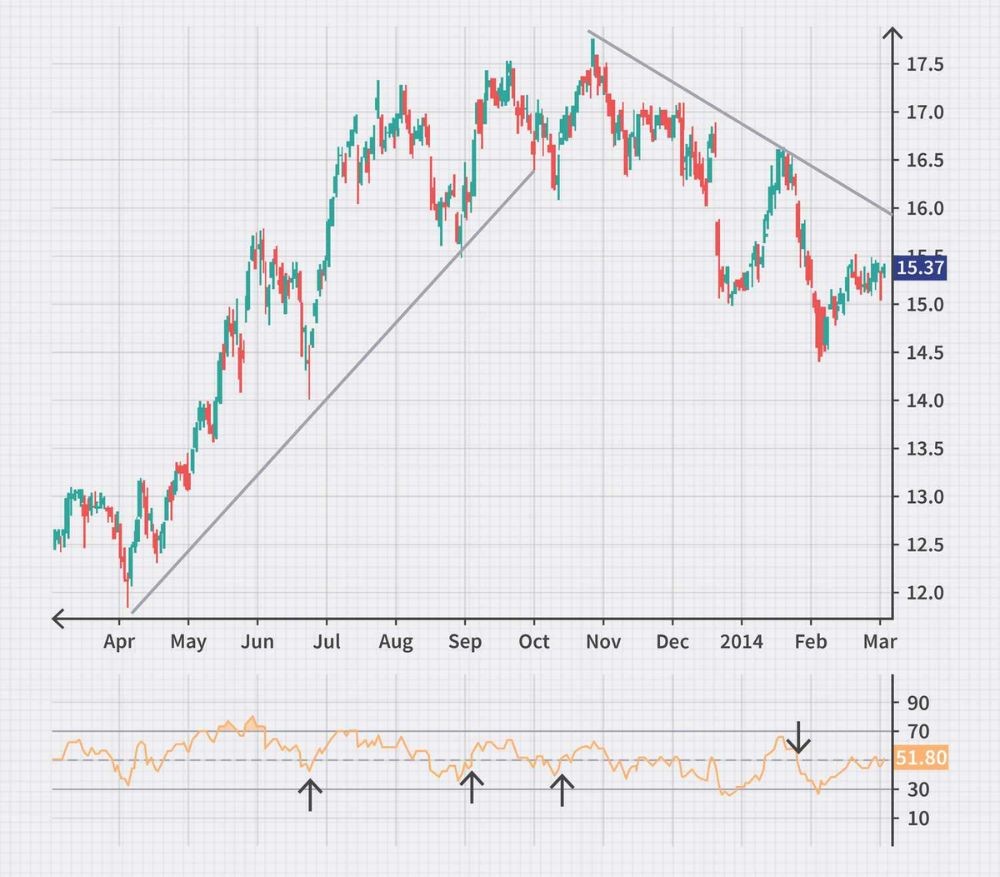
For instance, a common mistake for new traders is to use the Relative Strength Index (RSI), the Stochastic Oscillator, and the Williams %R on the same chart. All three are momentum oscillators that measure overbought and oversold conditions. If all three are showing “oversold,” a trader might feel extremely confident in their buy signal. However, all three indicators are essentially telling them the same thing: that the price has recently moved down quickly relative to its recent range. This doesn’t add any new information. It simply amplifies one single piece of data.
This overconfidence can lead to taking on too much risk or ignoring other important market factors. If the underlying trend is strongly bearish, that oversold signal from three oscillators is more likely to be a small pause before the next leg down, not a major reversal point. A much better approach would be to use one of those momentum oscillators and combine it with a trend indicator like a moving average and a volatility indicator like the ATR. This would give you three independent perspectives on the market, not one perspective repeated three times.
How Do You Combine Indicators on a Chart in 3 Steps?
You combine indicators by following a three-step process: first identify the primary trend, then time an entry with a momentum oscillator, and finally set your exits using a volatility measure. This structured method ensures that you are trading in harmony with the market’s main direction while using confirmation to find high-probability entry points and logical risk management levels. This top-down approach removes guesswork and emotional decision-making.
Let’s explore this practical framework. This system is designed to be clear and repeatable, providing a solid foundation for any forex trader. By following these steps in order, you create a complete trading plan for every setup, from initial analysis to final exit. This process works on any timeframe and for any currency pair.
Step 1: How Do You Identify the Primary Trend?
The first and most important step is to determine the overall market direction. Trading with the trend is often described as swimming with the current instead of against it; it dramatically increases your chances of success. A simple and effective tool for this is a long-term moving average.
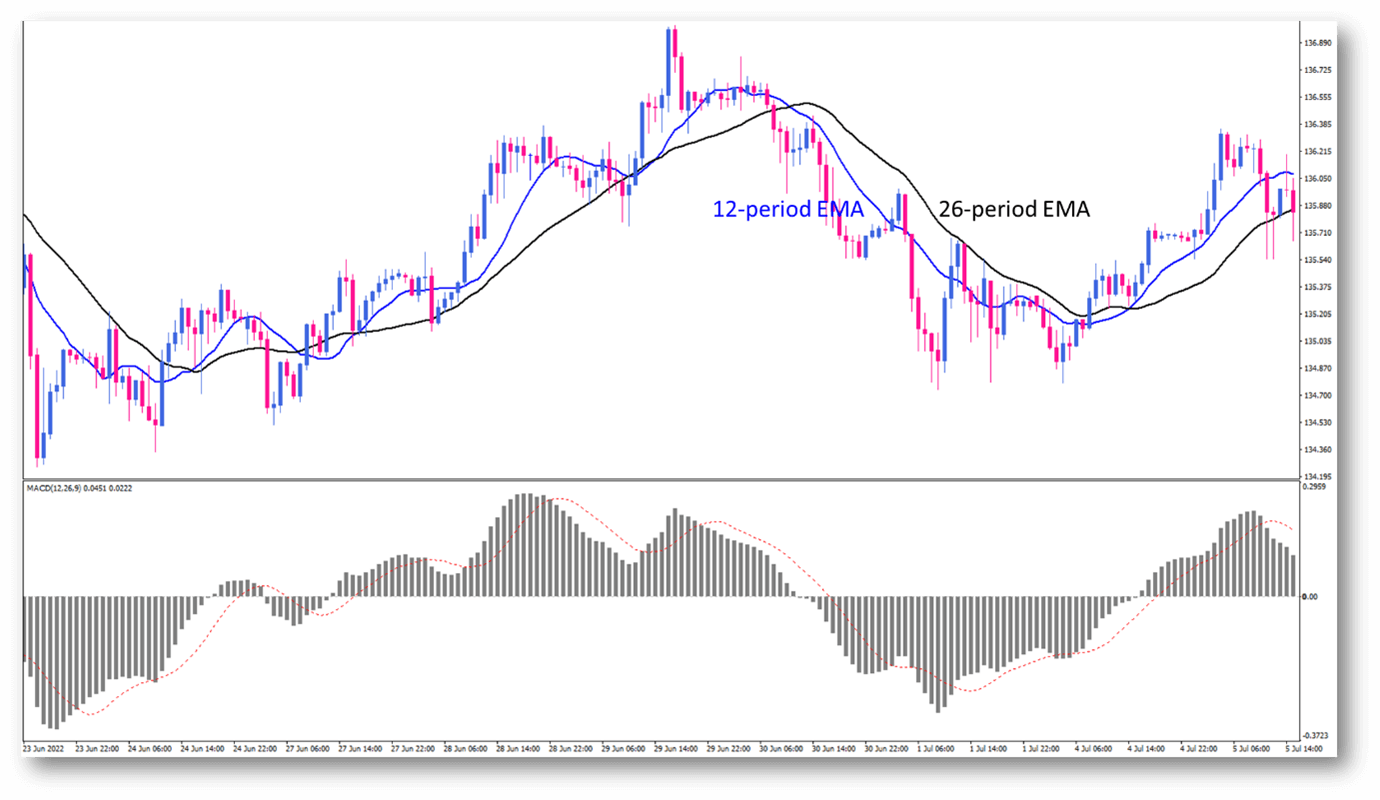
For this step, you will add a 200-period Exponential Moving Average (EMA) to your chart. The 200 EMA is widely followed by institutional traders and acts as a key dividing line between bullish and bearish market territory. The rule is simple:
- If the price is trading above the 200 EMA, the primary trend is considered up (bullish). In this case, you should only be looking for buying opportunities.
- If the price is trading below the 200 EMA, the primary trend is considered down (bearish). Here, you should only be looking for selling opportunities.
By establishing this directional bias from the start, you immediately filter out half of all potential trading signals. For example, if the price is above the 200 EMA, you will ignore all sell signals from any other indicator you use. This single rule prevents you from fighting the market’s dominant momentum and keeps you focused on higher-probability setups.
Step 2: How Do You Time an Entry with a Momentum Oscillator?
Once you have identified the primary trend, the next step is to find an optimal entry point. You don’t want to buy at the very top of an uptrend or sell at the very bottom of a downtrend. Instead, you want to enter on a pullback, which is a temporary move against the main trend. This is where a momentum oscillator comes in.
For this step, you will add the Relative Strength Index (RSI) with a standard 14-period setting to your chart. The RSI will help you identify when a pullback is likely exhausted and the main trend is ready to resume. Here is how you use it in combination with the trend you identified in Step 1:
- In an uptrend (price above 200 EMA): Wait for the price to pull back towards the 200 EMA. At the same time, watch the RSI. You are looking for the RSI to dip into the oversold area (below 30). Your entry signal occurs when the RSI crosses back up above the 30 line. This indicates that the bearish momentum of the pullback is fading and the bulls are taking control again, in alignment with the primary trend.
- In a downtrend (price below 200 EMA): Wait for the price to rally back towards the 200 EMA. Watch for the RSI to move into the overbought area (above 70). Your entry signal occurs when the RSI crosses back down below the 70 line. This suggests the bullish momentum of the rally is exhausted and the main bearish trend is resuming.
Step 3: How Do You Set Exits Using Volatility?
The final step is to manage your risk and define your exit plan. Every trade needs a stop-loss order to protect your capital if the market moves against you and a take-profit target to lock in gains. A volatility indicator is the perfect tool for this because it helps you set these levels based on the market’s current behavior, not arbitrary price levels.
For this step, you will add the Average True Range (ATR) indicator with a 14-period setting. The ATR provides a value that represents the average price movement over the last 14 periods. You can use this value to set objective exit points.
- Setting Your Stop-Loss: A common method is to place your stop-loss at a multiple of the current ATR value. For example, you might place your stop-loss at a distance of 2 times the ATR value away from your entry price. If you enter a long trade at 1.1050 and the ATR value is 0.0015 (15 pips), your stop-loss would be placed at 1.1050 – (2 * 0.0015) = 1.1020. This gives your trade enough room to breathe and avoids getting stopped out by normal market noise.
- Setting Your Take-Profit: You can use a similar logic for your take-profit target. To create a positive risk-to-reward ratio, you might set your take-profit target at a distance of 2 to 3 times your stop-loss distance. For example, if your stop-loss is 30 pips away (2 x ATR), you could set your take-profit target 60 or 90 pips away from your entry price. This ensures that your potential winners are larger than your potential losers, a key component of long-term profitability.
What Are Some Advanced Concepts in Indicator Strategy?
Advanced indicator concepts involve using divergence, multi-timeframe analysis, and a clear understanding of confirmation versus confluence to filter trades and avoid common pitfalls like analysis paralysis. Furthermore, mastering these techniques allows a trader to move beyond basic signal generation and develop a more nuanced, contextual approach to market analysis.
What is the Difference Between Confirmation and Confluence?
While often used interchangeably, confirmation and confluence represent different layers of analytical agreement. Confirmation specifically refers to using one technical indicator to validate a signal generated by another. For instance, if you see a bullish moving average crossover, you might look for the Relative Strength Index (RSI) to move above 50 to confirm the upward momentum. This is a one-to-one validation between two technical tools.
Confluence, on the other hand, is a much broader concept. It describes a scenario where multiple, independent analytical factors all point to the same trading conclusion. These factors can include:
- Technical indicators from different categories (e.g., trend, momentum, and volatility).
- Key price action signals like a pin bar or engulfing candle at a support level.
- Chart patterns such as a head and shoulders bottom or a bullish flag.
- Fundamental drivers that support the trade direction.
Confluence creates a higher-probability setup because the trade thesis is supported by several unrelated pieces of evidence, reducing the reliance on any single indicator.
What are the Most Common Mistakes to Avoid When Combining Indicators?
Traders often fall into several predictable traps when attempting to combine indicators, which can undermine an otherwise solid strategy. To avoid these issues, it is helpful to recognize them before they become habits.
- Over-cluttering the Chart: This is often called “analysis paralysis.” Placing too many indicators on a chart creates a confusing visual with conflicting signals. A clean chart with two or three complementary indicators is far more effective than one with seven that obscure the most important factor: price itself.
- Using Redundant Indicators: A frequent mistake is combining multiple indicators that measure the same thing. For example, using the RSI, Stochastic Oscillator, and Commodity Channel Index (CCI) together is redundant. All are momentum oscillators and will largely provide the same information, adding noise rather than clarity.
- Ignoring Price Action: Indicators are mathematical derivatives of price and volume. They should supplement price action analysis, not replace it. A trader who relies solely on an indicator crossover while ignoring a strong bearish candlestick pattern at a resistance level is trading with incomplete information.
- Mismatching Indicator Types: Combining two lagging indicators, such as two different moving averages, will only tell you what has already happened with a slight variation. An effective combination often pairs a lagging indicator for trend with a leading one for entry timing.
How Can Divergence Be Used with Combined Indicators?
Divergence is a powerful concept that signals a potential reversal when price and a momentum indicator move in opposite directions. For example, bullish divergence occurs when the price makes a new lower low, but an indicator like the MACD or RSI makes a higher low. This suggests that downward momentum is weakening. Conversely, bearish divergence happens when the price records a higher high, but the indicator forms a lower high, signaling that upward momentum may be fading.
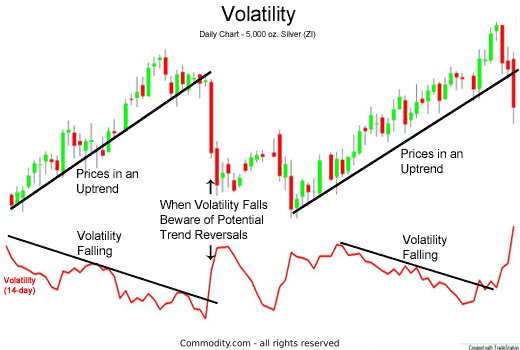
By itself, divergence is not a perfect entry signal; it is a warning. This is where combining it with another indicator for confirmation becomes valuable. A trader might spot bearish divergence on the RSI. Instead of immediately selling, they could wait for a confirmation signal from a trend indicator. For instance, they could wait for the price to cross below a 20-period Exponential Moving Average (EMA). The divergence identifies the potential for a reversal, and the EMA cross confirms that the price has started to move in that new direction, providing a more reliable entry point.
How Does Multi-Timeframe Analysis Improve Combined Signals?
Multi-timeframe analysis is a technique that dramatically improves the quality of trading signals by providing market context. It involves looking at the same asset across different chart durations to align trades with the dominant market trend. The core idea is to establish a directional bias on a higher timeframe and then seek entry signals on a lower timeframe that agree with that bias. This helps filter out weak or counter-trend signals that are likely to fail.
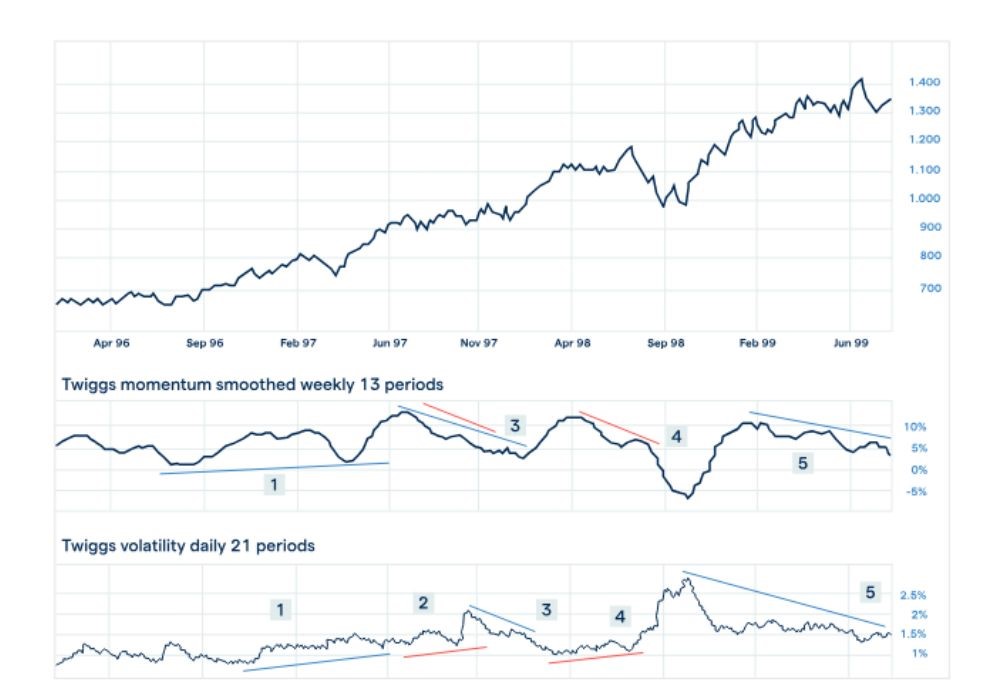
A common approach is the “top-down” method. First, a trader might use a daily chart to determine the long-term trend, perhaps using a 200-period Simple Moving Average (SMA). If the price is trading above the 200 SMA, the primary bias is bullish. With this bullish bias established, the trader then drops down to a 4-hour or 1-hour chart to look for buy signals. On this lower timeframe, they might use a combination like a MACD crossover and an RSI reading above 50 to pinpoint precise entries. By only taking long trades, they are trading in harmony with the larger market structure, which increases the probability of success.
Should You Combine Leading or Lagging Indicators?
The most effective strategies often involve combining one leading indicator with one lagging indicator, as they serve distinct and complementary purposes. Lagging indicators, such as Moving Averages or the MACD, are based on past price data and are used to confirm that a trend has already begun. They are reactive, not predictive. Their strength lies in keeping a trader on the right side of a sustained market move, helping to filter out the noise of short-term fluctuations.
In contrast, leading indicators, like the Relative Strength Index (RSI) or the Stochastic Oscillator, are designed to anticipate future price movements by measuring momentum. They can signal overbought or oversold conditions, suggesting a reversal may be imminent. While they offer earlier entry signals, they are also prone to generating more false signals, especially in strongly trending markets. By combining one of each type, a trader can create a balanced system. For instance, use a 50-period moving average (lagging) to confirm an uptrend. Then, use the RSI (leading) to identify oversold conditions within that uptrend as a potential buying opportunity. This approach uses the lagging indicator for direction and the leading indicator for timing.